What Is the ATR Indicator and How to Use It for Stop Loss?
It’s hard to know what will happen in trading because the market is constantly changing over short periods. Price changes, exchange volume, and movements can all be large or small.
This is where the ATR indicator can help traders understand how much the market typically moves. ATR does not predict price direction, but it gives traders a useful way to estimate market movement, which is important for risk management.
In this article, we will take a look at what ATR is, how it works within Forex, and how to use ATR to place stop loss orders more smartly and effectively.
What Is the ATR Indicator?
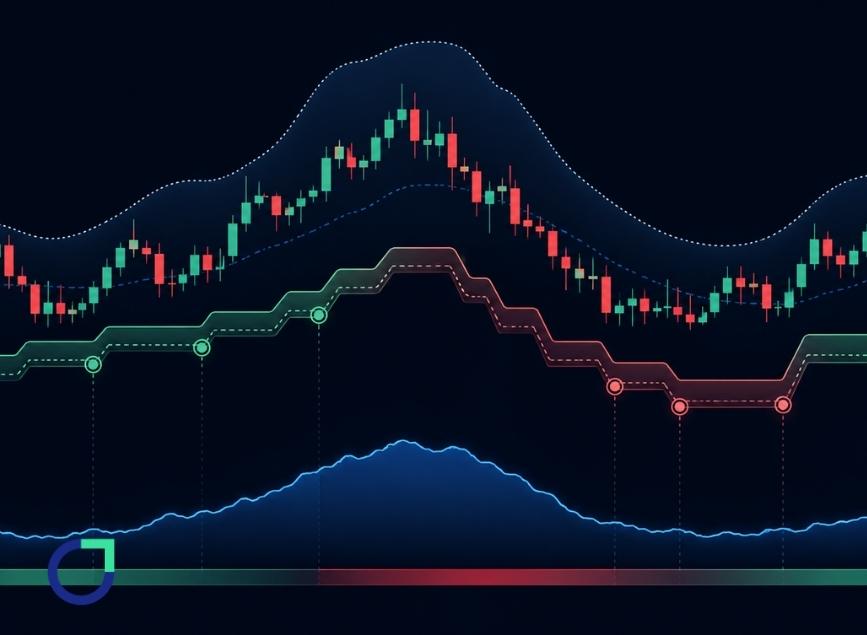
The Average True Range (ATR) is a technical indicator that measures market volatility. It was developed by J. Welles Wilder Jr. and then introduced in his 1978 book New Concepts in Technical Trading Systems. It’s the same person who invented many other well-known trading indicators.
ATR focuses on the size of price movement rather than on the direction of the price change. For instance, if a specific currency pair moves 50 pips per day, then a trader should take this into consideration as to how far away from the present price they place their stop loss.
One of the most common mistakes that new traders make when placing a stop loss is applying the same distance for each trade; however, the price behavior of the market varies day by day. Some days are calm with little or no price changes, while other days have strong price movements. ATR provides traders with a means of determining the trade conditions and adjusting accordingly to make an informed decision.
The “True Range” is the largest of three values the distance from the current high to the current low, from the previous close to the current high, or from the previous close to the current low. ATR then averages these values over a set number of periods (usually 14) to give you a single number representing typical price movement.
How Does ATR Work in Forex Trading?
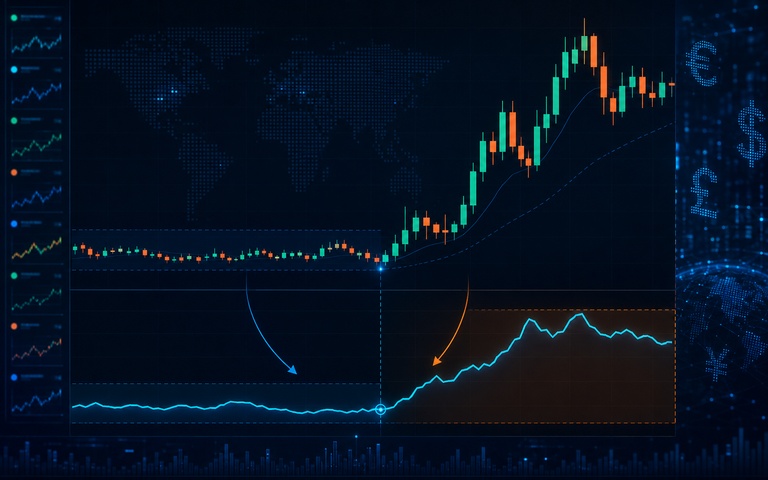
Volatility in forex trading is always changing. For example, the EUR/USD has periods of slow price movement followed by periods of large, rapid price movement.
The ATR calculation looks at the true range of recent candles. It considers factors such as the current high, current low, and the previous closing price. The result provides traders with an average measure of recent price movement.
For example, if the ATR indicates that a pair typically moves about 80 pips, placing a stop-loss only 20 pips away might not give the trade enough room. Normal market movement could close the trade even if the original idea was correct.
This is where an ATR trading strategy can help. Instead of choosing a random stop distance, traders use market volatility as a guide.
| Market Condition | ATR Reading | Possible Trading Approach |
| Low volatility | Small ATR value | Use smaller targets and tighter risk control |
| Medium volatility | Balanced ATR value | Normal trading conditions |
| High volatility | Large ATR value | Give trades more space and manage risk carefully |
It’s also significant that the ATR is not static and can vary with the market over time. No trader should view the ATR as a number to hold consistently regardless of what the market is doing each passing day.
Traders who use cTrader platforms and other modern trading systems frequently use ATR-based tools that help them analyze price volatility more effectively.
How to Use ATR for Setting Stop Loss?
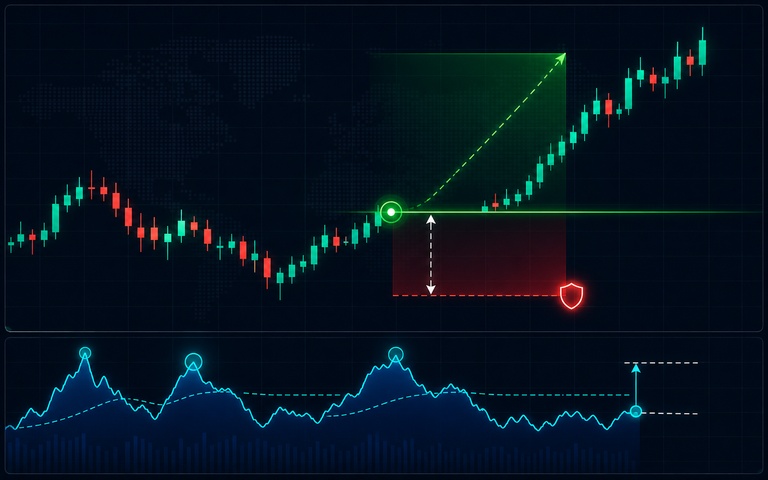
ATR is frequently used to guide a trader on the placement of stop losses. A stop loss must protect from account loss while also allowing sufficient space for market fluctuations in the average price range (which is expressed as average true range).
A common method for determining an adequate distance at which to place a stop loss is multiplying the average true range value by some factor such as 1.5, 2, or 3. For instance, if the ATR value is 50 pips, and you use a factor of 2, your stop loss distance will be approximately 100 pips from your entry price.
This way of developing ATR stop losses will change as market conditions change; when volatility increases, the stop loss will widen; when price fluctuations decrease, the stop loss will tighten.
However, a trader should not risk more than they would otherwise based on a wider stop loss – you will usually need to reduce your position size to maintain control of the total amount risked.
Traders studying the importance of risk protection may also want to research and understand topics such as what is a stop out to better understand how to manage trade size and stop placement.
Here is a simple example to demonstrate.
Assuming that a trader buys GBP/USD and that the ATR showed that it typically moved 60 pips during an average period, rather than placing their stop loss at 25 pips from their entry point, they decided to multiply the ATR by 2, which placed their stop loss at 120 pips away, giving them a greater buffer against price fluctuations.
So the important point here is that the trader should use the ATR to support their trading plan, not replace it.
ATR Trading Strategies for Beginners and Professional Traders
New traders often look for that elusive perfect indicator to give them the exact time to enter or exit a trade. Experienced traders, on the other hand, use multiple sources of data rather than rely on just one tool as their guide.
There are many different ways to approach an ATR-based strategy. Some traders will only use the ATR for placing stops; other traders will only use the number to help manage their profit targets or assess changing market conditions.
A good, simple starting point is to:
- Measure the current ATR value of the asset.
- Compare that to how much the price has moved recently.
- Decide if you will need more or less room in your trade.
- Use your calculated risk to adjust your position size.
In addition to using the above approach, professional traders will often pair their ATR with other tools like trend lines, support and resistance levels, or market structure analysis. For example, if the asset has recently been trending up and the ATR has started moving up also, this would imply that there were more people getting involved in the market than before.
However, just because volatility is increasing does not mean there is an opportunity to profit. There can be many instances of volatility simply translating into more uncertainty in the market.
A good understanding of Market Momentum in Forex, along with an understanding of how price has moved, can also assist traders with making better decisions regarding the correlation between volatility and price movement.
One more component of successfully implementing a trader habit would be with regard to quality materials, such as Best Risk Management Tools for Forex Traders, controlling their losses is often considered to be as important as finding an actual winning trade.
It is better to learn from reliable sources and tested methods instead of following unclear information that has not been properly explained.
ATR vs Other Volatility Indicators
There are many different ways to assess volatility. One of those tools is Average True Range (ATR), which traders use for their analysis of volatility.
The difference between ATR and other analysis indicators like Bollinger Bands is that ATR provides a measure based on averages over time, but does not provide directional information about the price’s direction either way.
Bollinger Bands can help traders evaluate the direction of the price movement in relation to its average price through their bands, which are also identified in relation to other banded prices as well. This can indicate whether the price of an asset is potentially overextended.
| Indicator | Main Purpose | Useful For |
| ATR | Measures average volatility | Stop loss and risk planning |
| Bollinger Bands | Shows price range and volatility | Identifying price expansion or contraction |
| Standard Deviation | Measures price variation | Advanced volatility analysis |
Both tools can be useful, but the better choice depends on how a trader approaches the market and what they want to understand. A day trader may use ATR to manage quick trades, while a longer-term trader may use it to understand whether the current market movement is unusual.
Conclusion
The ATR is one of the simplest yet most useful indicators for traders. Although it doesn’t tell you where the market will go, it does show how active the market has been.
When determining where to place your stop loss, you can use ATR to help ensure that your stop is not placed too close or too far. As such, it should be used in conjunction with sound risk management and a well-defined trading plan.
Educational resources and market insights provided by Otet can also help traders better understand how to apply ATR within different trading strategies and market conditions.
As with anything related to trading, it is best to use the ATR in combination with patience, experience, and realistic expectations when determining potential opportunities and protecting your trading account.
Over time, traders can become more comfortable using ATR by observing how it reacts in different market situations. The goal is not to remove uncertainty completely, because no indicator can do that, but to build a clearer and more disciplined approach to managing trades and protecting capital.
Understanding ATR is not about finding a guaranteed way to win trades, but about making smarter decisions with better awareness of market conditions. When used correctly, ATR can help traders create more balanced risk plans, avoid emotional decisions, and adapt their strategies when the market environment changes.
FAQ
The ATR indicator shows traders how much the price has been moving recently. It helps them understand whether the market is calm or active. It does not show whether prices will rise or fall.
Yes, many forex traders use ATR because it helps them adjust their approach based on changing market conditions. It is especially useful for planning risk and managing trade expectations.
The common ATR setting is 14 periods, but the best choice depends on the trader’s strategy. Short-term traders may use smaller settings, while longer-term traders may prefer larger settings.
Traders usually multiply the ATR value by a chosen number and use the result as the stop loss distance. The exact method depends on risk tolerance and trading style.
No. ATR only measures volatility. It does not tell traders if the market will move higher or lower.
A trader should combine volatility information with other analysis methods.
Neither indicator is always better. ATR is often simpler for measuring volatility, while Bollinger Bands provide additional information about price position and movement.
The better option depends on what a trader wants to understand from the market.
Share
Hot topics
What Is a Pin Bar Candlestick and What Signal Does It Give?
A price chart shows what has happened or is going to happen in the market according to the buyers and sellers, and in some case’s just one candle has the...
Read more


Submit comment
Your email address will not be published. Required fields are marked *