What Is a Pin Bar Candlestick and What Signal Does It Give?
A price chart shows what has happened or is going to happen in the market according to the buyers and sellers, and in some case’s just one candle has the power to let you know that there is a shift in power coming before it starts. One of the most popular price-action patterns amongst traders is the Pin Bar Candlestick which can be useful for identifying potential reversal points or continuation points in a trend.
Although it may seem simple, pin bars should never be taken on their own. Their location in relation to surrounding structures in the market and in relation to the overall trend, both help determine if it is worth taking this opportunity/indicator. This pin bar candlestick guide will give you the how’s and why’s of pin bars along with some ideas on how to use them more effectively while at the same time not over complicating the process.
What Is a Pin Bar?
A pin bar is one of the single candlestick patterns that illustrate an extreme rejection of price. The market will exhibit extreme moves in one direction only to close near the opening price of that particular candle. This creates a long wick and the body of the candlestick will be small in relation to the length of the wick.
The implication of this is that one side of the market (i.e., buyers or sellers) attempted to exert their influence over the market and were ultimately unsuccessful. For example, buyers could have pushed price much higher only to have sellers push the price back down to where it started.
Alternatively, sellers could have dominated at first and then buyers stepped in.It is similar to a ball being thrown straight up into the air. It goes up for a short time and then comes back down again due to gravity. The pin bar indicates that the market attempted to hold at a certain price, but ultimately failed to do so.
As such, many price action traders view the pin bar as an alert that momentum may be shifting. However, it should be noted that the pin bar itself is just one piece of the overall picture.Professional traders do not typically enter a trade based solely on the presence of a pin bar. Rather, they ask the question of why the rejection occurred at this price level.
One of the best places to answer that question is around Supply and Demand Zones in Professional Trading. When a pin bar forms at an area where institutional buying or selling has previously occurred, the signal often becomes much more meaningful.
Anatomy of a Pin Bar Candle
Recognizing a pin bar is straightforward once you understand its structure.
A proper pin bar contains three main components:
- A long wick or shadow
- A small real body
- A very short or almost invisible wick on the opposite side
The long wick is the most important feature because it represents the market’s rejection of higher or lower prices.
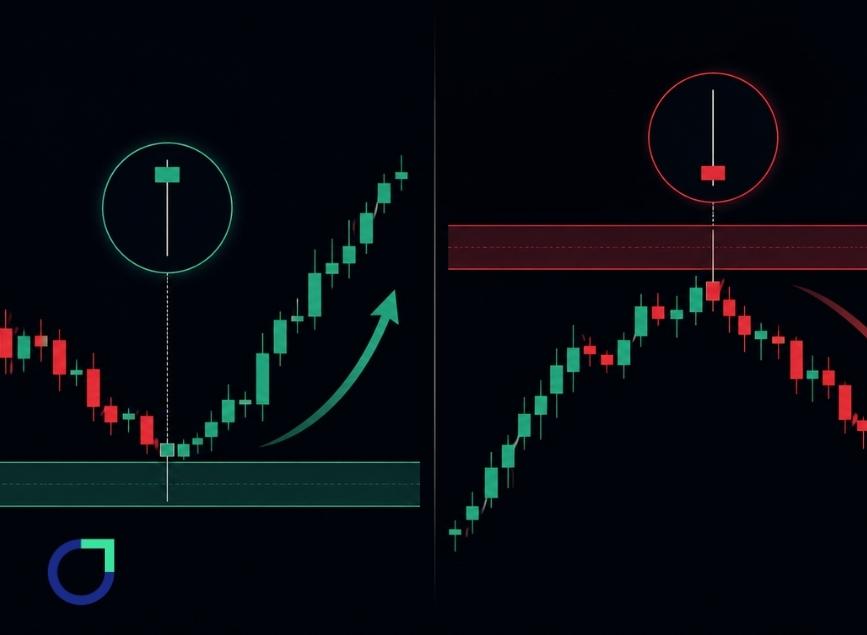
For a bullish pin bar, the long lower wick shows that sellers pushed prices downward before buyers regained control and closed the session near the top of the candle.
For a bearish pin bar, the long upper wick tells the opposite story. Buyers initially drove prices higher, but sellers entered aggressively and forced the market back down before the candle closed.
Generally speaking, the longer the rejection wick compared to the candle body, the stronger the signal may become. However, size alone does not guarantee success. Context always matters.
| Bullish Pin Bar | Bearish Pin Bar |
| Small body near top | Small body near bottom |
| Long lower wick | Long upper wick |
| Buyers rejected lower prices | Sellers rejected higher prices |
| Often signals bullish pressure | Often signals bearish pressure |
Bullish Pin Bar vs Bearish Pin Bar
While both patterns indicate that selling pressure has occurred, the basis for trade rejection is much different.A bullish pin bar is a rejection of price after a downward move. The long lower shadow shows that the bears (sellers) attempted to push market prices further down but were overpowered by bulls who were able to reverse most of these losses before the close of trading.
Because control has changed and there is diminished selling pressure, there may be some traders who will look for an opportunity to buy at this point. However, this does not mean that there will be a subsequent uptrend.
The opposite of a bullish pin bar is a bearish pin bar. Here, initial buying (bullish) pressure began pushing prices up, but in the end, selling (bearish) pressure increased relative to the buying pressure and forced the candle to close lower.
When these patterns develop near significant resistance points they are an indication of loss of strength in the price rally and of trader caution.By comparing each of these patterns, the reader will have a much better understanding of their respective characteristics.
| Feature | Bullish Pin Bar | Bearish Pin Bar |
| Long Wick | Lower wick | Upper wick |
| Market Rejection | Lower prices | Higher prices |
| Potential Signal | Buying opportunity | Selling opportunity |
| Common Location | Support | Resistance |
| Trader Bias | Bullish | Bearish |
What Signals Does a Pin Bar Provide?
The biggest message behind a pin bar is rejection.
Markets constantly test new prices. Sometimes those tests succeed, and trends continue. Other times they fail dramatically, creating a rejection candle that suggests participants are no longer willing to trade beyond a certain level.
This rejection can signal several different possibilities.
The first is a potential market reversal. If a bullish pin bar forms after an extended decline, buyers may finally be gaining enough confidence to challenge sellers.
The second possibility is trend continuation.
For example, imagine a strong uptrend. Price temporarily pulls back before printing a bullish pin bar at a support level. Instead of signaling a reversal, the candle may simply indicate that buyers are ready to continue the existing trend.
This is why experienced traders always evaluate market structure first. Understanding How to Optimize Forex Entries and Exits Like a Pro often involves waiting for multiple factors to align rather than relying on one candle pattern alone.
Volume, support and resistance, trend direction, and market momentum all add valuable confirmation.
Another useful lesson is learning when not to trade. Pin bars that appear in random areas without any technical significance often produce unreliable signals.
Best Locations to Trade Pin Bars
Location is often more important than the pin bar itself. A perfect-looking candle in the middle of a sideways market may offer very little value, while an average-looking pin bar at a major support level can become an excellent trading opportunity.
One of the best locations to look for bullish pin bars is near established support levels. These are areas where buyers have previously entered the market and may be willing to defend prices again.
Likewise, bearish pin bars become more meaningful when they appear near resistance levels. These price zones often attract selling pressure, making rejection candles more reliable.
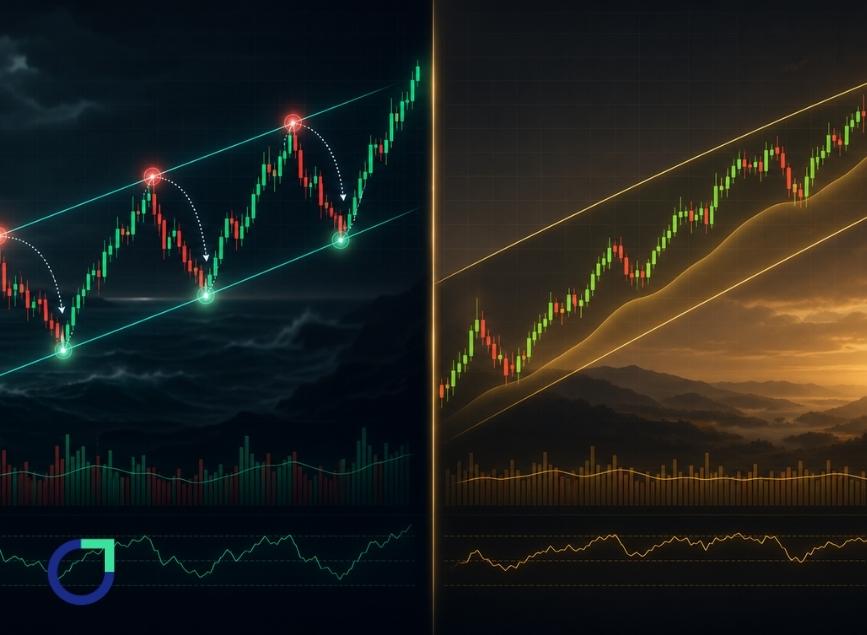
Trendlines can also improve the quality of a setup. If price pulls back to an upward trendline and forms a bullish pin bar, traders have two technical reasons to consider a long position instead of relying on the candle alone.
Moving averages provide another layer of confirmation. A pin bar that forms near a widely watched moving average, such as the 50-day or 200-day average, often receives more attention from market participants.
Higher timeframes usually produce stronger signals because they filter out much of the market noise found on lower charts. A daily pin bar generally carries more weight than one that appears on a five-minute chart.
Before entering any trade, many traders also check whether the overall market environment supports the idea. Even the strongest candlestick pattern becomes less effective when it goes directly against a powerful long-term trend.
Common False Pin Bar Setups
Not every candle with a long wick is a valid pin bar. One of the most common mistakes beginners make is assuming that every rejection candle deserves a trade.
A frequent false setup appears during low-volume or quiet market sessions. In these conditions, price can move sharply for a short period before returning to normal levels, creating a candle that looks convincing but has little real meaning.
Another poor setup occurs inside choppy, sideways markets. When buyers and sellers constantly push price back and forth, rejection candles become common but often lack direction.
News events can also create misleading pin bars. Major economic announcements may cause sudden spikes that leave long wicks on the chart, but these moves are often driven by temporary volatility rather than genuine changes in market sentiment.
Trading against the dominant trend is another common mistake. A bullish pin bar appearing during a strong downtrend may seem attractive, but without additional confirmation, the probability of success can be much lower.
Patience helps eliminate many of these poor-quality trades. Waiting for confirmation from the next candle or from nearby technical levels often leads to better decisions than reacting immediately.
Combining Pin Bars with Other Indicators
Although price action traders often focus primarily on candles, combining pin bars with other technical tools can improve trade quality.
Resistance and support are often cited as two of the most reliable sources of confirmation. A pin bar that has rejected a previously established level is often considered to provide a stronger signal than a pin bar that has formed on an open bar.
Moving averages are an example of trend-following indicators that can help you identify whether to look for buying or selling opportunities. Trading in the direction of a trend generally improves the probability of success.
Momentum indicators (such as RSI or MACD) also provide additional confirmation that the buying/selling pressure is starting to decline.
Many traders track volume as well. A significant volume associated with a rejection candle may also suggest institutional involvement in the signal, adding credibility.
Today’s trading platforms make this type of analysis relatively easy. Establishing a metatrader5 account allows you to access various charts, indicators, and asset classes from a single location even if you are back-testing a strategy or monitoring the live market.
Education is also extremely important to a trader’s success. Trading education from reputable sources like otet can teach you how to incorporate candlestick patterns into your larger analysis instead of treating them as individual systems.
The intention is not to fill up your chart with too many indicators. It may be more beneficial to combine a small number of complementary tools that confirm the same trade while facilitating objective, straightforward analysis.
Conclusion
Long wick; Represents at moment Price rejection, (pin bar) Defining characteristic; Provides insightful view into market activity/balance between buyer/sellers
Although no candlestick pattern guarantees success, the most reliable pin bars can be identified at strong support/resistance areas, where price bars are formed, are in alignment with the overall market structure and have an accompanying confirmation through other technical analysis tools.
Instead of focusing purely on identifying perfect quality looking candles, successful traders tend to evolve their ability to read candle stick patterns as they learn to tell a story through their price action. Thus, when they have the necessary elements in developing their candle pattern response, (patience, solid risk management, and sound context) pinbar price action can be very effective in creating a well-rounded trading plan.
As with any trading skill, the ability to identify high-quality setups increases with practice. By reviewing old charts regularly to analyze the evolution of various trades documented in a trading journal, and through testing your ideas before you placed real capital at risk will ultimately help develop your confidence significantly more than just blindly chasing every price action signal that’s available at any given time.
FAQ
A pin bar is often viewed as a reversal signal as it indicates a strong rejection of price level(s). Nevertheless, a continuance signal (a signal of a continuation) can occur when a pin bar forms in the midst of a healthy trend following a short term pullback. The true value of any pin bar is based upon the surrounding market context.
Pin bars can appear on any timeframe, but many traders consider the daily and four-hour charts to be the most reliable. Higher timeframes generally reduce market noise and produce stronger signals than very short-term charts.
One cannot rely solely on a pin bar's accuracy until it is used as a confirmation for the support or resistance it is being traded with, the overall trend that it will be moving with, and has confirmation from other technical indicators such as moving averages or momentum.
Pin bars often show up in existing trends and are common indicators of a pullback being finished, as well as the primary trend likely starting again. For this reason, experienced traders always review the overall market structure prior to taking any trading decisions.
Share
Hot topics
Trend Trading vs Trend Following: Which Strategy Is Better?
When it comes to trading on financial markets, traders have many options in terms of their style of trading. This can be confusing for newer traders as to which option...
Read more


Submit comment
Your email address will not be published. Required fields are marked *