
Market Momentum in Forex Trading
If you’ve ever seen the forex market move strongly in one direction, you’ve already witnessed momentum in action. Occasionally, a currency pair moves slowly and softly. At other points, it moves faster. Traders frequently try to understand this movement because it can help predict where the market will go next.
Even beginners can use it to enhance timing, avoid poor setups, and understand why prices fluctuate. This article will explain how momentum works in forex trading, how traders identify it, which indicators quantify it, and how to create simple strategies based on it without overcomplicating.
What Is Market Momentum?
Many beginner traders wonder, “What is market momentum?” To put it simply, market momentum refers to the speed and strength with which prices move in a financial market.
Typically, when buyers have strong control over the market, prices will rise with strong momentum; conversely, when the market is dominated by sellers, prices will typically fall rapidly. In forex, momentum enables traders to determine if a trend is strong, weak, slowing, or possibly reversing. Strong momentum usually appears during:
- Major economic news
- Central bank decisions
- High trading volume sessions
- Breakouts from important levels
Weak momentum frequently develops during quiet sessions or before an important announcement. The general concept of Market Momentum is that strong trends can often continue for longer than traders expected. Therefore, many traders will prefer to trade with the momentum rather than attempting to go against the trend.

How Does Market Momentum Work?
Momentum works because a trader’s psychology has a significant impact on financial markets. When traders see prices moving sharply upward, more buyers frequently enter the market. This creates further buying pressure, potentially driving prices even higher.
The same thing happens during large bearish movements. For example, suppose the EUR/USD pair breaks through a key resistance level following positive European economic data. Traders identify the breakout and start buying aggressively.
More buyers will attract more buyers. The chain reaction generates momentum. In forex markets, momentum is often strongest during trading sessions and periods of high volatility, and many traders use platforms such as Otet Markets to monitor these rapid price movements more effectively:
| Market Session | Momentum Level |
| London Session | High |
| New York Session | High |
| Asian Session | Medium |
| Holiday Trading | Low |
In addition, price momentum often changes in accordance with volatility: during major news releases such as non-farm payroll numbers or inflation data, price momentum may become highly volatile within minutes. After the US Federal Reserve interest rate decision in March 2026, gold experienced strong bullish momentum following the announcement. Because of this, many traders use an economic calendar before executing trades to ensure they are well-positioned to take advantage of any upcoming data releases.
Some traders will also use the MetaTrader platform to improve their ability to track momentum and/or speed of prices during extremely volatile trading sessions.
Types of Market Momentum
Market momentum is not always consistent. Different types of momentum emerge under various market conditions.
Bullish Momentum
When there is bullish momentum in the market, buyers are in control, and prices keep increasing substantially.
Common signs include:
- Higher highs
- Strong bullish candles
- Rising trading volume
- Fast breakouts
Bullish momentum is often seen following favourable economic reports or interest rate expectations.
Bearish Momentum
Bearish momentum happens when sellers take control of the market, and prices fall sharply.
This often happens during:
- Economic uncertainty
- Risk-off market sentiment
- Weak economic data
- Geopolitical tension
Strong bearish momentum can result in sharp price decreases over short periods.
Short-Term Momentum
Short-term momentum focuses on the fast price movement within smaller timeframes, such as 5-minute or 15-minute charts.
Scalpers and day traders typically use this type of price movement.
Long-Term Momentum
Long-term momentum is established over a longer range of time, typically weeks or months. Swing and positional traders usually use higher time frames, such as weekly or monthly charts.
How to Identify Market Momentum
For many beginner traders, one of the most challenging things to accomplish is understanding how to identify strong momentum at the very beginning.
There are a number of different ways that traders use to identify it.
Price Action
The first way is just observing candles. Strong momentum usually creates:
- Large candles
- Small pullbacks
- Consistent directional movement
Weak momentum frequently results in choppy candles and hesitation.
Breakouts
Most of the time, momentum starts to occur after price breaks important support or resistance levels.
For example, if GBP/USD remains below resistance for several days and suddenly breaks above it with strong candles, then there could be momentum entering the market.
Volume
Even though forex is considered to be a decentralized financial market, many brokers offer traders tick volume. This helps traders in managing their exposure and estimating how much activity there is in a market.
There is generally a positive correlation between high volume and strong momentum.
Trend Direction
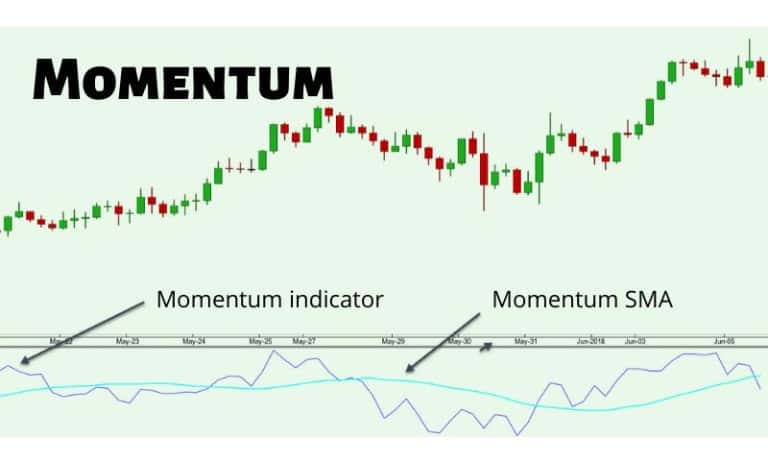
Traders commonly use the moving average indicator as both a means of identifying trend direction and measuring the overall strength of the market.
If a price remains above a rising moving average, this indicates that bullish momentum still exists.
If a price remains below a falling moving average, this indicates that bearish momentum continues.
Best Indicators for Measuring Market Momentum
Momentum indicators help to quantify and assess price strength rather than relying solely on emotion or guesswork. Below are some of the most popular tools.
| Indicator | Main Purpose | Best For |
| RSI | Measures overbought/oversold conditions | Trend strength |
| MACD | Tracks trend momentum | Trend continuation |
| Stochastic Oscillator | Identifies momentum shifts | Reversals |
| ADX | Measures trend strength | Strong trends |
| Momentum Indicator | Measures price acceleration | Entry timing |
-
RSI (Relative Strength Index)
The RSI is among the most well-known momentum indicators.
An RSI value above 70 shows overbought conditions, and an RSI value below 30 shows oversold conditions.
However, beginner traders should remember that strong trends can remain overbought or oversold for long periods of time.
-
MACD
The MACD is a good tool for identifying both trend direction and momentum.
When the MACD lines cross upward, bullish momentum may rise. When they cross downward, the bearish momentum may increase.
-
ADX
The ADX measures specifically the strength of a trend. Readings exceeding 25 often indicate strong momentum.
Lower values frequently indicate weak or range markets.
Market Momentum Chart Example
The chart below provides a clear view of how a bullish trend tends to develop in terms of momentum.
Price
1.1200 | █
1.1180 | ███
1.1160 | █████
1.1140 | ███████
1.1120 | █████████
1.1100 | ███████████
1.1080 | █████████████
1.1060 | ███████████████
1.1040 | █████████████████
Time →
As shown above, there is a continual increase in price acceleration. The pullbacks are small, and the buying pressure is strong.
Momentum traders will typically join the market during this type of price action.
Momentum Trading Strategies
Momentum trading does not have to be complicated.
Many professional traders simply follow strong trends and avoid opposing market direction.
-
Breakout Strategy
This is one of the most popular momentum strategies.
The trader is looking for a price to break an important level with strong momentum confirmation.
For example:
- Price consolidates near resistance
- A strong bullish candle appears
- Volume increases
- The trader enters after the breakout
Stop losses are usually placed below the breakout area.
-
Moving Average Momentum Strategy
This strategy combines trend direction and momentum confirmation.
For example:
- Price above 50 EMA
- RSI above 50
- A strong bullish candle forms
This configuration may imply the continuation of momentum.
Many traders incorporate this approach into their daily forex gold trading strategy since gold frequently acquires strong momentum following economic news.
-
News Momentum Trading
Important economic releases can generate rapid momentum.
Examples include:
- Interest rate decisions
- Inflation reports
- Employment data
However, beginner traders should exercise caution because volatility might spike during such events.
-
Pullback Momentum Strategy
Instead of pursuing quick market movements, some traders wait for temporary pullbacks before placing an order.
This can result in improved risk-reward chances.
- Strong uptrend forms
- Price retraces slightly
- Momentum indicators remain bullish
- Trader enters a continuation trade
Many experienced traders choose this method since it reduces emotional decision-making.
Some brokers, such as Otet markets, provide demo environments in which beginners can safely practise momentum strategies before investing real money.
Regardless of the strategy used, traders should always manage position size carefully during high-volatility momentum conditions.
Advantages of Momentum Trading
Momentum trading is popular because it provides multiple practical advantages.
- Clear Market Direction
Momentum can help traders avoid making random trades.
Rather than guessing, traders track substantial market movement.
- Better Timing
Momentum indicators can help enhance entry timing and minimise hesitancy.
- Works Across Markets
Momentum strategies function in:
- Forex
- Stocks
- Commodities
- Crypto
- Indices
- Suitable for Multiple Styles
Scalpers, day traders, and swing traders are able to employ momentum concepts differently.
- Helps Avoid Weak Markets
One key advantage is avoiding slow and choppy situations, which cause many traders to lose money unnecessarily.
Risks and Limitations of Market Momentum
Momentum trading can be effective, but it is not flawless.
Beginners should carefully consider the risks.
- False Breakouts
Sometimes the price appears to be on track to continue strongly before unexpectedly reversing.
This is particularly common during low-volume periods.
- Emotional Trading
Fast-moving markets might lead to emotional decisions.
Many traders enter too late, fearing they will miss out.
- News Volatility
Momentum following an important news release can be unexpected.
Slippage and spread widening may have an impact on trade execution.
- Trend Exhaustion
Strong trends eventually slow down.
If traders enter late, reversals might occur rapidly.
- Overdependence on Indicators
Indicators can help, but they should not replace market knowledge.
Successful traders usually combine:
- Price action
- Trend analysis
- Risk management
- Momentum confirmation
Conclusion
Momentum is a key concept in forex trading since it helps traders determine the strength behind price movement. Instead of entering trades blindly, momentum analysis enables traders to capitalize on active market activity while avoiding weak conditions.
The good news is that you don’t need dozens of indicators or complex algorithms to grasp momentum in trading. Even simple observations like strong candles, breakout behaviour, and trend direction can assist in determining momentum successfully.
Like any other trading approach, it also involves patience, discipline, and effective risk management.
In real trading conditions, momentum can shift very quickly, especially during overlapping trading sessions like London and New York.
Many beginner traders make the mistake of assuming strong momentum will continue forever, but markets naturally alternate between expansion and consolidation phases. This is why experienced traders often wait for confirmation before entering a trade rather than chasing aggressive price movement emotionally.
The goal is not to catch every movement. The idea is to discover high-quality opportunities where the market has already demonstrated significant directional intent.
Watching how price reacts near support and resistance levels can provide additional clues about whether momentum is strengthening or weakening. Over time, traders who learn to read momentum calmly usually develop better discipline and more consistent decision-making habits.
FAQ
Market momentum refers to the speed and strength of price movement in a financial market. It helps traders understand whether buyers or sellers currently control the market direction.
Momentum works through trader behavior and market psychology. When prices move strongly, more traders often join the trend, creating additional buying or selling pressure.
Many traders monitor momentum directly through the MetaTrader platform using indicators like RSI and MACD.
Market momentum is caused by economic news, interest rate decisions, market sentiment, breakouts, and high trading activity, and it often strengthens during major market events affecting currencies and commodities.
Share
Hot topics
What Is a Breakout Trading Strategy and How to Trade It?
If you have ever observed a price move quietly for some time and then suddenly move in a particular direction, you have already seen a breakout in action. Breakouts can...
Read more


Submit comment
Your email address will not be published. Required fields are marked *