
What Is a Breakout Trading Strategy and How to Trade It?
If you have ever observed a price move quietly for some time and then suddenly move in a particular direction, you have already seen a breakout in action. Breakouts can fascinate traders because those moments mark the beginning of strong price movements. However, not all breakouts are good, and learning how to distinguish between them is an important skill.
Understanding the Breakout Trading Strategy can help traders make informed decisions rather than merely reacting to sudden price movements. Experienced traders look for confirmation, market conditions, and risk management before opening a position.
In this article, we will talk about what breakouts are, why they happen, how to recognize valid opportunities, and how to manage trades with confidence. Whether you’re just getting started or looking to improve your existing approach, the concepts below are practical and easy to understand.
What Is a Breakout?
A breakout occurs when the price of an asset moves beyond an important support or resistance level with enough momentum to suggest that a new trend may be beginning. These levels often act like barriers, holding prices inside a range until buying or selling pressure becomes strong enough to push through.
Price does not move in a straight line all the time. Sometimes, price movement can happen within a defined range where buyers and sellers are balanced. When one of the parties becomes stronger, a breakout occurs above resistance or below support, indicating a shift in market momentum. This movement can show the beginning of a new trend or the continuation of an existing one.
This is the reason many market participants pay close attention to Breakout Trading. It can give traders an opportunity to join a new trend shortly after it begins. However, not every breakout leads to a new trend. Some quickly reverse, creating what traders call a false breakout.
Why Breakouts Happen
A breakout occurs when buyers and sellers compete for control around an important price level, and one side eventually gains enough momentum to push the price beyond support or resistance. As prices approach a well-known support or resistance level, the number of observers increases.
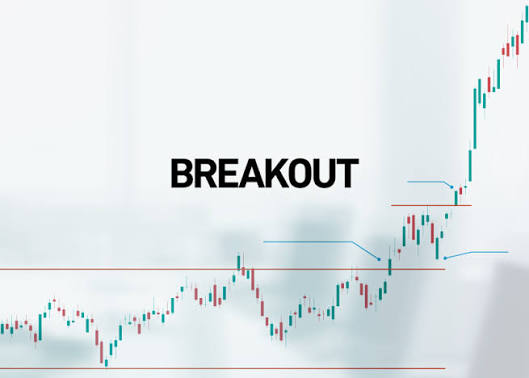
At the same time, one side gains enough strength to overcome the other. This leads to increased market activity and often results in a strong price movement beyond the previous trading range. Several factors can trigger breakouts, including:
- Major economic news releases
- Strong earnings reports
- High trading volume
- Changes in market sentiment
- Institutional buying or selling
Understanding Supply and Demand Zones in Trading is also of extreme importance since they can help provide information about the reasons behind price pauses, reversals, or accelerations after reaching certain important price levels.
Types of Breakouts
Not all breakouts behave the same way, so understanding the differences can help traders make better trading decisions. Market behavior changes depending on the trend, volatility, and the balance between buyers and sellers. Some types of breakouts are associated with the emergence of a completely new trend, while other breakouts imply that the ongoing trend will be continued.
Being able to distinguish between these breakouts helps traders find setups that are compatible with their trading style and risk tolerance. For instance, a breakout above a long-term resistance level may attract other traders to buy the asset since this price level is widely monitored by many traders.
At the same time, if the breakout is caused by a short-term consolidation pattern, the resulting price movement may require faster trade management. Analyzing the overall market conditions, trading volume, and price action can help traders assess the likelihood of a successful breakout.
The table below presents a comparison between the main types of breakouts. It also elaborates on the circumstances they are typically observed in.
| Breakout Type | Description | Typical Market Condition | Risk Level |
| Resistance Breakout | Price moves above resistance, suggesting buyers have gained control and an upward trend may begin. | Bullish | Medium |
| Support Breakout | Price falls below support, indicating stronger selling pressure and the possibility of a downward trend. | Bearish | Medium |
| Trendline Breakout | Price breaks through a well-established trendline, often signaling a trend reversal or continuation. | Trending Market | Medium – High |
| Chart Pattern Breakout | Price exits a recognizable pattern such as a triangle, flag, or rectangle after a period of consolidation. | Consolidation | Medium |
| Volume Breakout | Breakout supported by significantly higher-than-average volume, showing stronger participation | High Momentum | Medium (when confirmed) |
Each type of breakout offers different opportunities and challenges. Resistance and support breakouts are usually easier for beginner traders to identify because these key price levels are often clearly visible on the chart. Trendline and the chart pattern breakouts, however, require more experience as traders need to accurately recognize the relevant pattern prior to making any trading decisions.
Volume-supported breakouts are often considered stronger because increased participation can indicate greater market interest. However, volume alone does not guarantee that a breakout will succeed. Regardless of the type, no breakout guarantees a successful trade. Confirming the move through price action, trading volume, and overall market conditions can significantly reduce the chances of entering a false breakout.
While understanding the different types of breakouts is important, it is equally important to know whether a breakout is genuine or likely to fail. Traders often compare the characteristics of valid and false breakouts before entering a position. The comparison below highlights some of the most common differences. Comparison Table:
| Feature | Valid Breakout | False Breakout |
| Trading Volume | High | Low or Average |
| Candle Close | Closes clearly beyond the key level | Closes near or back inside the level |
| Follow-Through | Price continues in the breakout direction | Price quickly reverses |
| Market Momentum | Strong | Weak |
| Trader Confidence | Higher | Lower |
How to Identify Valid Breakouts
One of the biggest challenges is to differentiate between the right opportunities and a mere short-term price fluctuation. A successful trader is one who takes the time to confirm the moves rather than rushing right away.
The first step is to analyze each candlestick closely in relation to support and resistance levels. If price briefly moves above resistance and then quickly falls back below it, the breakout may lack strength. Traders may also use What Is Order Block concepts to identify areas where institutional buying or selling activity may have influenced price movements.
Volume can also help confirm the strength of a breakout. Higher-than-average volume often indicates stronger market participation and can increase confidence in the move.
Many traders expect a retest after a breakout. The price usually comes back to the broken line before it goes up again. While this process may take time and effort, it helps avoid unnecessary losses.
Technical indicators may be used for additional confirmation, but they shouldn’t be substituted for the analysis.
If you use the MetaTrader platform for your analysis, you may benefit from different drawing techniques, which help to have all the information in one place.
Entry and Exit Strategies
Entering too quickly is among the most typical mistakes made in breakout trading. Many novices become overexcited when they see the price coming close to resistance only to watch the market quickly change direction.
Traders typically choose between two approaches: entering immediately after a confirmed breakout or waiting for a retest of the broken support or resistance level before opening a position. The choice depends on their risk tolerance and trading style.
Exit planning is equally vital as entry planning. Before opening any trade, ensure you know where you want to take profits and at what level you would be willing to incur losses. Many experienced traders use a fixed risk-to-profit ratio that can be 1:2 and higher. This means that the possible profit is at least double the maximum possible loss.
If you are using a MetaTrader5 account, you may establish stop-loss and take-profit levels while placing a trade, thereby preventing yourself from making emotional decisions going forward.
Risk Management for Breakout Trading
Even a very promising breakout can fail. For this reason, it is important to protect your trading capital before you search for profits. Professional traders rarely risk a large percentage of their capital on a single trade. Small losses are normal when trading, but huge losses are more difficult to recover. Consider these practical guidelines:
- Risk only a small percentage of your account on each trade.
- Always use a stop-loss order.
- Avoid increasing position size after a losing trade.
- Wait for confirmation instead of guessing.
- Keep a trading journal to review both winning and losing trades.
When you think of trading, think of a car. While a seatbelt won’t help you avoid an accident, it will help you limit the consequences of an unforeseen event. That’s what risk management means in trading.
Regardless of the broker or trading platform you use, consistent risk management remains essential for protecting your capital. At Otet, traders can apply these principles by using proper position sizing, setting stop-loss levels, and maintaining disciplined trade management practices.

Common Breakout Trading Mistakes
All traders have losing trades, especially when learning. The key is to learn to recognize and minimize these mistakes over time.
One common mistake is entering the market before the breakout has been confirmed. By reacting too quickly, a trader may end up buying near the peak or selling near the bottom of a temporary move.
Another common mistake is ignoring market conditions. The presence of a breakout with low volume may not allow it to continue or have enough momentum. Overtrading is another frequent problem. The fact that there are many setups on different charts does not mean that there should be a trade based on each of them.
Emotions can be another problem. Fear makes traders close profitable positions too early, and greed makes them prolong losing positions unnecessarily. Developing discipline takes time, but it is often the key difference between consistently successful traders and those who struggle over the long term.
Conclusion
Learning how breakouts work is about much more than recognizing a line on a chart. Successful traders combine technical analysis, patience, confirmation, and careful risk management before making decisions.
While no strategy guarantees success, understanding Forex Breakout concepts can help traders recognize situations where market momentum may create meaningful opportunities.
Like any trading method, experience comes through practice. Reviewing charts, keeping records of completed trades, and following a consistent trading plan will gradually improve your decision-making. Over time, these habits become far more valuable than trying to predict every market movement perfectly.
FAQ
A false breakout occurs when the price briefly moves beyond a support or resistance level but quickly returns to its previous range. These situations often trap traders who enter too early without waiting for confirmation. To better understand how price behavior can help identify false breakouts, read our article on Trading with Price Action.
Popular indicators include trading volume, RSI, MACD, moving averages, and Bollinger Bands. While these tools can provide additional confirmation, they work best when combined with price action and a clear understanding of support and resistance levels.
Yes. Breakout trading is relatively easy to understand because it focuses on clear price levels. Beginners should start with a demo account, practice identifying valid breakouts, and always use proper risk management before trading with real money.
There is no single best timeframe. Short-term traders often use 5-minute or 15-minute charts, although these timeframes can produce more false signals. Swing traders usually prefer 4-hour or daily charts because they tend to provide clearer market structure.
Share
Hot topics

STP, NDD, ECN and DMA: Broker Execution Models Decoded
When picking a forex broker, we don’t just look at the brokerage that has the lowest spreads, bonuses, and other kind of what is apparent for us. There is one...
Read more




Submit comment
Your email address will not be published. Required fields are marked *