
Week 18, 2026: Markets Face a Global Policy Stress Test
The week ahead is a major policy and inflation test for global markets. The focus will be the FOMC meeting on April 28–29, followed by U.S. Q1 GDP, March PCE inflation, personal spending, and Employment Cost Index on Thursday. These data will shape expectations for the dollar, Treasury yields, Wall Street, gold, and crypto. Europe also faces key policy risks, with the ECB and Bank of England meetings, while markets watch eurozone inflation signals. In Asia, the Bank of Japan decision and China’s PMI data will be important for yen, Asian equities, and global growth sentiment. Energy remains a major macro risk. High oil prices linked to Middle East tensions could keep inflation pressure alive and limit central-bank flexibility.
U.S. Economy Weekly Review
Resilient U.S. Growth Faces a Fresh Inflation Test
The U.S. economy finished the week with a stronger growth signal than markets expected, but the details showed a more complicated picture. Consumer demand remained the main support for the economy, while business activity improved and housing responded positively to slightly lower mortgage rates. At the same time, labor data showed gradual cooling, inflation expectations stayed high, and energy-market risks returned as a major concern.
Retail sales were the clearest sign of strength. Headline sales rose 1.7% month-on-month in March, beating the 1.4% forecast and improving from 0.7% previously. Core retail sales climbed 1.9%, while the GDP-linked control group increased by 0.7%, well above expectations for 0.2%. These figures suggest U.S. households entered the second quarter with solid spending power, even though Redbook sales growth slowed to 6.7% from 7.0%.
The labor market remained stable but softer. Initial jobless claims rose to 214K, continuing claims increased to 1.821M, and the four-week average moved up to 210.75K. This points to gradual loosening, not a sharp downturn.
Business surveys were encouraging. The preliminary April Manufacturing PMI rose to 54.0, Services PMI improved to 51.3, and Composite PMI reached 52.0, showing better momentum across both factories and services. Housing also improved as the MBA 30-year mortgage rate fell to 6.35%, helping mortgage applications jump 7.9%.
The main problem remains inflation. University of Michigan 1-year inflation expectations stayed high at 4.7%, while 5-year expectations rose to 3.5%. Energy data added to the risk: crude inventories rose 1.925M barrels, but gasoline stocks fell 4.570M and distillates dropped 3.427M, showing tightness in refined products.
Overall, the U.S. economy still looks resilient, supported by strong consumers, improving business activity, and stable employment. But elevated inflation expectations, energy stress, and firm long-end yields reduce the case for near-term Fed easing. The dollar and yields may stay supported, while equities remain dependent on earnings strength and AI momentum.
U.S. Macro Week: Fed, GDP, PCE and Big Tech Earnings Set the Tone
Next week could be one of the most important U.S. market weeks of the quarter, with the FOMC meeting, Q1 GDP, March PCE inflation, consumer data, manufacturing surveys, and mega-cap tech earnings all arriving together. The setup is sensitive because the S&P 500 and Nasdaq have already rallied strongly since late March, leaving markets with less room for disappointment. Investors will be asking one main question: is the U.S. still in a soft-landing environment, or is the economy moving toward a stagflation-style mix of slower growth and sticky inflation?
The week begins with consumer confidence on Tuesday, April 28, followed by the start of the FOMC meeting. After the University of Michigan sentiment index fell to 49.8, while 1-year inflation expectations rose to 4.7% and 5-year expectations climbed to 3.5%, markets will watch whether households are becoming more cautious. Strong confidence could support equities but keep Treasury yields firm, while weaker confidence may help bonds and pressure consumer stocks.
Wednesday, April 29, brings durable goods orders and the main Fed decision. The Fed is expected to keep rates unchanged, but the tone matters more than the decision itself. A hawkish hold could lift the dollar and 2-year Treasury yield while pressuring gold and growth stocks. A dovish hold could support equities, gold, and duration-sensitive sectors. Chair Powell is likely to stress patience, policy flexibility, and uncertainty linked to energy prices and the Iran conflict. The forecast still points to two 25 bps rate cuts this year, likely in September and December.
Thursday, April 30, is the biggest macro shock day. Markets will receive Q1 GDP, March PCE inflation, personal income and spending, and the Q1 Employment Cost Index. A moderate GDP reading, softer PCE, and contained wage growth would support the soft-landing narrative. But weak GDP combined with hot PCE and strong ECI would raise stagflation fears. March PCE is especially important because higher energy costs may lift the deflator by 0.7%, while real consumption is expected to rise only 0.3%.
Friday’s ISM Manufacturing PMI will also matter, especially prices paid. In March, ISM rose to 52.7, while prices jumped to 78.3, the highest since June 2022. Meanwhile, earnings from Microsoft, Alphabet, Amazon, Meta, and Apple could decide whether the Nasdaq rally continues or faces profit-taking.
USD and Wall Street Outlook: A Validation Week for the Risk Rally
The week ahead is a major test for both the U.S. dollar and Wall Street, with four powerful catalysts arriving together: the FOMC meeting, Q1 GDP, March PCE inflation, and mega-cap tech earnings. The S&P 500 closed near 7,165, while the Nasdaq-100 ended around 24,836, showing that U.S. equities enter the week with strong momentum. Meanwhile, the Dollar Index closed lower at 98.50, suggesting the greenback has not fully confirmed the equity rally through stronger yields or hawkish Fed channel.
Wall Street has rallied sharply since late March, with the S&P 500 up around 13% and the Nasdaq gaining more than 19%. That makes the market vulnerable to disappointment, especially as Microsoft, Alphabet, Amazon, Meta, and Apple are all expected to report during the same week as the Fed decision and key inflation data. For equities, the best setup would be a balanced Fed, softer PCE inflation, positive GDP growth, and strong Big Tech earnings. That combination would keep the soft-landing narrative alive and support the Nasdaq, S&P 500, semiconductors, AI infrastructure names, communication services, and consumer discretionary stocks.
The dollar outlook is more mixed. The greenback may stay range-bound to slightly bullish unless PCE softens. A hawkish Fed hold, firm PCE, strong Employment Cost Index, and resilient GDP would likely push front-end Treasury yields higher and support the dollar. The 2-year Treasury yield is the key transmission channel. If it rises after the Fed and inflation data, USD strength can extend. But a balanced or dovish Fed, softer PCE, weaker GDP, and cooling wage costs would revive rate-cut expectations and pressure the dollar.
Technically, the Dollar Index is stabilizing rather than breaking down. Price is nearly 98.329, with support around 97.50. A move above 98.30–98.40 could open the way toward 99.40, then 100.50. A break below 97.50 would be 96.70 and 96.10.
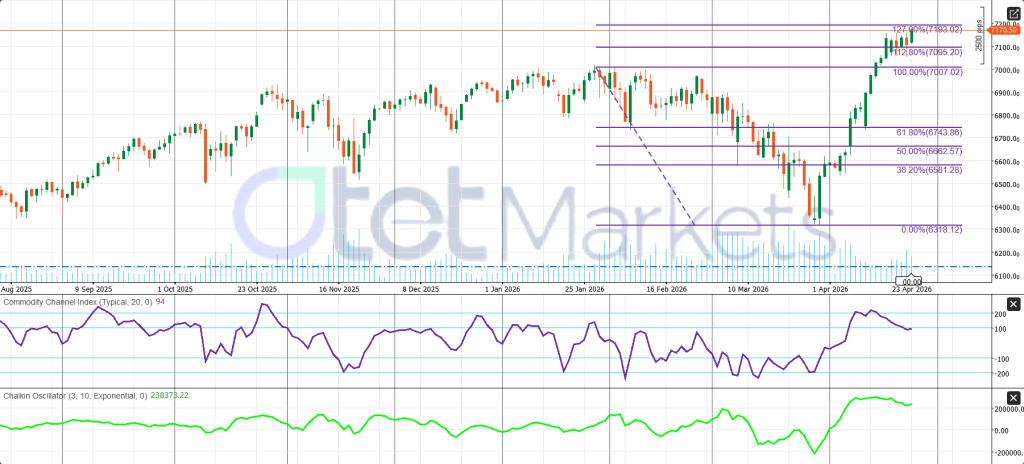
For the S&P 500, the chart remains bullish but event-risk heavy. Price is near 7,170.50, with the next key breakout level at 7,193.02. A close above that level could target 7,351.47, while support sits near 7,095.20 and 7,007.02. The trend remains constructive, but after a strong rally, confirmation matters more than chasing late upside.
Central Banks in the week ahead
During the week of 27 April – 2 May 2026, six major central banks will meet against a backdrop of surging energy prices and heightened geopolitical risk. Each meeting could influence global bond yields, currencies, and risk assets. We have already mentioned the Fed outlook and expectations; here, we will review shortly other major central banks that will hold meetings in the week ahead.
- Bank of Japan (BOJ – 27–28 April) – The BOJ is widely expected to leave its new 0.75 % policy rate unchanged. Inflation remains near the 2 % target, but the Middle‑East conflict has pushed oil prices higher, creating a close call. Officials are likely to deliver a “hawkish pause,” cutting growth forecasts yet raising inflation projections and hinting at a June rate hike. Markets have largely priced out an April hike; a dovish tone could weaken the yen and lift Japanese equities, while any hawkish surprise would bolster the yen and pressure bond yields.
- Bank of Canada (BoC – 29 April) – Economists overwhelmingly expect the BoC to keep its overnight rate at 2.25 %. Canada’s inflation is near target, and the economy is soft, but as a net oil exporter the country benefits from higher crude prices. A balanced, data‑dependent statement could leave the Canadian dollar stable. Hints of a future hike would push domestic bond yields up and support the Loonie, whereas a more dovish tone could bring the currency under pressure.
- Banco Central do Brazil (BCB – 28–29 April) – Brazil’s Copom began a cautious easing cycle in March, cutting the Selic to 14.75 %. Analysts expect another 25‑bp cut, though policymakers are concerned about inflation risks from the energy shock. Confirmation of a measured cut could support local equities and bonds but may weaken the real slightness; a surprise pause would boost the currency and hurt stocks.
- Bank of England (BoE – 30 April) – After markets briefly priced in hikes, a Reuters poll shows all economists expect the BoE to keep Bank Rate at 3.75 %. Inflation is set to climb toward 3–4 % and the economy faces stagflation risks. Policymakers will likely tone down earlier guidance for cuts and stress uncertainty. A cautious stance could keep gilt yields elevated and lend some support to sterling; any hint of a future cut would soften the currency.
- European Central Bank (ECB – 30 April) – On 19 March the ECB kept its deposit rate at 2.0 % and promised a meeting‑by‑meeting approach. Inflation is projected at 2.6 % in 2026. A Reuters poll shows virtually all economists expect no change next week, with many anticipating a quarter‑point hike in June. If the Governing Council signals that hikes remain likely, euro‑zone bond yields should rise and the euro could strengthen; a dovish tone would have the opposite effect. Market volatility may increase as investors parse comments from key policymakers such as Christine Lagarde and Isabel Schnabel.
Overall, markets are bracing for a week of policy caution. Most central banks are expected to hold rates steady and emphasize data dependence. The tone of their communications—particularly hints about future hikes or cuts—will drive short‑term moves in currencies and bond yields. A hawkish tilt from the ECB or BoJ could strengthen the euro and yen, while dovish surprises from the Fed or BoE would likely bolster risk assets and weaken their respective currencies.
Gold Outlook: Safe-Haven Support Meets Fed and Yield Pressure
Gold enters the new week with a neutral-to-bullish fundamental bias, but the short-term path looks volatile. Bullion posted its first weekly loss in five weeks, as higher oil prices, a firmer U.S. dollar, and higher-for-longer rate concerns offset part of the safe-haven demand. The main tension is clear: geopolitics supports gold, but inflation-driven Fed caution can pressure it through higher yields and a stronger dollar.
The biggest event for gold next week is the FOMC meeting on April 28–29. Gold is highly sensitive to real yields, so if the Fed sounds hawkish because of sticky inflation or energy-price risks, Treasury yields and the dollar could rise, creating short-term pressure on bullion. However, if the Fed focuses more on weaker growth risks and avoids a hawkish tone, gold could recover quickly.
Thursday is another major test. Markets will receive Q1 GDP, March PCE inflation, personal income and spending, and the Q1 Employment Cost Index at 8:30 a.m. ET. For gold, the best setup would be softer PCE and weaker wage growth, because that would reduce real-yield pressure. Hot PCE and strong ECI would be bearish in the short term, as they would support a more cautious Fed. A weak GDP number combined with hot inflation would be more complicated, but it could eventually support gold as a stagflation hedge.
Geopolitical risk remains an important support. The Strait of Hormuz disruption, high oil prices, and uncertainty around the U.S.-Iran conflict continue to keep safe-haven and inflation-hedge demand alive. This explains why gold remains supported even when yields create pressure.
Physical demand also looks resilient. Indian gold premiums reached their highest level in more than 10 weeks, while Chinese premiums improved as buyers returned near $4,700/oz. Investor flows remain positive too, with precious-metals funds attracting $841 million in the week ending April 24, marking a fourth straight week of inflows.
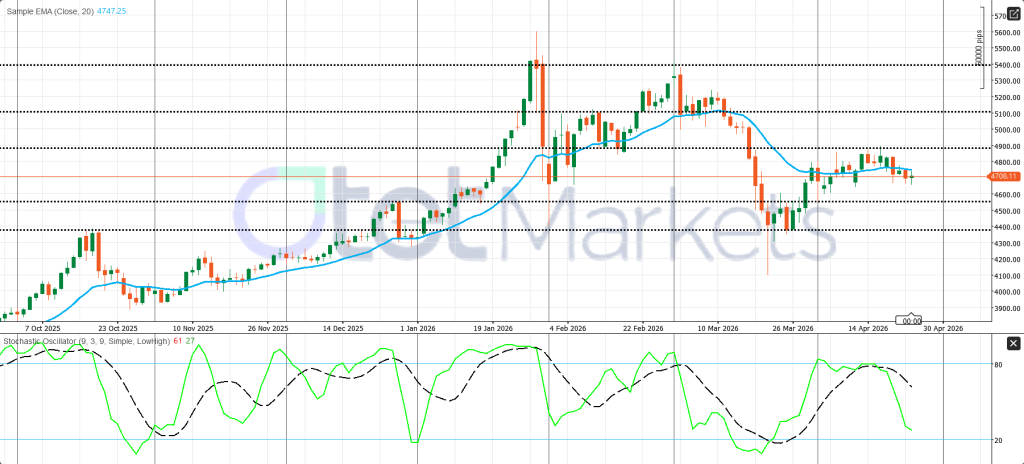
Technically, gold has lost short-term momentum. XAU/USD trades around 4,708.11, below the 20-day EMA at 4,747.25. Support sits at 4,550–4,400, while resistance is near 4,900. A close above 4,900 could reopen 5,100 and 5,400, but failure to reclaim 4,747 keeps the near-term chart mixed to mildly bearish.
WTI Outlook: Supply Risk Keeps Oil Bullish, but Volatility Is High
WTI enters the new week with a bullish but highly headline-sensitive setup. The market is being driven less by normal supply-demand fundamentals and more by the geopolitical risk premium, the Strait of Hormuz disruption, U.S. inventory signals, and the inflation impact of higher energy prices. WTI settled near $94.40/bbl on Friday, down on the day but still up almost 13% for the week, while Brent ended around $105.33/bbl, gaining about 16% weekly.
The main support for oil remains supply risk. The Strait of Hormuz situation is still unresolved, and only five ships reportedly passed through the prior 24 hours before the weekend. Because Hormuz is one of the world’s most important crude and product flow chokepoints, even partial disruption can keep a large risk premium in WTI, Brent, gasoline, and diesel. However, this also makes the rally vulnerable to sharp reversals. Escalation can trigger another spike, while credible ceasefire or shipping-normalization headlines could quickly remove part of the war premium.
U.S. inventory data were mixed but still supportive for the broader energy complex. EIA crude stocks rose by 1.925 million barrels, which is usually bearish for WTI, but gasoline inventories fell by 4.570 million barrels and distillates dropped by 3.427 million barrels. This points to tight refined-product markets. The next EIA petroleum report on April 29 will be important, after API previously reported more than 4,400 Mb in combined weekly stock declines across crude, gasoline, and distillates.
The demand outlook is the main medium-term risk. The IEA sharply cut its 2026 demand view, projecting a decline of 80 kb/d, compared with expected growth of 730 kb/d before. It also estimated demand contraction of 800 kb/d year-on-year in March and 2.3 mb/d in April. OPEC remains more optimistic, forecasting 1.4 mb/d demand growth in 2026.
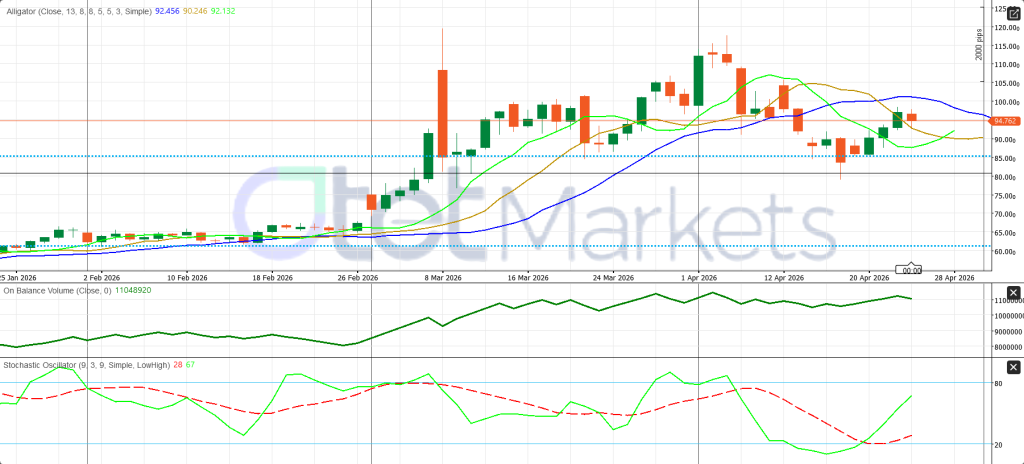
Technically, WTI has improved. Price trades near 94.762, above the Alligator jaw at 92.456, teeth at 90.246, and lips at 92.132. A break above 95.00 could open 100.00 and 105.00, while support sits around 92.10–92.50, with a deeper floor near 85.50. Overall, WTI remains buy-on-dips while Persian Gulf supply risk persists, but any improvement in flows could trigger a fast correction.
Crypto Weekly Outlook: Bitcoin Recovery Depends on ETF Flows, Fed Tone and Macro Stability
The crypto market ended the week in better shape than it started, with Bitcoin recovering from its risk-off selloff, major altcoins following, and ETF inflows showing that institutional conviction remains intact. Still, the rally is conditional. Crypto is trading less like an isolated asset class and more like a high-beta macro asset tied to oil, the dollar, Treasury yields, and Fed expectations.
Bitcoin first came under pressure as Middle East risk and the Strait of Hormuz disruption lifted oil prices and revived inflation fears. Instead of acting like “digital gold,” BTC behaved like a volatile growth asset, falling toward the mid-$75,000 area and briefly touching an intraday low near $73,831. But the selloff did not become a structural breakdown. As immediate war fears eased, Bitcoin recovered toward $77,998, a rebound of roughly 5.6% from the low.
Altcoins also improved, but leadership remained selective. Ethereum recovered from around $2,268.85 to $2,385.12, while XRP, Solana, Cardano, and Dogecoin also rebounded from weaker levels. The move was healthy, but it looked more like a relief rebound than the beginning of a broad speculative altcoin surge. Bitcoin still anchored the market, while altcoins followed rather than led.
The strongest bullish factor remains institutional demand. Bitcoin ETFs attracted $663.91 million, pushing total net assets above $100 billion. Ether ETFs added $127.49 million, extending inflows to seven straight days. More broadly, digital-asset investment products saw $1.4 billion inflows in the latest weekly report, with Bitcoin attracting $1.116 billion and Ethereum $328 million. This shows that institutional capital did not exist during geopolitical stress and continues to provide a floor under prices.
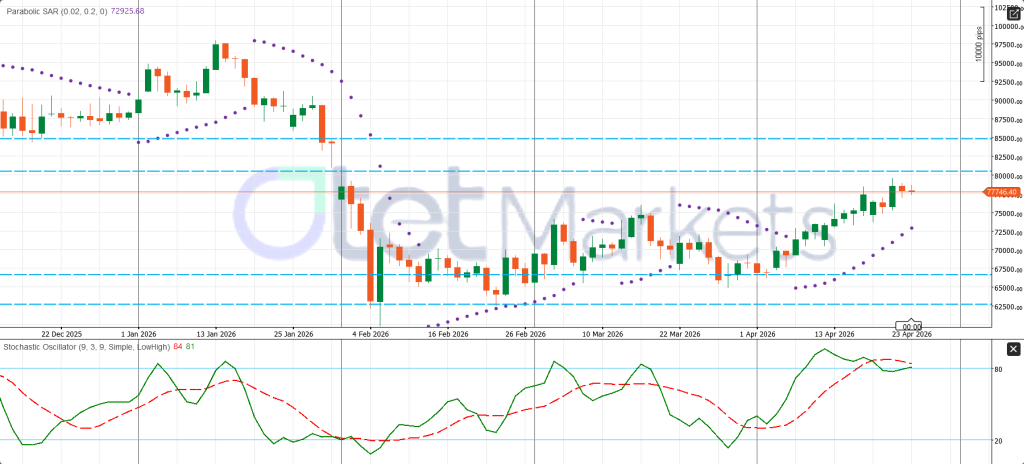
Next week, the main test will come from the Fed meeting on April 28–29, followed by Q1 GDP, March PCE inflation, and the Employment Cost Index on April 30. A non-hawkish Fed contained inflation, lower yields, and strong Nasdaq sentiment could help BTC break above the $80,000 region. A clean closure above $80,700 would open room toward $85,000.
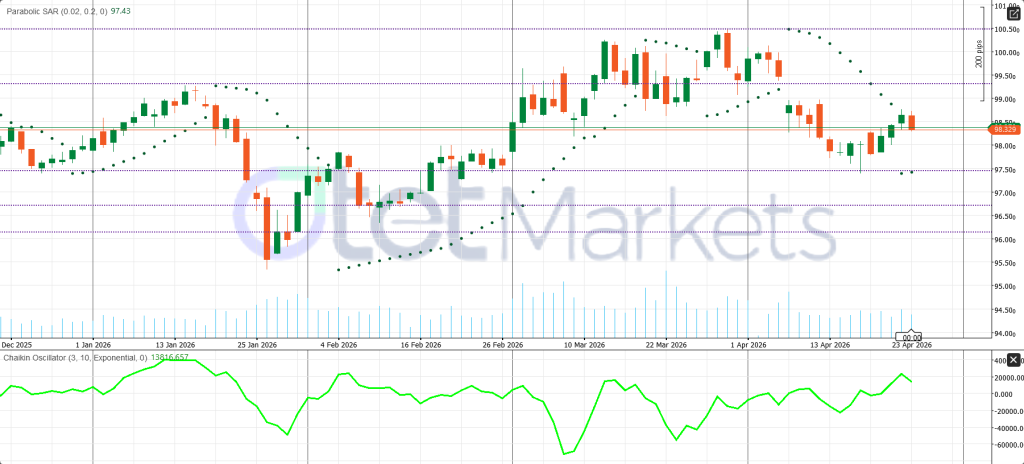
However, a hawkish Fed, hot PCE or ECI, stronger dollar, weaker ETF flows, or a tech-led equity selloff could push BTC back below $75,000. Technically, Bitcoin remains constructive above the Parabolic SAR near $72,925.68, but momentum is stretched, with stochastic near 84/81. The bias is neutral to bullish, but confirmation above $80,000–$80,700 is needed.
Share
Hot topics
What Is a Breakout Trading Strategy and How to Trade It?
If you have ever observed a price move quietly for some time and then suddenly move in a particular direction, you have already seen a breakout in action. Breakouts can...
Read more


Submit comment
Your email address will not be published. Required fields are marked *