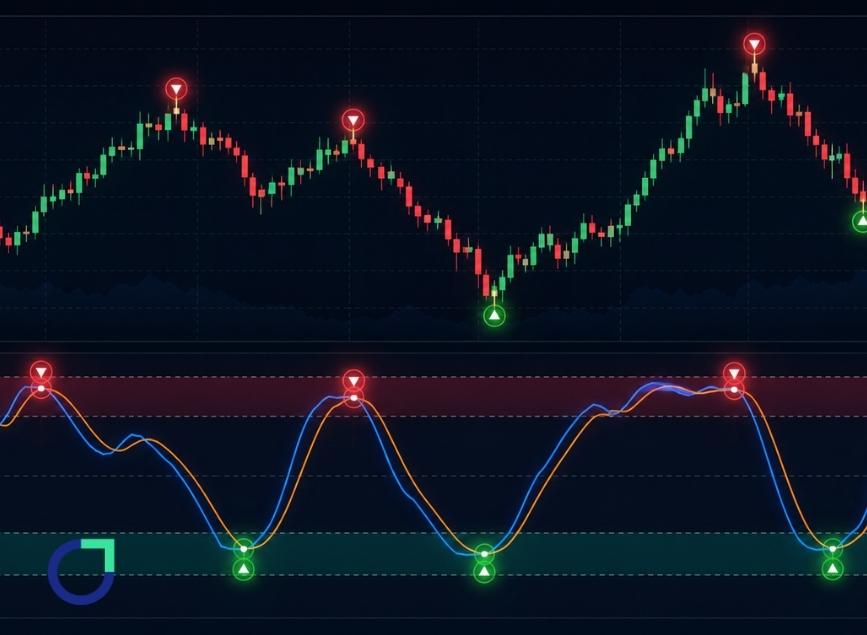
What Is the Stochastic Indicator and How Does It Generate Signals?
Financial markets move through changing momentum patterns that influence how prices rise and fall. In the case of an asset’s upward price movement, trading volume usually decreases before the price drops into the downward lane, even if the price movement appears strong on the analytical graph.
Traders look for technical tools that can identify changes in price momentum before an asset changes direction. This is where the effectiveness of the Stochastic Indicator lies, allowing traders to see these points early.
What Is the Stochastic Indicator?
The Stochastic Indicator is a classic technical analysis tool designed to measure the underlying momentum of asset prices. Developed by a legendary trader named George Lane in the late 1950s, it remains a staple on millions of charting platforms worldwide today.
Lane’s famous observation about this tool is that it tracks the speed or momentum of price, not its price and volume. The fundamental principle of his work is remarkably uncomplicated and deeply rooted in human psychology.
In a strong market uptrend, closing prices are expected to be near the top of their recent trading range, as noted by him. As the session ends, buyers are in control and push the asset to its limits. However, during a continuous downtrend in the market conditions, closing prices usually reach the very bottom of the most recent trading period. Sellers aim to eliminate any residual value from the asset before the session ends.
When the price reaches these extreme limits, the real magic happens. If a rising asset begins to close in the middle or bottom half of its recent daily range, it indicates that fundamental market momentum is running low.
This structural shift occurs long before the actual price line breaks down through a major support level. Because it alerts you to these silent internal changes, it serves as a highly reliable early warning system for market participants. Traders who want to expand their technical analysis skills can also explore The Best Indicators for Trading in Forex.
How Does the Stochastic Oscillator Work?
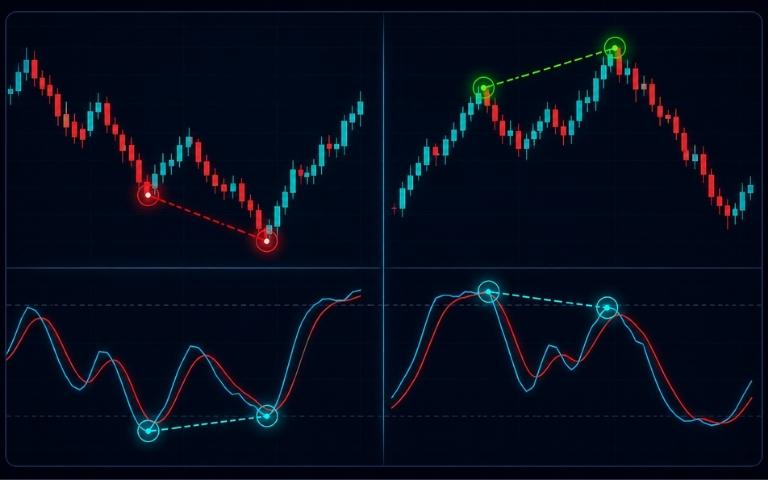
To understand how it functions on your screen, it helps to know that the indicator operates as a range-bound oscillator. This means it always fluctuates between a fixed value of 0 and 100, regardless of how high or low the actual asset price climbs or falls.
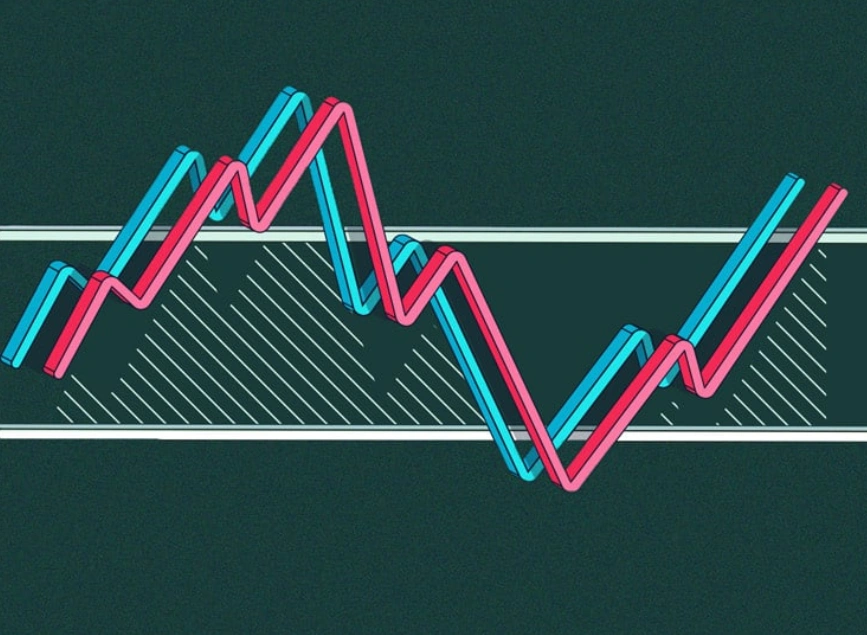
The tool consists of two distinct lines moving together across the bottom pane of your chart: the %K line and the %D line. The %K line is the fast-moving one, calculated by comparing the current closing price to a specific price range over a set period.
The %D line is a slower, smoothed version, acting as a simple moving average of the %K line itself. When you watch these two lines dance across your screen, you are seeing a real-time battle between buyers and sellers.
Fortunately, modern trading software handles all of these heavy mathematical calculations instantly in the background. If you are using modern systems like cTrader platforms, you will find this indicator pre-installed and ready to go right out of the box.
It renders beautifully on modern, high-performance charting layouts, making it incredibly easy to track how the closing prices relate to recent high-low boundaries. You can easily adjust the colors, thicknesses, and inputs to match your unique viewing preferences. Many traders build a Stochastic Trading Strategy by combining momentum signals with trend confirmation and proper risk management.
Types of Stochastic Signals
The stochastic oscillator produces a variety of signals associated with market momentum. While there are signs indicating what may happen in the future, having the knowledge of what each signal indicates can help traders make better-informed choices. The table representing the major signals and their interpretations is given below.
| Signal Type | What It Indicates | How Traders Commonly Use It |
| Bullish Crossover | The %K line crosses above the %D line, suggesting momentum is strengthening. | Look for buying opportunities after confirming the trend. |
| Bearish Crossover | The %K line crosses below the %D line, indicating momentum may be weakening. | Consider selling opportunities or protecting existing long positions. |
| Overbought Signal | The oscillator moves above 80, showing that buying momentum has been strong. | Wait for additional confirmation before expecting a pullback. |
| Oversold Signal | The oscillator falls below 20, suggesting selling pressure may be slowing. | Watch for signs of a possible upward reversal. |
| Bullish Divergence | Price makes lower lows while the oscillator forms higher lows. | May indicate that bearish momentum is fading. |
| Bearish Divergence | Price makes higher highs while the oscillator forms lower highs. | May suggest that bullish momentum is losing strength. |
Each signal has its purpose. Some of the signals provide information about momentum change, while some of them identify the possible reversals. So, instead of reacting to the initial signal, the experienced traders usually combine their observations with the findings of trend analysis, support and resistance points, and candlestick patterns, which allow for better decision-making in trades.
Overbought and Oversold Conditions
The simplest approach to interpret this oscillator is to monitor the moments in which the oscillator reaches the extreme horizontal zone in the chart. In general, the area above the 80 line is called overbought, and the area below the 20 line is called oversold.
If lines move above 80, it means that the asset is moving towards its maximum from the recent range, which indicates a considerable buying volume in the market. However, this doesn’t mean that the trader should sell the asset as soon as having an overbought reading.
True Stochastic Signals appear when the lines climb into the extreme zones and subsequently return into the neutral zone which points out the sellers’ fatigue and the buyers’ reinstatement in control. The emergence of this crossover gives an actionable signal to initiate a trading activity or to manage trailing stop losses in a more efficient way. What is evident is that the change in momentum has taken place.
Experienced traders involved in technical analysis always wait for the candle to be closed before making the decision to trade on the basis of these crossovers. This helps decrease the risk of entering a trade prematurely.
Stochastic Divergence Signals
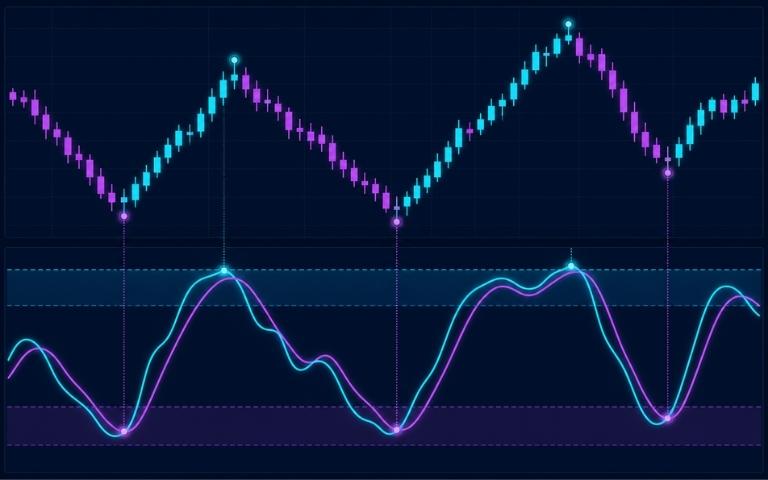
Divergence occurs when price moves along one path while the oscillator takes another. This discrepancy can serve as an indicator that the ongoing trend is beginning to lose its strength.
For example, the prices may keep producing more and more highs while the oscillator starts producing declining peaks. This indicates that buyers are losing their enthusiasm. The opposite might happen in a downward trend. The prices could still generate more lows while the oscillator makes higher lows. This suggests that sellers begin to weaken.
Such divergences usually catch traders’ attention; they often happen before the possible changes in the trend. However, divergences should be treated as a signal only and not be perceived as the final confirmation. Many traders use divergences along with patterns and significant support and resistance levels.
Common Mistakes When Using Stochastic
One common mistake people make about crossovers is associating all of them with trading signals. The fact is that the financial markets operate in a context of a lot of small fluctuations, and not all crossovers are important.
Another common mistake is considering being in the overbought position as selling and being in the oversold position as buying. Strong movements in the market can keep the crossover indicator in either position for a long period without giving a signal.
Besides, beginners often ignore the overall market direction. Trying to buy when the market sharply declines or to sell when the market sharply rises reduces the probability of making profitable trades.
Finally, people also often rely too much on a single indicator and do not evaluate the market context, news events, risk management factors, etc.
Best Practices for Using Stochastic in Forex
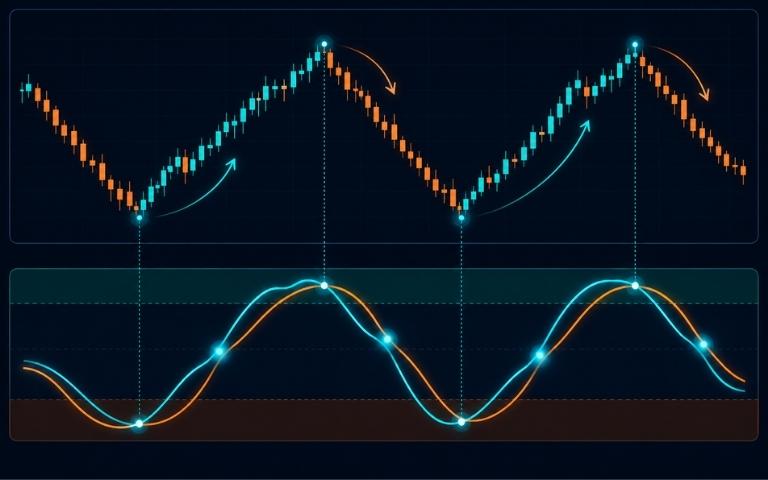
Successful trading decisions in the forex market depend on combining momentum analysis with reliable execution tools. For instance, the structured cTrader Accounts give an opportunity to react promptly to the signals of the indicators. An excellent tip is to align your execution with a dominant trend on a higher time frame. In other words, if the daily chart indicates that the market has a confirmed uptrend, look for buy setups on the hourly chart only when it hits oversold territory.
This approach ensures you are never fighting the major market momentum, but rather buying the temporary pullbacks within that trend. It gives you a much higher statistical probability of success on each individual position you take.
To make your trading process smoother, you can use a demo account to test your trading strategy. Brokers like Otet Markets that provide access to different indicators and assets can help traders test and refine their strategies in various market conditions. Always use your indicator entries along with proper risk management that certainly must include the stop-loss order. Even the strongest divergence signal can fail when unexpected economic news is released.
Keep the trading journal of the trades you have made and all the signals based on the oscillator. The more signals you collect over time, the more experience you gain in identifying the currency pairs that suit your strategy. To gain a deeper understanding of how different momentum tools work, traders can also explore a Comparison of RSI and MACD Indicators to learn how these indicators behave in various market conditions.
Conclusion
The Stochastic Indicator is a well-known and trusted tool that simplifies the complexity of market analysis. It clearly indicates where the price is closing in relation to previous prices. Whether you want to use the indicator for simple oversold rebounds or for sophisticated structural divergence trades, remember that no technical analysis tool is a magic solution, and no trading system can ensure that your trade will always be successful.
Use the oscillator as an instrument that provides assistance and apply good risk management practices. Additionally, make efforts to learn how to read the signals given by the oscillator properly.
FAQ
The traditional, default setting used by most platforms is (14, 3, 3), representing the look-back periods, the slowing factor, and the moving average smoothing. This balanced setting works excellently for standard daily and four-hour charts, but short-term day traders sometimes lower the periods to speed up the response time. You may also read The Best Indicators for Trading in Forex
Yes, it is highly visual and relatively easy to understand, making it an ideal choice for newer traders entering the technical analysis world. The biggest trick is learning not to trade every single crossover blindly and instead using it alongside basic price action concepts.
It cannot predict the future with absolute certainty, but it does an excellent job of showing when a trend is losing its internal power. By highlighting structural divergences, it offers a highly reliable early warning system before a major reversal actually unfolds on the price chart.
While both are momentum oscillators, the RSI tracks the speed of price changes based entirely on internal gains and losses over time. Stochastic focuses its calculations on where the current price closed relative to its absolute highest high and lowest low over a set block of time.
Share
Hot topics

STP, NDD, ECN and DMA: Broker Execution Models Decoded
When picking a forex broker, we don’t just look at the brokerage that has the lowest spreads, bonuses, and other kind of what is apparent for us. There is one...
Read more



Submit comment
Your email address will not be published. Required fields are marked *