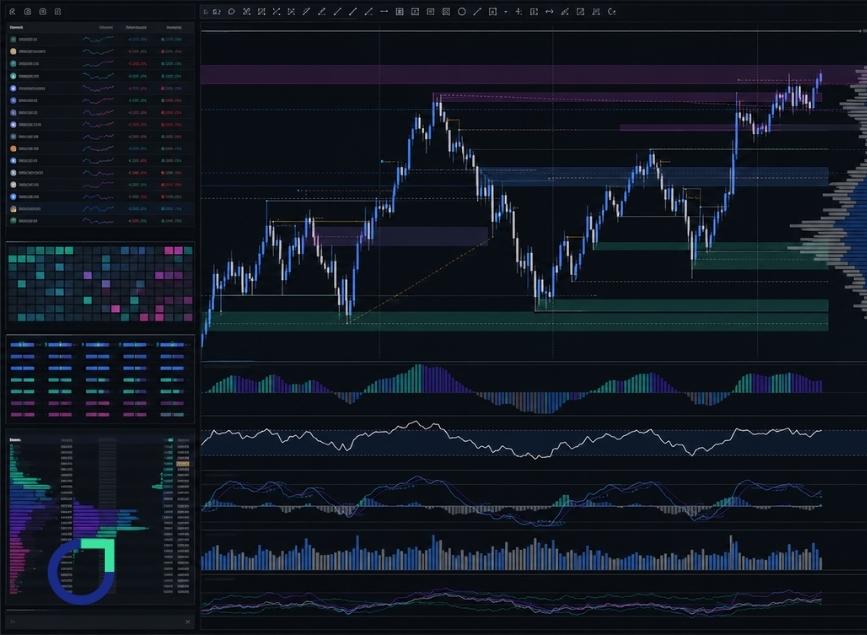
Best Technical Analysis Tools in MT5 for Professional Traders
MetaTrader 5 is more than just a software with simple charts. Traders can use various indicators, the ability to draw diagrams, access to market data, and apply customization that helps in getting more order in their analysis.
For a real-life trader, the actual value is not in using all features, but in selecting the right tools, applying them logically, and, finally, creating the necessary workflow to make the right decisions without making the chart too complicated.
Why MT5 Is Popular Among Traders
MT5 combines charting, order execution, analysis, automation, and account management in one platform. Traders can study the market and place trades without moving between different programs.
It supports candlestick, bar, and line charts, along with many timeframes. This makes it useful for both short-term traders and those who follow broader market trends.
A trader may use the daily chart to identify direction and then move to the one-hour chart to find an entry. This top-down approach helps reduce noise.
MT5 may also support forex, indices, commodities, stocks, futures, and cryptocurrencies, depending on the broker.
The platform includes an economic calendar and supports automated trading through Expert Advisors. Traders can test strategies, create alerts, and review historical performance.
Its wide range of Technical Analysis Tools is useful, but more features do not automatically lead to better results. Traders still need a clear method.
Trend Analysis Tools in MT5
Market trend tools are used to help traders know whether the market is going up, down, or sideways.
The most common indicators used in MT5 are the moving averages. They take the amplitude of prices into account and help us see the overall price movement easier.
In the case of a simple moving average, all prices receive the same weight. But the exponential moving average gives more importance to recent price data.
Many traders work with moving averages of 50 and 200 periods and by analyzing historical data they have concluded that the crossing of the moving average of 50 periods above the moving average of 200 periods from downwards means that the market is likely to enter an upward trend.
However, one should also keep in mind that the moving averages give signals with some delay. They work right in the trending markets while in flat markets their signals are not so good.
The Average Directional Index indicates the strength of the market trend. If ADX is rising, it tells us that the trend is stronger and if it is low, it is an indication of week trends and ranging.
The Parabolic SAR is another built-in tool. It places dots above or below price in order to show the probable direction of the trend and possible reversals.
These tools can work better if they are used in conjuction with the price structure and market conditions.
Oscillators and Momentum Indicators
Oscillators assist traders in analyzing momentum and determining potential overbought and oversold situations.
The Relative Strength Index, commonly called RSI, fluctuates between a range of 0 to 100. Numbers higher than 70 are usually dubbed overbought and numbers below 30 are viewed as oversold.
Nonetheless, these levels are not necessarily trigger points for trades; in a strong trend, RSI can stay overbought or oversold for an extended period.
Traders also watch divergence. If price makes a new high while RSI forms a lower high, momentum may be weakening.
MACD is another popular indicator. It tracks changes in trend direction and momentum through the MACD line, signal line, and histogram.
A Comparison of RSI and MACD Indicators shows that RSI is often used for momentum extremes, while MACD is generally more useful for trend and momentum changes.
The Stochastic Oscillator, Commodity Channel Index, and Williams’ Percent Range are also available.
Using several similar oscillators together can create duplicate signals. It is usually better to choose one and combine it with trend analysis.

Drawing Tools and Chart Objects
Tools for drawing allow people who trade markets to analyze structure using charts. Horizontal lines represent areas of resistance and support, prior lows and highs, and levels of psychology.
Trend lines allow traders to find lower lows if market is bullish or lower highs if the market is bearish.
Channels use horizontal and diagonal lines to show some price movement in a structured manner.
Rectangles are used for identification of support and resistance zones.
The MetaTrader platform also includes arrows, text labels, shapes, and other chart objects that make analysis easier to organize.
A trader can mark the planned entry, stop loss, target, and invalidation level before opening a position.
Too many objects can make a chart confusing. Good chart analysis should remain clear and easy to review.
Fibonacci Tools in MT5
MT5 includes Fibonacci retracement, expansion, fan, arc, channel, and time-zone tools.
Fibonacci retracement is the most widely used. Traders draw it between a major high and low to identify possible pullback levels.
Common levels include 23.6%, 38.2%, 50%, 61.8%, and 78.6%.
For example, a trader may see price pull back to the 50% level during an uptrend. If that area also matches previous support, it may become more important.
Fibonacci extension tools can help identify possible profit targets. Levels such as 127.2% and 161.8% are often monitored.
These tools should not be used alone. They become more useful when they overlap with trendlines, moving averages, support, or resistance.
Traders should also use consistent swing points. Adjusting the tool to force a preferred level can lead to biased analysis.
Volume and Market Analysis Tools
Volume tools help traders study market activity and participation.
In forex, volume usually means tick volume rather than the total number of contracts traded worldwide. Tick volume measures how often price changes.
Although it is not centralized market volume, it can still show when activity is rising or falling.
The built-in Volumes indicator displays activity as a histogram. Traders may compare current volume with recent periods to identify unusual changes.
On-Balance Volume combines price direction with volume. The Money Flow Index also uses price and volume data to show possible momentum shifts.
MT5 may also provide Depth of Market information, depending on the broker and instrument. This shows available buy and sell liquidity at different price levels.
However, forex depth data usually represents the broker’s liquidity sources, not the whole global market.
| Tool | Main Purpose | Best Use | Main Limitation |
| Moving Average | Identify trend direction | Trend-following | Delayed signals |
| RSI | Measure momentum | Overbought, oversold, divergence | Can remain extreme |
| MACD | Track trend and momentum | Crossovers and divergence | Can react slowly |
| Fibonacci Retracement | Find pullback zones | Trend continuation | Depends on swing selection |
| Volume Indicator | Measure activity | Breakout confirmation | Usually tick-based |
| Trendline | Show structure | Breakouts and support | Can be subjective |
No tool works perfectly in every market condition. Each one should have a clear purpose.
Custom Indicators and Add-ons
“MT5 enables traders the use of custom indicators built through MQL5 programming language.
The types of these devices are many in number; they can include event indicators, calculations for the size of trades, volatility tools, and alerts.
Some examples are automatic marking of market opening times and monitoring the changes in spreads, among other functions.
The metatrader5 account can give support to scripts and Expert Advisors created by third-party systems and analytic tools based on the broker’s rights.
Custom indicators can be helpful in the saving of time, but they require proper testing.
Testing ensures that the indicator will perform well in real-time rather than being simply a good-looking tool that provides false signals.
A trader should pay attention to what the tool measures, and whether it delivers information about its measurements constantly and doesn’t repaint them.”

Building an Effective MT5 Workflow
A useful MT5 workflow should make trading decisions clearer, not more complicated.
The process can begin with a watchlist of the markets a trader follows regularly.
Next, the trader can review a higher timeframe, such as the daily or four-hour chart, to identify trend direction and important price zones.
A lower timeframe can then be used for entry planning. This prevents the trader from reacting only to short-term noise.
A basic trading setup can include a single momentum indicator, one trend indicator, support and resistance and a risk-reward tool.
For example, you can use a moving average of 50 periods in combination with RSI and horizontal levels.
You can create chart templates so that the same settings can be easily applied to other instruments.
Profiles allow you to create independent groups of charts with different instruments such as currencies, stocks, and commodities.
Price alerts mean that you do not have to keep staring at charts all the time.
A trader using a provider such as otet should still confirm which symbols, indicators, and market data features are available through that broker.
The final step is review. Saving screenshots and recording trade reasons can help traders identify which tools add value and which ones create noise.
Conclusion
MT5 provides indicators, drawing tools, Fibonacci features, volume tools, custom add-ons, and automation options.
The most useful tools are not always the most advanced. They are the ones that fit the trader’s strategy and support clear decisions.
Moving averages and ADX can help with trends. RSI and MACD measure momentum. Drawing tools and Fibonacci levels can improve market structure analysis.
Volume tools and Depth of Market can add context, while custom indicators may improve efficiency.
Professional traders never overcrowd their charts with many indicators, as they prefer applying a concise system of indexes, knowing the limitations of every indicator, and monitoring their performance.
It is reasonable to think that the most effective use of technical tools is achieved when technical analysis is applied in the context of the market, timely entry into trades, and proper management of risks.
FAQ
No indicator in MT5 is perfect under all conditions but simply points out some characteristic of the market behavior.
Moving averages may work well in trending markets, while RSI may be more suitable for assessing the momentum and divergence. It is generally believed that the most efficient way is to use a combination of several complementary tools.
Generally, MT5 is equipped with a larger number of timeframes, included indicators, chart objects, testing capabilities, and market data options than is MT4.
Nonetheless, MT4 may be deemed suitable by some traders desiring greater simplicity when trading or using old custom tools.
Absolutely. MT5 permits the use of custom indicators that can be developed using MQL5.
However, these indicators should be downloaded from reputable sources and tested thoroughly prior to deployment in live trading.
The most common trend trading tools include moving averages, ADX, Parabolic SAR, trendlines, and channels.
A trader can use one trend indicator combined with price action and a momentum indicator for more reliable confirmation.
Share
Hot topics

STP, NDD, ECN and DMA: Broker Execution Models Decoded
When picking a forex broker, we don’t just look at the brokerage that has the lowest spreads, bonuses, and other kind of what is apparent for us. There is one...
Read more


Submit comment
Your email address will not be published. Required fields are marked *