
How Does the Awesome Oscillator Work in Trading?
Momentum is a core concept in trading. Long-term market trends are seldom random. Prices typically strengthen, stagnate, reverse, or surge again. The challenge for traders is to recognize these shifts early enough to make well-informed choices.
The Awesome Oscillator addresses this challenge. It is a straightforward momentum indicator, helping traders identify whether buyers or sellers currently control the market. Unlike complex tools, it displays data with a clean histogram, making it accessible even to novices.
The indicator was developed by Bill Williams, a well-known market analyst specializing in market psychology and trend behavior. His purpose was not to forecast the market perfectly. Instead, he expected traders to figure out what was actually going on behind the price movement.
In this article, we will discover what is the Awesome Oscillator, how it works, how traders use it, and how to combine it with other tools to enhance analysis.
What Is the Awesome Oscillator?
The Awesome Oscillator is a momentum indicator that compares recent price movements with long-term price movements to determine market momentum.
The core premise is straightforward. The histogram usually moves upward when short-term momentum exceeds long-term momentum, and when momentum begins to weaken, the histogram will begin to fall.
The Awesome Oscillator compares short-term and long-term momentum to help traders understand whether buyers or sellers are gaining strength.
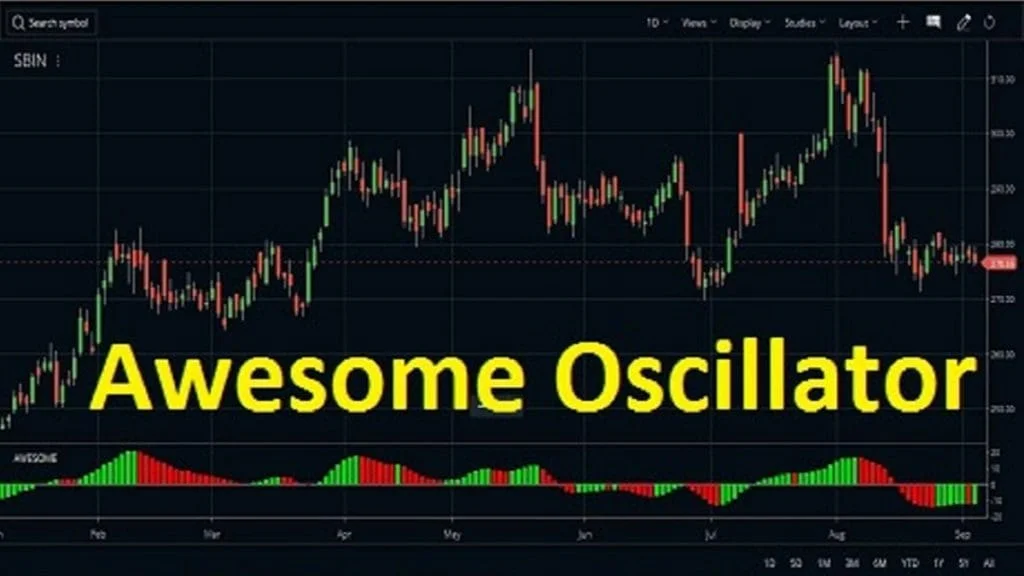
The indicator appears below the main chart as green and red histogram bars.
- Green bars usually indicate growing bullish momentum.
- Red bars often indicate weakening momentum or stronger selling pressure.
This tool is designed to help traders identify shifts in momentum before they become visible on the chart.
Many traders find it helpful to use the indicator within the MetaTrader platform because it is a pre-installed indicator, therefore, easy to apply to their charts.
Unlike some indicators, which overload the screen with multiple lines, the Awesome Oscillator is visually straightforward. Due to its simplicity, it is often listed among the top 10 forex indicators widely used by traders.
Awesome Oscillator Overview Table
| Feature | Description |
| Indicator Type | Momentum Oscillator |
| Created By | Bill Williams |
| Main Purpose | Measure market momentum |
| Display Type | Histogram |
| Best Markets | Forex, stocks, crypto, indices |
| Common Timeframes | 15M, 1H, 4H, Daily |
| Platform Availability | Most trading platforms |
How Does the Awesome Oscillator Work?
Many beginner traders wonder, “How Does the Awesome Oscillator Work?”
This indicator looks at two different moving averages based on the median price of the market and measures the momentum.
One average reacts more quickly to recent price movement, whereas the other one reacts slowly. The histogram will show an increase above the zero line when the short-term momentum exceeds the longer-term momentum. A decreasing histogram indicates that a price is losing momentum.
For instance, consider that EUR/USD is climbing consistently for several days. Price action may still look bullish, but the histogram can begin shrinking, showing that buying momentum is slowly weakening.
The reduction in the size of the histogram may indicate that buyers have lost their strength before the price fully reverses.
Many traders use this signal to avoid entering trades at or near the peak of the trend. For others, they may use this signal to be prepared to take advantage of potential reversal or trend continuation patterns.
This is why traders use the indicator to:
- Spot trend continuation
- Detect possible reversals
- Confirm breakout strength
- Analyze momentum shifts
Basic Momentum Flow Chart
Strong Buying Pressure
↓
Short-Term Momentum Increases
↓
Histogram Turns Green
↓
Bullish Momentum Signal
The indicator doesn’t predict the future perfectly. Instead, it enables traders to determine if the present price movement still has sufficient strength behind it.
How Is the Awesome Oscillator Calculated?
The calculation behind the indicator is relatively simple First, the median price is calculated:
\frac{High+Low}{2}
Then the indicator compares:
- 5-period Simple Moving Average
- 34-period Simple Moving Average
The formula becomes:
AO = SMA(5)-SMA(34)
When the short-term average rises faster than the long-term average, bullish momentum rises. When the short-term average weakens, bearish pressure becomes more noticeable.
This idea is closely related to the principle behind a moving average indicator because both tools look at average price behavior over time.
Short-Term Momentum > Long-Term Momentum
↓
Histogram Moves Above Zero
↓
Bullish Momentum Increases
The platform is designed to perform all calculations automatically in real trading conditions, and presents the results as histogram bars. As such, traders are not required to manually calculate these figures, but instead they can concentrate on identifying trends and shifts in momentum.
Main Awesome Oscillator Trading Signals
The indicator generates several well-known trading signals.
- Zero Line Cross
This is the most common signal.
- Histogram crosses above zero → bullish momentum.
- Histogram crosses below zero → bearish momentum.
Traders often combine this signal with support and resistance analysis instead of using it alone.
- Twin Peaks Signal
This setup identifies possible reversals.
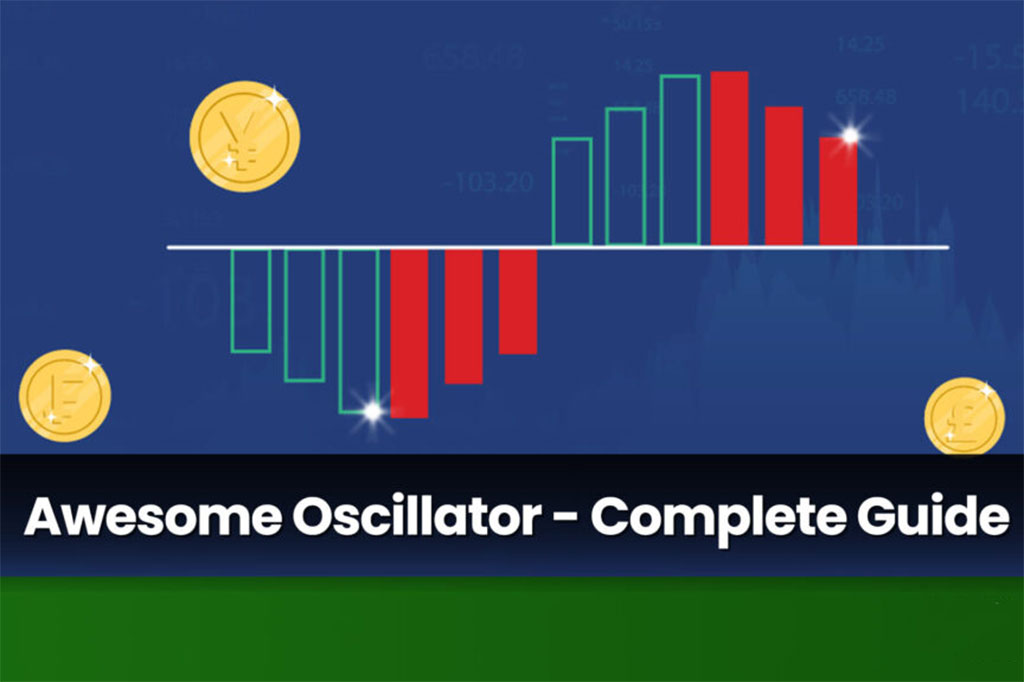
Bullish Twin Peaks
- Two lows below zero
- The second low is higher.
- Indicates weakening bearish momentum
Bearish Twin Peaks
- Two peaks above zero
- The second peak is lower.
- Indicates weakening bullish momentum
- Saucer Setup
This signal focuses on momentum acceleration.
Bullish Saucer
- Appears above zero
- Two red bars followed by one green bar
Bearish Saucer
- Appears below zero
- Two green bars followed by one red bar
Awesome Oscillator Signal Table
| Signal Type | Bullish Meaning | Bearish Meaning |
| Zero Line Cross | Momentum increasing upward | Momentum weakening |
| Twin Peaks | Potential reversal upward | Potential reversal downward |
| Saucer | Trend continuation upward | Trend continuation downward |
How to Read Awesome Oscillator Signals Correctly
Many traders have the habit of seeing every trading signal in terms of a high-probability entry. This is where context comes into play.
For example, a small bullish shift in the histogram may fail rapidly if there has been a bearish trend throughout the market.
This is why experienced traders usually analyze:
- Market structure
- Trend direction
- Key support and resistance zones
- Volume
- Volatility conditions
Assume EUR/USD is in a strong downtrend, following important economic news. Even if the histogram briefly turns green, sellers may continue to dominate the market.
This would represent a very different situation when the price begins to experience some retracement in a good uptrend, and we see the indicator begin to show signs of a bullish trend again. In this case, the bullish signal would have much more confidence behind it.
Reading Signals More Effectively
| Market Condition | Signal Reliability |
| Strong Trend | Higher |
| Sideways Market | Lower |
| High Volatility News | Riskier |
| Multi-Timeframe Confirmation | Better Accuracy |
In addition, it takes time and patience for a trader to make good trades. Many successful traders wait for a confirmation candle before placing trades instead of simply reacting immediately to every movement and color change.
How to Trade Using the Awesome Oscillator
There are multiple ways traders use the indicator in real trading situations.
Trend-Following Strategy
This is one of the simplest approaches.
- Identify the overall trend.
- Wait for a temporary pullback.
- Watch for momentum confirmation from the histogram.
- Enter in the direction of the trend.
For example:
- Price remains above a major moving average.
- The histogram temporarily turns red.
- Momentum shifts back to green.
- The trader enters a long position.
Breakout Trading
Traders also apply the indicator for breakout setups.
Imagine gold trading in a small range for several hours. Suddenly, the price breaks through resistance, and the histogram quickly extends upwards.
That rising momentum might confirm the breakout.
Multi-Timeframe Trading
Some traders combine:
- Daily trend analysis
- 4-hour confirmation
- 1-hour entry timing
This approach helps reduce false signals.
Simple Trade Setup Example
| Step | Action |
| 1 | Identify trend |
| 2 | Wait for pullback |
| 3 | Histogram changes direction |
| 4 | Confirm with candle structure |
| 5 | Enter trade with risk management |
Some traders also test these strategies through brokers like Otet Broker, depending on their preferred trading environment and charting tools.
Best Indicators to Combine with the Awesome Oscillator
The Awesome Oscillator will be more powerful when used in pairs with other tools.
Moving Averages
Moving averages help traders identify the broader trend direction.
For example:
- Price above 200 EMA
- Histogram turns bullish
- Higher probability long setup
RSI (Relative Strength Index)
RSI helps traders identify overbought and oversold market conditions.
For example, if the Awesome Oscillator turns bullish while RSI rises from oversold territory, traders may see this as stronger confirmation that momentum is shifting upward.
Likewise, if RSI shows overbought conditions while the histogram begins weakening, it may warn that bullish momentum is fading.
MACD
MACD also measures momentum.
Some traders look at both indicators to confirm that there is a significant movement taking place in the market.
Support and Resistance
This is one of the most beneficial combinations.
For instance, a bullish histogram signal near key support usually creates a much more solid setup than a random signal occurring somewhere in the middle of the chart.
| Indicator | Purpose |
| Moving Average | Trend direction |
| RSI | Overbought/Oversold |
| MACD | Momentum confirmation |
| Support & Resistance | Entry zones |
| Volume Indicators | Participation strength |
Many traders will compare each of these tools with each other while doing their own research & determining the top 10 Forex Indicators for their individual trading style.
Advantages of the Awesome Oscillator
Simplicity is one of the main advantages of momentum histogram indicators.
For beginners, the histogram layout is easy to visually interpret.
Another positive aspect is versatility; they are adaptable across all markets and all timeframes and can be utilized by different trading styles.
Also, it’s included by default on most trading platforms, which is why they are easily accessible.
Compared to slower trend indicators, momentum histogram indicators react quickly to momentum changes, which helps traders identify early shifts in market conditions.
Traders value that momentum histogram indicators also eliminate the need for multiple overlapping lines on the same chart, allowing for a clearer representation of momentum on a chart.
For traders looking at technical analysis, the indicator can also be a useful introduction to momentum concepts.
Limitations of the Awesome Oscillator
While the indicator does have some advantages, it also presents various limitations. A very typical drawback is the tendency to generate false signals during so-called sideways trends. Because these markets are without clear direction, the histogram tends to fluctuate back and forth between bullish and bearish states too frequently for any legitimate trend to develop.
Then there’s the issue of lag. Even though the indicator does respond fairly quickly, it still depends upon using moving averages derived from previous price history to determine current conditions. Consequently, the trader may receive confirmation after a move has already begun.
Also, the indicator does not provide a stop loss or precise entry points. A trader will also require risk management through their own additional analysis in order to make decisions about their trading activity.
Finally, news events can also interrupt momentum readings. A technical setup might appear to be ideal, but may subsequently produce different results due to external circumstances like economic reports or geopolitical events.
Some beginner traders also make the mistake of overtrading each signal. A green bar does not necessarily indicate that the market will continue to rise. Understanding market context is important.
Conclusion
The Awesome Oscillator is a useful momentum indicator that helps traders identify market strength and momentum fluctuation. Its simplicity appeals to beginners, but its flexibility keeps it practical for experienced traders as well.
The indicator performs best when accompanied by detailed market analysis, risk management, and additional confirmation techniques.
The indicator is not intended to be interpreted as an all-encompassing predictor. Therefore, traders must consider this indicator as one component of a more extensive trading plan.
Many traders continue using the Awesome Oscillator because it remains simple enough for beginners while still offering valuable momentum insights for experienced traders.
Beginners can understand the histogram quickly, while experienced traders can combine it with more advanced strategies involving trend structure, volatility analysis, and price action confirmation.
Understanding how momentum acts can significantly improve decision-making, and the Awesome Oscillator provides a simple starting point for understanding market dynamics.
FAQ
The Awesome Oscillator is mainly used to measure momentum and identify possible trend reversals or continuation setups. Traders often combine it with support and resistance or a moving average indicator for stronger confirmation.
The indicator compares short-term and long-term moving averages using median price data. The histogram visually shows whether bullish or bearish momentum is increasing.
Most traders use the default 5-period and 34-period settings created by Bill Williams. These settings are already available on the MetaTrader platform and work well for most trading styles.
Share
Hot topics

STP, NDD, ECN and DMA: Broker Execution Models Decoded
When picking a forex broker, we don’t just look at the brokerage that has the lowest spreads, bonuses, and other kind of what is apparent for us. There is one...
Read more



Submit comment
Your email address will not be published. Required fields are marked *