
What is a Doji Candlestick? Complete Guide to Trading Indecision Patterns
Introduction
If you’ve looked closely at a price chart, you might have spotted candles that stand out from the others. Some have long bodies that indicate powerful buying or selling pressure, while others seem nearly flat, as if the market paused for a moment. Among these unique candles, the Doji is one of the most fascinating and often debated patterns in technical analysis.
Many traders ask the same question: What is a Doji candle? when they first encounter this pattern. The answer resides in the psychology of price fluctuations. Markets change due to a continuous conflict between buyers and sellers. Sometimes one side definitely wins, while other times neither side takes control.
Understanding the Doji candlestick pattern can help traders identify market indecision. These periods often occur before major trends form or when existing trends slow.
Key Takeaways: This article will explain how Doji candles form, why they’re important, and how to use them in trading. You’ll learn how to recognize Doji patterns and apply them to forex, stocks, or cryptocurrency. Applying this knowledge may strengthen your trading approach.
What Is a Doji?
A Doji candle is formed when the opening and closing prices of a trading session are almost the same. In other words, the market opens, moves around during the session, and then ends relatively close to where it began.
A Doji resembles a thin cross or plus sign on a candlestick chart. The body is incredibly small, and the shadows above and below might change in length due to the price movement during the session.
When traders ask, What is a Doji candle? The simplest answer is that it reflects uncertainty. Buyers pushed up the price, sellers pushed it down, and neither side was able to take complete control.
This period of equilibrium might occasionally indicate a shift in market behavior. If a strong trend has been going for a long period of time and a Doji shows up, it might indicate that the strength behind that trend is weakening.
Key Takeaway: A single Doji candle alone does not confirm a reversal, but it is a signal to watch for further market clues.
Key Characteristics of a Doji Candle
The most significant characteristic of a Doji candle is its extremely small size. This suggests that the open and closing prices were practically the same.
Another important feature is the existence of shadows, often known as wicks. These shadows indicate how far the price moved during the session before it returned to the starting level.
In rare circumstances, the shadows may be longer, indicating high volatility throughout the session. In other cases, they may be short, indicating that the market hardly moved at all.
The actual shape of a Doji varies depending on market conditions. Some variations appear symmetrical, whereas others demonstrate more rejection in one direction.
Regardless of the variation, the fundamental idea that drives the Doji candlestick pattern is the same: the market has reached a brief equilibrium between buyers and sellers.
Why Doji Patterns Matter?
Doji candles are important because they indicate when market momentum begins to slow down. Following a strong trend, these pauses might give early indications of a potential reversal.
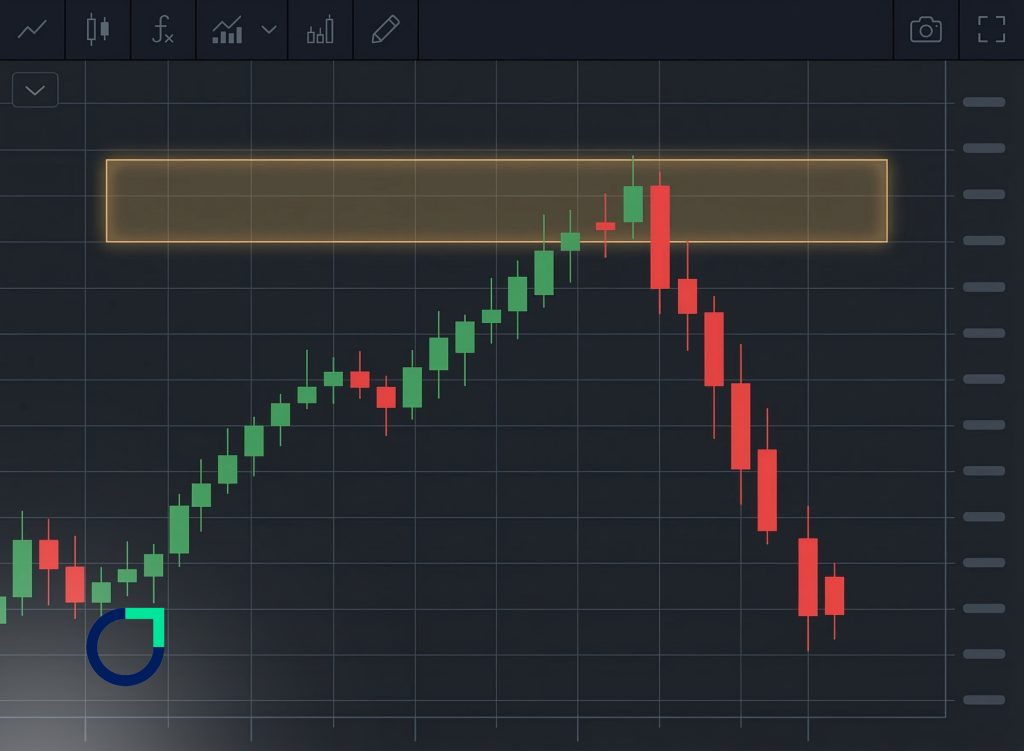
For example, consider a currency pair that has been gradually rising over several days. Suddenly, a Doji appears at the peak of the trend. This might signal that buyers are beginning to lose confidence.
On the other hand, if a Doji shows up after a long downtrend, it might indicate that sellers are exhausted.
Traders frequently treat these indications as warnings rather than direct entry points. A Doji alone is insufficient for confirming a reversal, but it might indicate that the market condition is shifting.
This is why many traders use Doji patterns together with other strategies like Trading with price action and trend analysis.
Major Types of Doji Candlestick Patterns
Not all Doji candles look the same. Over time, traders have identified several variations that provide slightly different insights into market behavior.
Each type reflects a different balance between buyers and sellers.
Standard Doji (The Plus Sign)
The standard Doji appears as a simple plus symbol on the chart. It happens when the open and close prices are largely identical, and the upper and lower shadows are about equal.
This pattern represents total indecision. Buyers and sellers both tried to move the price in their favor, but neither succeeded. Standard Doji candles usually appear during consolidation periods.
Long-Legged Doji (High Volatility Indecision)
A long-legged Doji has extremely long upper and lower shadows. This signifies that the price fluctuated widely during the session but ended close to the starting level.
This pattern reflects a highly emotional trading session in which buyers and sellers clashed fiercely. The outcome is high volatility with no apparent winner.
Dragonfly Doji (Potential Bullish Reversal)
A Dragonfly Doji is formed when the opening and closing prices are close to the candle’s highest point. It has a long lower shadow but nearly no upper shadow.
This shows that sellers primarily pushed prices down, but buyers retook control before the session closed. Traders may take this as a probable bullish reversal signal.
Gravestone Doji (Potential Bearish Reversal)
The Gravestone Doji is basically the reverse of the Dragonfly. It has a large upper shadow but nearly no lower shadow.
In this scenario, buyers pushed the price upward during the session, while selling finally moved it back lower. This pattern might pop up near market peaks.
Four Price Doji (Extreme Illiquidity)
The Four Price Doji is a rare occurrence in which the open, high, low, and close prices are all identical.
It often emerges in relatively calm markets with minimal trading activity. Because of its rarity, traders usually ignore it while making trading decisions.
Star Doji (Morning and Evening Star Formations)
Star Doji candles are used in multi-candle layouts like the Morning Star and Evening Star. These formations frequently indicate possible reversals following strong trends. The Doji in the center signifies the point at which the preceding trend loses strength.
How to Trade the Doji Pattern Effectively
Recognizing a Doji is only the first step. Successful traders focus on context rather than relying on the candle alone.
Below are four practical steps that traders often follow when using Doji patterns.
Step 1: Identify the Pattern in Context
A Doji is most relevant when it emerges following a significant trend.
If the market has been going upward for a long time and a Doji occurs near resistance, traders may begin to plan for a probable reversal. Without context, a Doji in a sideways market has little meaning.
Step 2: Assess Volume and Market Trend
Volume might give significant confirmation.
If a Doji comes alongside rising volume, it indicates that market players are considering the next direction. Traders can also look at the overall trend utilizing tools offered on cTrader platforms or other charting software.
Traders can also look at the overall trend utilizing tools offered on cTrader platforms or through brokers like 0tet, which provide advanced charting and execution features.
Step 3: Look for Confirmation Signals
Professional traders occasionally make orders based entirely on Dojis.
Instead, they await confirmation from the following candle. For example, when a bearish candle appears after a Gravestone Doji near resistance, it enhances the reversal signal.
Step 4: Setting Entry, Stop-Loss, and Profit Targets
Risk management is extremely important.
Many traders set stop-loss orders just above or below the Doji’s shadow. Profit objectives might be based on close support and resistance levels. This systematic approach assists in maintaining discipline when trading the pattern.
Integrating Doji with Other Technical Indicators
While Doji candles are useful, they become much more powerful when combined with other technical indicators.
These tools help confirm whether a potential reversal is actually developing.
Support and Resistance Levels
Support and resistance are probably the most fundamental principles in technical analysis.
A Doji that develops at a major support or resistance level is significantly more important than one that appears at random on a chart. These zones frequently serve as decision zones where market players reconsider their orders.
Moving Averages (MA)
Moving averages can assist traders in detecting the general market trend. A Doji near a significant moving average may indicate that the trend is about to reverse direction.
For example, traders often pay more attention to Dojis that appear at the 200-day moving average.
Relative Strength Index (RSI)
The RSI indicator determines if a market is overbought or oversold. When a Doji forms while the RSI is in severe circumstances, the likelihood of a reversal increases. This combination can assist traders in improving their timing.
Bollinger Bands
Bollinger Bands are used to measure market volatility.
If a Doji emerges in the upper or lower band, it might indicate that the price has hit an extreme level. Traders may combine this signal with The best candles for trading strategy to enhance precision.
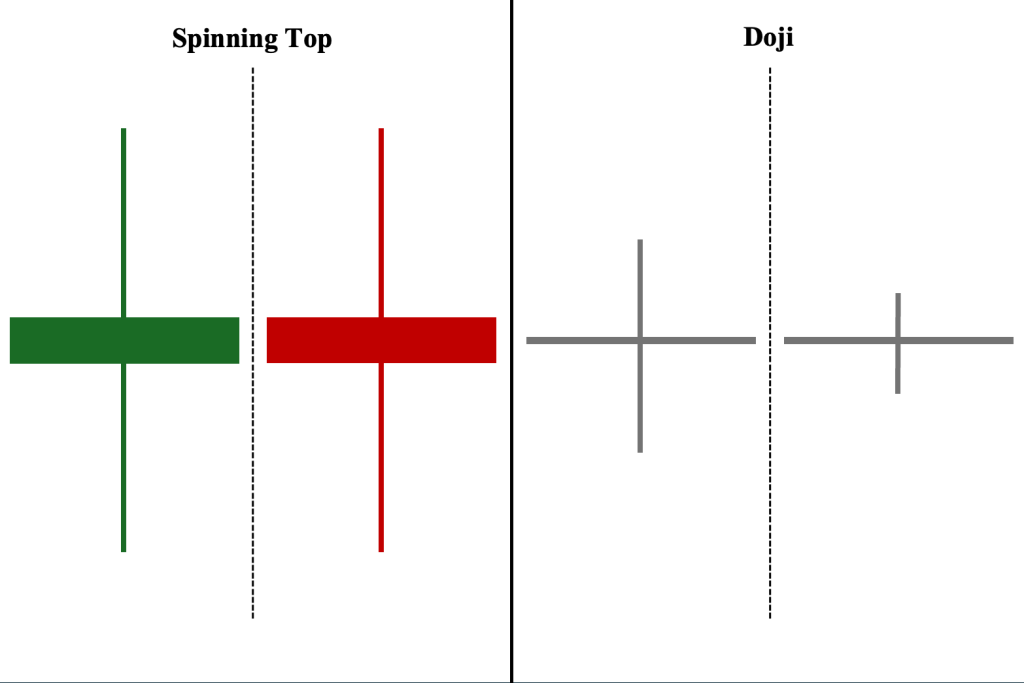
Doji vs. Spinning Top
Both the Doji and the Spinning Top show market indecision, but they are not the same. A Doji has a very small or nearly invisible body, meaning the opening and closing prices are almost identical, which reflects a near-perfect balance between buyers and sellers.
In contrast, a Spinning Top has a small but visible body with long shadows, indicating that while the market was uncertain, there was still a slight advantage for either buyers or sellers by the close.
In practice, both patterns signal hesitation, but a Doji usually carries a stronger warning of a potential reversal, especially after a strong trend, while a Spinning Top often suggests a temporary pause rather than a clear shift in direction.
Understanding this subtle difference helps traders interpret price action more accurately.
Advantages of Doji Candles
Doji candles offer several practical benefits that make them a valuable tool for traders looking to understand market behavior.
Clear Visual Signal
Doji candles are easy to recognize on charts, making them accessible even for beginner traders.
Early Warning of Trend Changes
They often appear before reversals or major market shifts.
Useful Across All Timeframes
Doji patterns can appear on short-term intraday charts or long-term weekly charts.
Works Well with Price Action Trading
They integrate naturally with strategies focused on market structure and Trading with price action.
Limitations of Using Doji Candles
Despite their usefulness, Doji candles also come with certain limitations that traders should be aware of before relying on them.
Lack of Confirmation
A single Doji does not guarantee a trend reversal.
Frequent Appearance
Because they appear frequently, not every Doji has strong significance.
Context Dependency
Their meaning changes depending on where they appear in the market structure.
Risk of False Signals
Without additional indicators, traders may misinterpret the pattern.
Doji in Different Markets: Forex, Stocks, and Crypto
Doji candles are seen in all financial markets, such as forex, stocks, and cryptocurrency.
In the forex market, they frequently occur within important economic events or session shifts.
In stock markets, Doji formations are common around earnings announcements or important support levels.
In the cryptocurrency markets, it can indicate caution during high volatility periods.
Although the underlying markets fluctuate, the psychology behind the Doji candlestick pattern stays consistent: a temporary balance between buyers and sellers.
Conclusion
Doji candles are basic yet effective instruments for technical analysis. They illustrate events when the market stops, and players reconsider their orders.
Learning about Doji candles allows traders to get the psychology behind price movement rather than just responding to charts.
However, the true significance of the Doji emerges when combined with deeper analysis. Support and resistance levels, trend direction, and confirmation candles are all crucial indicators.
When applied appropriately, Doji patterns may be a valuable component of a balanced trading strategy.
FAQ
What is a Doji candlestick?
A Doji candlestick is a chart pattern that forms when the opening and closing prices of a trading session are nearly identical. It represents market indecision between buyers and sellers.
Does the color of a Doji (red or green) matter?
The color usually has little significance because the body is extremely small. Traders focus more on the candle’s location and the surrounding market context.
Is a Doji candle bullish or bearish?
A Doji itself is neutral. Its interpretation depends on where it appears within a trend and what happens in the following candles.
Is the Doji candlestick pattern profitable?
The pattern can be useful when combined with other tools such as trend analysis, support and resistance, and confirmation signals. On its own, it should not be used as the sole basis for a trade.
Share
Hot topics
Best Order Block Indicator for Trading
Introduction As you spend time analyzing price charts, you may notice the market often reacts to specific price ranges where strong buying or selling occurred. These price zones, known as...
Read more


Submit comment
Your email address will not be published. Required fields are marked *