
Global Markets Face Inflation Test as Week 24 Begins
Global markets enter June 8–14, 2026 with a defensive tone as strong U.S. data, higher yields, oil risk, and technology profit-taking reshape sentiment. The latest U.S. jobs report showed 172,000 new payrolls, far above the 85,000 forecasts, while unemployment held at 4.3%. This strengthened expectations that the Federal Reserve may keep policy restrictive or even raise rates later in 2026.
Treasury yields jumped, with the 2-year yield at 4.115% and the 10-year yield at 4.53%, while the U.S. Dollar Index rose to 100.06. This pressured gold, crypto, emerging markets, and high-duration equities. Wall Street also reversed sharply, with the S&P 500 falling 2.64% and the Nasdaq dropping 4.18%.
The key focusses this week is U.S. CPI on June 10 and PPI on June 11. Hot inflation could keep markets defensive, while softer data may trigger a relief rally. Oil remains at another major risk, with Brent nearly $92.89 and WTI around $90.25. Overall, investors face elevated volatility and should remain selective.
U.S. Economic Outlook: Strong Jobs and Sticky Inflation Keep Fed Risk in Focus
The U.S. economy enters the week of June 8–14, 2026 with solid growth signals but a more difficult market backdrop. Recent data show that the economy remains resilient, especially in the labor market and manufacturing sector, but inflation risk has returned as the main concern for investors. The key question is no longer only whether growth is slowing. Markets are now asking whether strong activity, higher oil prices, and sticky inflation could force the Federal Reserve to stay restrictive for longer or even consider another rate hike later in 2026.
The May jobs report was the main trigger for this shift. Nonfarm payrolls rose by 172,000, far above the 85,000 forecasts, while the unemployment rate stayed at 4.3%. Wage growth remained firm, with average hourly earnings up 0.3% month-on-month, though annual wage growth slowed to 3.4% from 3.6%. This suggests the labor market is not overheating aggressively, but it is still strong enough to keep pressure on the Fed.
Other labor indicators told a similar story. April job openings rose to 7.618 million, the highest level since May 2024, while initial jobless claims increased to 225,000. Claims are moving higher, but not enough to signal a serious labor-market break. This keeps the employment side of the Fed’s mandate stable and makes inflation data more important for policy expectations.
Manufacturing also improved. The ISM Manufacturing PMI climbed to 54.0 in May, its strongest level in four years. However, the price-paid index remained elevated at 82.1, showing that input-cost pressure is still a problem. Higher energy prices, the Iran conflict, and disruption around the Strait of Hormuz could keep transportation, production, and supply-chain costs high.
Markets reacted sharply. The 2-year Treasury yield rose to 4.115%, the 10-year yield climbed to 4.53%, and the U.S. Dollar Index reached 100.06, its highest level since early April. Wall Street also reversed, with the S&P 500 falling 2.64% and the Nasdaq dropping 4.18% on Friday. The selloff was concentrated in technology and semiconductors, where stretched AI-related positioning became more vulnerable to higher yields.
The key event this week is May CPI on Wednesday, June 10. CPI is estimated to have risen 0.52% in May, potentially lifting annual inflation to 4.2%. Energy goods may have jumped 8%, while core prices are expected to rise a more moderate 0.23%. PPI on Thursday, June 11, jobless claims, consumer sentiment, inflation expectations, and Treasury auctions will also shape market direction.
Overall, the base case is elevated volatility. Hot CPI and strong PPI would support the dollar and yields while pressuring equities, gold, crypto, and emerging-market assets. Soft inflation, stable claims, and strong Treasury auction demand could trigger a relief rally. Until the data are clear, traders should expect a sensitive market across bonds, equities, the dollar, gold, oil, and crypto.
Wall Street and U.S. Dollar Outlook: Fed Risk Returns as Tech Rally Breaks
Wall Street and the U.S. dollar enter the week of June 8–14, 2026 at a critical turning point after stronger-than-expected U.S. labor data revived fears of a more hawkish Federal Reserve. The market narrative has shifted from AI-led optimism and stable rates toward strong U.S. growth, sticky inflation risk, higher Treasury yields, and possible Fed tightening later in 2026.
The main trigger was the May jobs report. U.S. nonfarm payrolls rose by 172,000, well above the 85,000 forecasts, while unemployment stayed at 4.3%. Wage growth increased 0.3% month-on-month, showing that the labor market remains resilient but still firm enough to matter for inflation expectations.
Treasury yields reacted sharply. The 2-year yield rose to 4.115%, while the 10-year yield climbed to 4.53%. This supported the U.S. dollar, with DXY rising to 100.06, its highest level since early April, and gaining around 1.2% for the week. Dollar strength was driven by strong U.S. data, higher yields, and safe-haven demand from Middle East tensions.
Wall Street reversed heavily. The S&P 500 fell 2.64% to 7,383.74, the Nasdaq dropped 4.18% to 25,709.43, and the Dow lost 695.15 points to 50,866.78. The selloff was concentrated in technology and semiconductors, where stretched AI positioning became vulnerable. The Philadelphia Semiconductor Index suffered its worst one-day percentage decline since March 2020, erasing more than $1 trillion in market value.
This week, U.S. CPI on June 10 and PPI on June 11 will be decisive. Hot inflation could lift DXY toward 100.50–101.00 and pressure equities further, while softer data could support a relief rally. Until inflation data are clear, the dollar remains favored over high-duration risk assets.
USD Technical analysis
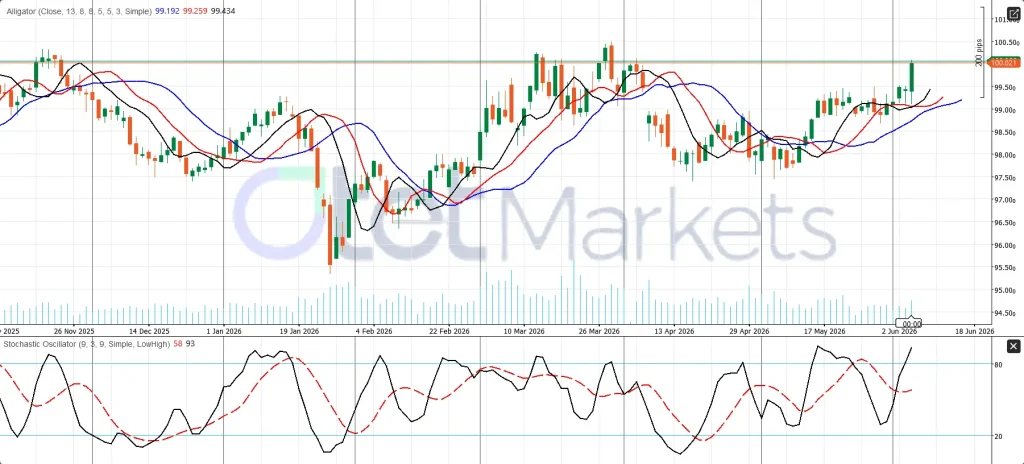
The daily U.S. Dollar Index (DXY) chart has turned constructive again. Price is trading near 100.021, above the full Alligator cluster, with the slower lines holding around the 99.19–99.43 zone. That structure shows the short-term trend has shifted back in favor of buyers after the earlier consolidation phase.
Technically, the key level now is the 100.00–100.02 resistance area. A firm daily close to that zone would confirm continuation and expose the next upside levels near 100.50 and then 101.00. On the downside, the first support sits around 99.43, followed by 99.25, while the broader trend floor comes near 99.19. As long as DXY remains above the Alligator cluster, the bias stays mildly bullish.
Momentum is positive but not fully clean yet. The stochastic oscillator has turned sharply higher and is moving toward the upper zone, which signals renewed upside pressure, but it also warns that the index is approaching a short-term overbought area. In practical terms, this is a bullish chart pressing resistance, not yet a fully confirmed breakout.
S&P 500 Technical analysis
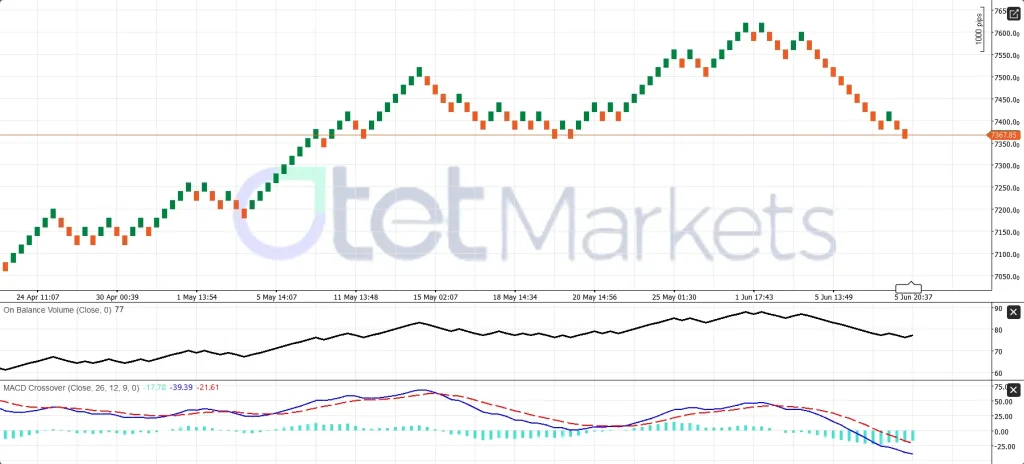
The daily S&P 500 / US500 chart has lost upside momentum after failing to hold the recent peak zone around 7,600–7,620. Price is now trading near 7,367.85, and the latest candle structure shows a clear corrective downswing from the June high. The immediate pivot is 7,368. As long as price remains below the recent rebound highs, the short-term tone stays pressured.
From a price-structure perspective, the first resistance now sits near 7,420–7,450, followed by the more important supply zone around 7,550–7,620. On the downside, the first support comes in around 7,300, and if that level gives way, the next broader downside area is near 7,200. The chart no longer looks like a clean trend continuation setup. Instead, it looks like a pullback phase after an extended rally.
The supporting indicators also lean softer. On-Balance Volume has rolled over from its recent highs, which suggests participation has weakened during the decline. At the same time, the MACD structure has turned negative, with the histogram below zero and the MACD line still under the signal line. In practical terms, this is not a panic chart, but it is a chart where momentum favors sellers unless price can reclaim the 7,420–7,450
Eurozone Outlook: Weak Growth, ECB Rate Risk, and EUR/USD Pressure
The Eurozone enters the week of June 8–14, 2026 with a fragile macro backdrop. Growth momentum is weakening, consumer demand is soft, bond yields are rising, and energy-related inflation risks are again complicating the European Central Bank’s policy path. The region is not in a deep crisis, but the latest data show an uneven recovery that remains vulnerable to higher oil prices, a stronger U.S. dollar, and geopolitical uncertainty.
The clearest warning came from GDP data. The Eurozone economy contracted 0.2% quarter-on-quarter in Q1 2026, missing expectations for 0.1% growth and reversing the previous 0.1% expansion. Annual GDP growth slowed sharply to 0.3%, below the 0.8% forecast and down from 1.2% previously. Ireland’s 12.1% GDP drop distorted the headline figure, but the broader message remains negative: the Eurozone is struggling to generate stable, broad-based growth.
Employment is still holding up better than output. Quarterly employment rose 0.1%, while annual employment growth stayed at 0.5%. This suggests the labor market has not yet entered a deep downturn. However, weaker output and slower job creation show that the region’s economic cushion is becoming thinner.
Consumer activity also looks cautious. Eurozone retail sales fell 0.4% month-on-month in April, worse than the expected 0.3% decline, while annual sales growth slowed to 1.0% from 2.1%. France showed some resilience, with its trade deficit narrowing to €5.6 billion and exports rising to €54.6 billion. However, Italy’s retail sales were flat at 0.0%, while annual growth slowed to 1.6% from 3.8%, confirming uneven demand across the region.
Markets reflected this weakness. The euro fell around 0.7% to nearly $1.1525, pressured by soft Eurozone data and a stronger U.S. dollar. Bond yields also rose, with Germany’s 2-year yield at 2.654% and the 10-year yield near 3.0%. Higher yields tighten financial conditions at a time when growth is already weak.
The key event this week is the ECB meeting on Thursday, June 11. Markets expect a 25-basis-point rate hike, likely taking the deposit rate to 2.25%. The bigger issue is whether the ECB frames the move as a one-off inflation-control step or signals more tightening. Inflation supports a cautious hawkish stance, with headline inflation at 3.2% and core inflation at 2.5%, both above the ECB’s 2% target.
Overall, the Eurozone faces weak growth, sticky inflation, and rising policy tension. Investors should remain selective, focusing on defensive sectors, pricing power, and companies less exposed to rate-sensitive demand.
EURUSD Technical analysis
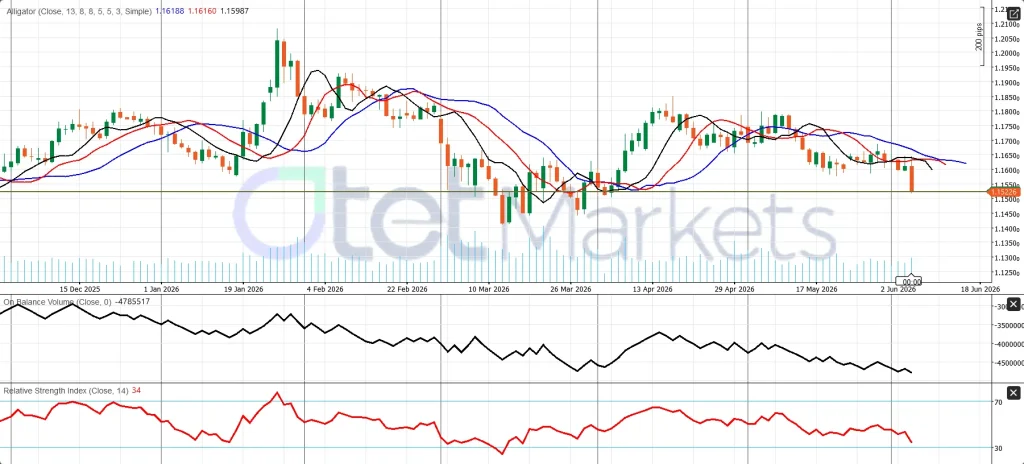
The daily EUR/USD chart has clearly become weaker. Price is trading around 1.15226, well below the full Alligator cluster, with the slower lines grouped near 1.1599–1.1619. That structure tells me the broader daily trend has shifted back in favor of sellers, and the latest downside move is not just noise inside a range.
From a price-action perspective, the pair has now slipped under the important 1.1550 area and is pressing the lower edge of the recent range. As long as EUR/USD stays below 1.1599–1.1619, rallies still look corrective rather than trend-changing. The first support now sits around 1.1500, and a daily break below that area would expose the next downside zone near 1.1450. On the upside, the first recovery barrier is 1.1550, while the more important resistance remains the Alligator cluster near 1.1600–1.1620.
The secondary indicators confirm the softer tone. On-Balance Volume remains deeply negative and still trends lower, which shows that the broader move has not been backed by fresh accumulation. RSI is near 34, which means downside momentum is already stretched, but it is not yet a reversal signal by itself. In practical terms, this is a bearish daily chart with rebound risk, not a bullish setup.
Gold Outlook: Strong U.S. Data Turns Gold into a Rate-Sensitive Trade
Gold enters the week of June 8–14, 2026 under pressure after stronger U.S. labor data, rising Treasury yields, and a firmer U.S. dollar broke the recent precious-metals momentum. Earlier in the week, gold was supported by Middle East tensions, U.S.-Iran uncertainty, and restrictions around the Strait of Hormuz. However, by Friday, the market’s focus had shifted from safe-haven demand to Federal Reserve policy risk.
The main trigger was the May U.S. jobs report. Non-farm payrolls rose by 172,000, far above the 85,000 forecasts, while unemployment stayed at 4.3%. Wage growth also remained firm at 0.3% month-on-month. For gold, this was negative because a resilient labor market reduces the case for rate cuts and increases the chance that the Fed may keep policy restrictive or even raise rates later in 2026.
Treasury yields reacted sharply. The 2-year yield rose to 4.115%, while the 10-year yield climbed to 4.53%. Meanwhile, the U.S. Dollar Index jumped to 100.06, its highest level since early April. This combination is bearish for gold because the metal does not pay yield, making it less attractive when real-yield expectations and dollar strength rise.
Gold sold off heavily on Friday. Spot gold fell 3.3% to $4,325.96/oz, while gold futures dropped 3.4% to $4,352.57/oz. Silver also weakened, falling to around $72.63/oz and losing about 3.5% for the week. Silver faced additional pressure from weaker risk sentiment because of its industrial-demand exposure.
The key event this week is U.S. CPI on Wednesday, June 10. A hotter inflation point could lift yields and the dollar further, pushing gold toward lower support. U.S. PPI on Thursday, June 11, jobless claims, Treasury auctions, and University of Michigan inflation expectations will also shape direction.
Overall, the base case is neutral-to-bearish. Unless U.S. inflation data weaken enough to pull yields lower, gold may struggle to rebuild bullish momentum.
XAUUSD Technical analysis
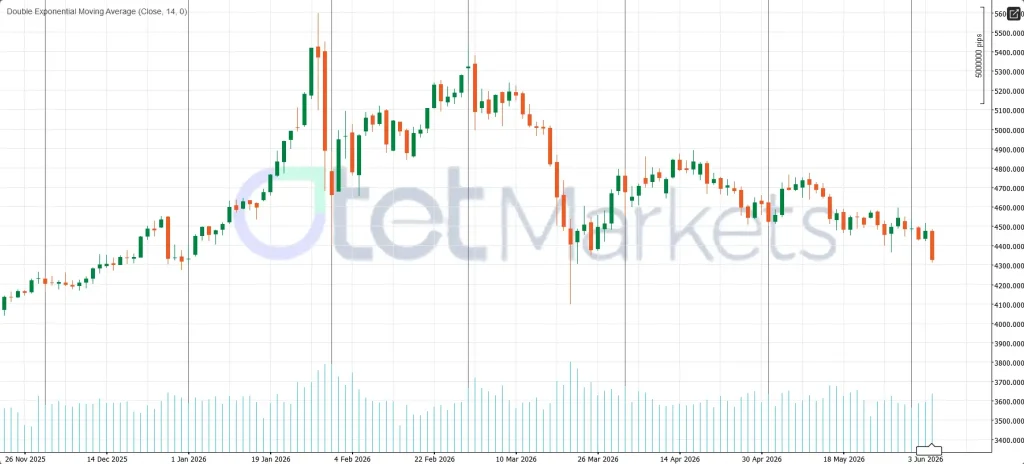
The daily XAU/USD chart remains weak. Prices are trading near the lower end of the recent range and continue to print a sequence of lower highs and lower lows from the March peak. The market is also trading below the 14-day double exponential moving average, which keeps the short-term trend tilted to the downside rather than signaling a recovery.
Technically, the first key support is the 4,300–4,320 area, which is now the immediate floor on the chart. A daily closer closure below that zone would expose the next downside area near 4,200, while a deeper extension could open the way toward 4,100. On the upside, the first recovery barrier is around 4,450, followed by a stronger resistance zone in the 4,550–4,600 area. As long as price stays below that resistance band, rebounds still look corrective rather than trend changing.
The broader reading from the chart is straightforward: upside momentum has faded, and recent candles show that buyers have not been able to build a stable base. This is not yet a capitulation structure, but it is a clearly defensive chart.
Energy Market Outlook: Oil Holds a Supply-Risk Premium as Middle East Tensions Stay Active
The energy market enters the week of June 8–14, 2026 with a neutral-to-bullish but volatile structure. Crude prices pulled back on Friday after operations at a key port in Oman returned to normal, but the broader weekly trend remained supported. Both major benchmarks snapped a two-week losing streak, helped by Middle East tensions, restricted energy flows through the Persian Gulf, tight refined product inventories, and strong U.S. crude exports.
Brent crude futures fell 2.3% on Friday to settle at $92.89 per barrel, while WTI dropped 3.0% to $90.25 per barrel. Despite the decline, Brent gained 0.9% for the week and WTI rose 3.2%. This shows that oil is not moving in a straight bullish line, but dips are still being supported by geopolitical risk and tight physical supply.
The main driver remains the Middle East conflict. Hezbollah rejected the U.S.-brokered Israel-Lebanon ceasefire framework, reducing hopes for a quick diplomatic breakthrough between Washington and Tehran. At the same time, the Strait of Hormuz remains effectively restricted, keeping global energy flows through the Persian Gulf under pressure. Any progress in U.S.-Iran talks or a reopening path for Hormuz could push prices lower, while renewed strikes or tanker disruption could trigger another rally.
The physical market also remains tight. U.S. crude inventories fell by around 8 million barrels, far larger than expectations for a 3-million-barrel draw. U.S. crude exports rose to 5.9 million barrels per day, as Europe and Asia searched for alternative supplies. Refined product inventories, especially diesel, gasoline, and residual fuel, remain near historical lows, keeping refinery margins elevated.
China is another key factor. Chinese crude imports fell by around 4.3 million barrels per day between February and May, while IEA emergency reserve releases have helped ease supply stress. If those releases end by late July, the market could tighten again.
This week, traders will focus on the EIA Short-Term Energy Outlook on June 9, the EIA Weekly Petroleum Status Report on June 10, and U.S. CPI and PPI data. Technically, Brent support sits at $90–$91, with resistance at $95–$96 and $98–$100. WTI support is $88–$90, with resistance near $93–$94 and $96–$98.
Overall, oil remains supported on dips while Hormuz restrictions, inventory draws, and Middle East uncertainty remain active.
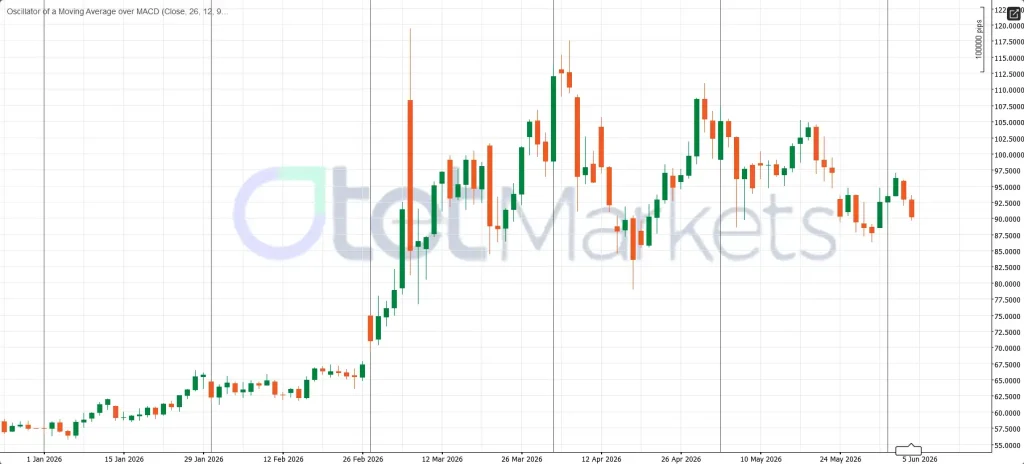
WTI technical analysis
The daily WTI chart shows a market that has lost its earlier upside drive and is now trading in a softer corrective structure. After the sharp rally into the March-April high zone, price failed to sustain follow-through and have since produced a sequence of lower highs. The latest candles also show renewed downside pressure, with crude slipping back toward the lower part of the recent range.
Technically, the immediate pivot sits around 90.00–92.00. As long as WTI remains below the 95.00–97.00 resistance band, the chart keeps a bearish bias. The first support zone is near 88.00, and a clean daily break below that area would expose 85.00 next. If sellers extend control further, the broader downside zone comes in around 82.00. On the upside, bulls would need to reclaim 95.00 first and then break above 97.00 to weaken the current bearish structure.
The momentum backdrop also looks soft. The MACD-based oscillator remains slightly negative on the chart, which suggests that rebound attempts are losing strength rather than building a fresh upside impulse. In practical terms, this is a daily chart where rallies still look corrective, not trend-reversing.
Crypto Market Outlook: Bitcoin Defends $60,000 as ETF Outflows Pressure Sentiment
The crypto market enters the week of June 8–14, 2026 in a defensive position after one of its weakest weekly performances in months. Bitcoin briefly broke below the key $60,000 level, touched its lowest point since October 2024, and headed for a weekly loss of more than 16%. The selloff was driven by several forces at once: heavy ETF outflows, stronger U.S. rate-hike expectations, a firmer U.S. dollar, Strategy’s rare Bitcoin sale, geopolitical uncertainty, and capital rotation from crypto into AI-linked equities.
Bitcoin was last down 2.4% on Friday at $61,749.7, after hitting an intraday low of $59,159.3. The break below $60,000 was important because it damaged both psychological and technical sentiment. It showed that buyers are no longer defending major support levels with the same strength seen earlier in the cycle.
The biggest pressure remains spot Bitcoin ETF flows. Bitcoin ETFs recorded around $1.4 billion in outflows during the week, marking the fourth straight week of more than $1 billion in withdrawals. This signals that institutional investors are not just taking profit but actively reducing exposure. Until ETF outflows slowly, Bitcoin rallies may remain vulnerable.
Strategy’s first Bitcoin sale since late 2022 also hurt confidence. Although the sale was small, it raised questions about corporate Bitcoin treasury models, especially because Bitcoin does not generate yield or cash flow. At the same time, the stronger U.S. jobs report increased expectations that the Federal Reserve may raise rates later in 2026, pushing Treasury yields and the dollar higher. This is negative for crypto because Bitcoin and altcoins are non-yielding risk assets.
Altcoins performed even worse. Ethereum fell 8.3% to $1,615.74, hit a 14-month low, and lost around 20% for the week. XRP dropped more than 15%, while Solana, Cardano, BNB, Dogecoin, and $TRUMP also declined sharply.
The base case is bearish-to-neutral, with Bitcoin likely trading between $59,000 and $65,000 unless U.S. inflation data cool, ETF outflows slow, and demand improves.
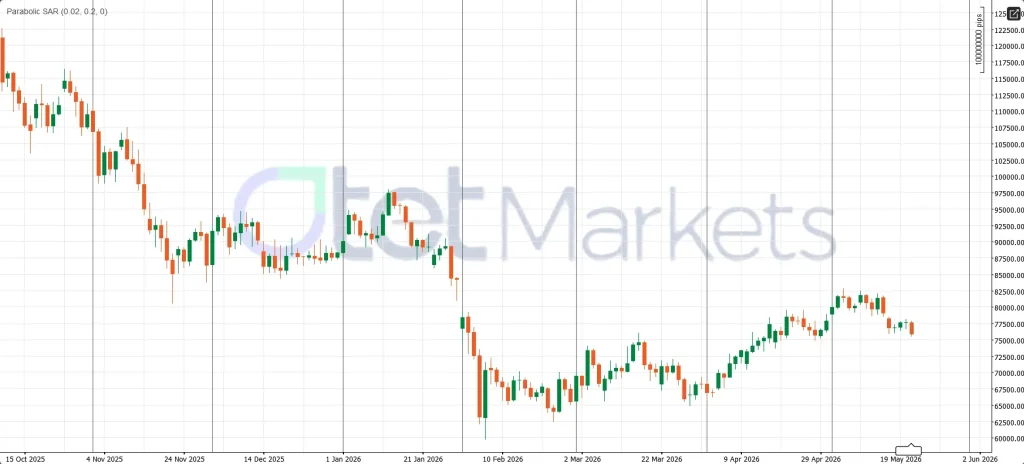
BTC USD Technical analysis
The daily BTC/USD chart remains technically weak. Price is trading around 75,885.50, while the Parabolic SAR stays above price, which keeps the short-term trend tilted to the downside. The latest structure shows that Bitcoin failed to hold the rebound toward the 80,000–82,000 zone and has started to print lower highs again.
From a price-action perspective, the first key support is 75,500. A confirmed daily break below that level would expose the next downside zone near 72,500, followed by the broader support area around 68,500. On the upside, the first recovery barrier is 78,500, while the more important resistance remains in the 80,000–82,000 region. As long as BTC/USD stays below that resistance band, rebounds still look corrective rather than trend changing.
Volume confirmation is not strong enough to support a bullish reversal. The On-Balance Volume line has softened from its recent highs, which suggests participation has weakened during the latest pullback. In practical terms, this is still a defensive daily chart.
Share
Hot topics
What Is a Breakout Trading Strategy and How to Trade It?
If you have ever observed a price move quietly for some time and then suddenly move in a particular direction, you have already seen a breakout in action. Breakouts can...
Read more


Submit comment
Your email address will not be published. Required fields are marked *