
U.S. Producer Price Growth Eases but Energy Surge Lifts Annual Inflation
Energy Costs Drive Annual PPI Increase
U.S. producer prices for final demand rose 4.0% in the twelve months to March, up from 3.4% in February, according to Labor Department data. Economists had expected a 4.6% annual increase. The advance was mainly attributed to a 1.6% rise in the index for final demand goods, the largest gain since August 2023.
Energy was the key driver, with prices for final demand energy jumping 8.5%. Gasoline prices increased by 15.7%, while the indexes for diesel fuel, jet fuel, home heating oil, meats, and primary basic organic chemicals also moved higher. Crude prices were last trading below $100 per barrel but remained well above pre-war levels.
By contrast, prices for services were reported as steady in March, helping to limit the overall acceleration in producer price growth.
Monthly and Core Readings Come in Below Forecasts
On a month-on-month basis, the PPI for final demand increased 0.5% in March, matching February’s rate and coming in below projections for a 1.1% rise. The report pointed to potentially significant gains in inflation indicators closely watched by the Federal Reserve, even as the headline outcome undercut expectations.
Core producer prices, which exclude food and energy, showed a more moderate trend. Core PPI rose 0.1% over the month in March 2026, the smallest increase in four months, following a revised 0.3% gain in February and below market forecasts of a 0.5% advance. On an annual basis, core producer prices increased 3.8% in March, unchanged from February’s revised reading and below expectations for a 4.1% rise.
Stephen Brown, Chief North America Economist at Capital Economics, said the downside surprise in core producer prices “offers some encouragement for the Fed that pipeline inflation pressures are not spiralling out of control” after several strong months of data.
Expectations for substantial interest rate cuts by the Federal Reserve this year have eased as the sharp rise in oil prices has heightened concerns about renewed inflation pressures, despite the softer-than-anticipated core producer price readings.
FAQ
What is the main factor behind the rise in U.S. producer prices in March?
The main factor was a sharp increase in energy costs, including an 8.5% rise in final demand energy prices and a 15.7% jump in gasoline prices, linked to the impact of the Iran war on oil markets.
How did the March PPI figures compare with economists’ expectations?
Annual PPI rose 4.0%, below the 4.6% expected, while the monthly increase of 0.5% also came in weaker than projections for a 1.1% gain.
What happened to core producer prices excluding food and energy?
Core producer prices rose 0.1% month-on-month in March 2026, the smallest increase in four months, and 3.8% year-on-year, both below market forecasts.
How might these data affect views on Federal Reserve policy?
The weaker core PPI figures provide some indication that underlying pipeline inflation pressures may be stabilizing, but elevated energy prices have reduced expectations for large interest rate cuts by the Federal Reserve this year.
Share
Hot topics
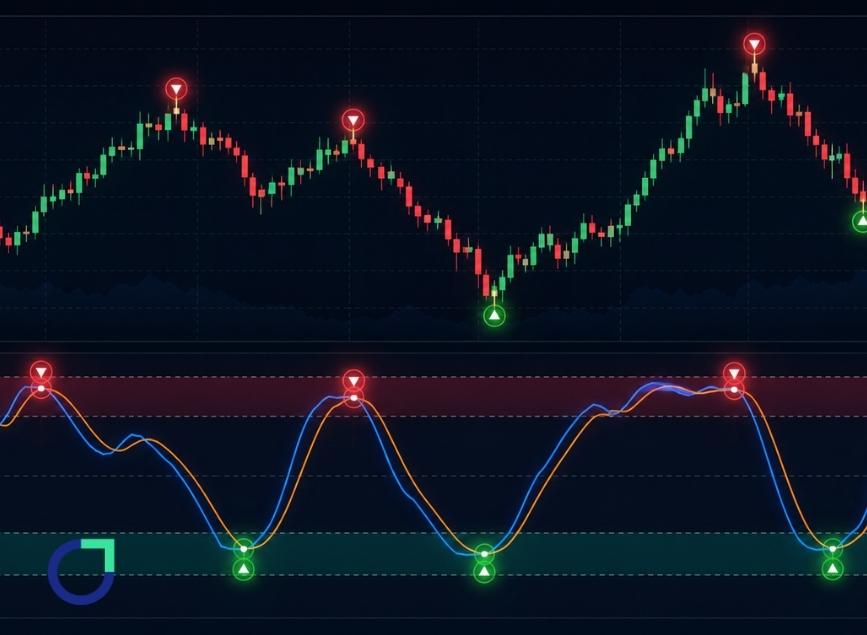
What Is the Stochastic Indicator and How Does It Generate Signals?
Financial markets move through changing momentum patterns that influence how prices rise and fall. In the case of an asset’s upward price movement, trading volume usually decreases before the price...
Read more


Submit comment
Your email address will not be published. Required fields are marked *