
Global Markets Enter a Fed-Sensitive WeekAuto
The global economy enters May 25–30, 2026 in a Neutral-to-Defensive condition as investors watch inflation, growth, energy prices, and geopolitical risk.
The main event is the U.S. data package on Thursday, May 28, including PCE inflation, Core PCE, personal income, spending, and Q1 GDP. A hot PCE print could strengthen the U.S. dollar, lift Treasury yields, and pressure Wall Street, gold, crypto, and emerging markets. A softer print could support risk assets and weaken the dollar.
Europe remains under stagflation pressure. Weak activity, higher energy costs, and upcoming German and French inflation data will test whether the ECB faces more pressure to stay hawkish.
China remains a weak-demand story, with markets focused on whether industrial profits confirm stress in corporate margins. Japan will also be watched through inflation, retail sales, unemployment, and industrial production data.
U.S. Economy Weekly Review: Resilient Growth Meets Inflation Risk
The U.S. economy ended the week with a resilient but more inflation-sensitive profile. Growth indicators remained firm, financial markets recovered, and corporate earnings continued to support risk appetite. However, the macro-outlook became more complicated as Middle East tensions, high oil prices, rising inflation expectations, and a more hawkish Federal Reserve narrative reshaped market expectations.
The strongest signal came from growth and business activity. The Atlanta Fed GDPNow estimate for Q2 rose to 4.3%, up from 4.0%, showing that near-term economic momentum remains solid. The S&P Global Manufacturing PMI improved to 55.3, beating expectations and pointing to stronger factory activity. The Composite PMI stayed in expansion at 51.7, while the Services PMI softened to 50.9 but avoided contraction. This suggests the economy is slowing in some areas but not breaking.
Regional manufacturing was weaker. The Philadelphia Fed Manufacturing Index dropped to -0.4, while the Kansas City Fed Manufacturing Index eased to 9 from 10. These numbers show that industrial activity remains uneven, even though the broader national data still looks stable.
The labor market continued to support the economy. Initial jobless claims fell to 209K, the four-week average declined to 202.5K, and continuing claims rose only slightly to 1.782M. This confirms that employment conditions remain strong enough to support consumption and reduce near-term recession risk.
Housing data was mixed but not weak. Building permits rose to 1.442M, with permits up 5.8% MoM, while housing starts reached 1.465M despite a 2.8% monthly decline. Still, higher Treasury yields remain a clear risk for housing demand.
The main warning came from inflation expectations and consumer sentiment. The University of Michigan Consumer Sentiment Index fell to 44.8, while 1-year inflation expectations climbed to 4.8% and 5-year expectations rose to 3.9%. This is important because higher long-term inflation expectations can force the Fed to stay restrictive for longer.
Markets are now pricing a 25-basis-point Fed rate hike by year-end. The U.S. Dollar Index held near 99.24, close to a six-week high, while equities still performed well. The S&P 500 gained 0.9%, the Nasdaq rose 0.5%, and the Dow climbed 2.1% to a record 50,579.70.
U.S. Weekly Economic Outlook: Inflation, GDP, and the Consumer Take Center Stage
The U.S. economy enters the week of May 25–30 with a clear macro tension: growth is still holding, but inflation pressure, high energy costs, weak consumer sentiment, and “higher-for-longer” Federal Reserve expectations remain the dominant market drivers. The week begins quietly because of the Memorial Day holiday on Monday, May 25, when U.S. equity and bond markets are closed and no major economic data are scheduled.
The main event arrives on Thursday, May 28, when markets receive a heavy U.S. data package: April PCE inflation, Core PCE, personal income and spending, the Q1 GDP second estimate, durable goods orders, weekly jobless claims, and new home sales. This session matters because it combines inflation, growth, consumption, housing, and labor-market signals in one day.
The most important release is PCE inflation, the Fed’s preferred inflation gauge. Markets will watch whether April inflation confirms renewed pressure from energy prices and whether core inflation remains too sticky for the Fed to turn dovish. Forecasts cited from BofA point to headline PCE at 0.4% MoM and 3.8% YoY, while Core PCE is expected at 0.3% MoM and 3.3% YoY. Both remain above the Fed’s 2% target, keeping policy risk tilted hawkish.
Consumer spending is another key focus. Control group retail sales rose 0.5% in April, suggesting goods spending entered Q2 with some momentum. However, higher prices are eroding purchasing power, while the Iran conflict has kept energy costs elevated. Personal income is expected to rise 0.4%, but if the PCE deflator also rises 0.4%, real income growth may stay weak.
Housing will also matter. New home sales rose to 682K in March, up 3.3% YoY, but April sales are expected to fall to 669K as mortgage rates hover near 6.5% and affordability remains stretched.
My base case is resilience with rising stagflation risk. A hot PCE print and firm spending would support the U.S. dollar and Treasury yields, but pressure Wall Street, gold, and rate-sensitive sectors. Softer inflation with stable spending could improve risk appetite.
USD and Wall Street Weekly Outlook: PCE Will Test the Rally
The U.S. dollar and Wall Street enter the week of May 25–30 with strong momentum, but Thursday’s inflation and growth data could decide whether recent trends continue or reverse. The dollar remains supported by higher rate expectations, elevated Treasury yields, and inflation risk, while equities remain constructive after another strong weekly performance. However, after an eight-week rally in the S&P 500 and a record Dow close, stock-market risk-reward is becoming more fragile.
The U.S. Dollar Index held near 99.24, close to a six-week high. Its resilience was important because equities also improved, a setup that usually reduces safe-haven dollar demand. This time, the Federal Reserve story kept the dollar supported. The April Fed minutes showed that many policymakers could support rate hikes if inflation remains above the 2% target, and markets are now pricing a 25-basis-point hike by year-end.
Wall Street also finished the week strongly. The S&P 500 rose 0.9% for the week, the Nasdaq gained 0.5%, and the Dow outperformed with a 2.1% rise, closing at a record 50,579.70. The S&P 500 posted its eighth straight weekly gain, while Wall Street has climbed around 17% during the rally. Lower oil, softer yields late in the week, strong earnings, and optimism around U.S.-Iran talks supported sentiment.
Corporate earnings helped, especially Nvidia’s strong results and guidance, which confirmed powerful AI infrastructure demand. Still, valuation concerns above the $5 trillion market-cap area limited enthusiasm.
The key event is Thursday, May 28, when the U.S. releases PCE inflation, Core PCE, GDP, income, spending, durable goods, jobless claims, and housing data. My outlook is USD Neutral-to-Buy and Wall Street constructive but vulnerable. A hot PCE print could lift the dollar and yields, while softer inflation could support equities.
USD Technical Analysis
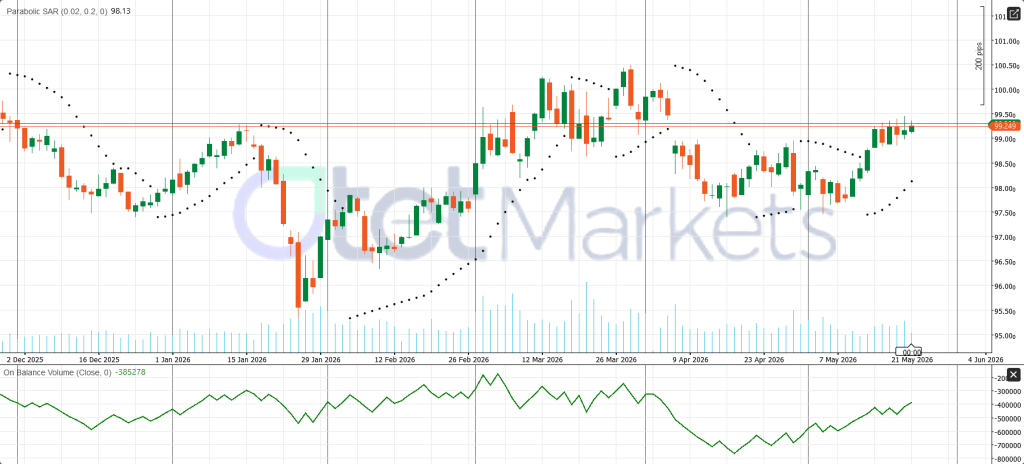
The daily U.S. Dollar Index (DXY) is showing a stronger recovery structure, with price near 99.249 and the Parabolic SAR around 98.13 below price, confirming short-term buyer control. The index has moved back into the upper range, but the key breakout level remains 99.50. A daily close above that zone could open the way toward 100.00 and 100.50. Support sits near 98.80, with the deeper technical floor at 98.13. On-Balance Volume is also improving, suggesting weaker selling pressure. Overall, DXY is constructive, but confirmation still depends on a break above 99.50 in daily trading.
S&P 500 Technical analysis
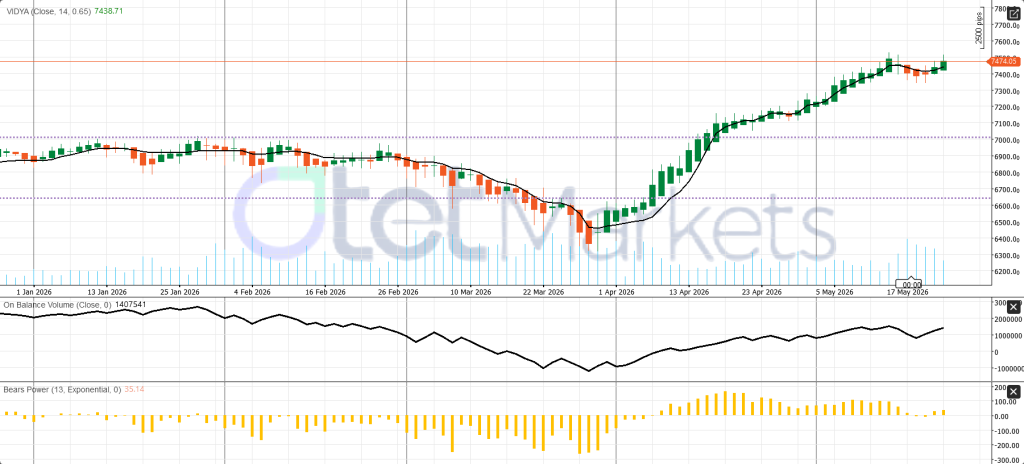
The daily S&P 500 / US500 chart remains constructive, with price near 7,474.05, slightly above the VIDYA line at 7,438.71. This confirms that the medium-term trend is still bullish. The key issue is extension, not direction. Bulls remain in control while price holds above the 7,438–7,440 support zone. A clean daily breakout above 7,474 could open the way toward 7,550 and 7,650. On the downside, support sits near 7,200, then 6,650. OBV remains positive, while Bears Power near 35.14 shows buyers still control momentum.
EU Weekly Review: Weak PMIs Keep Europe in a Fragile Growth Position
The EU economy ended the week with a weaker growth profile, as fresh data showed fading private-sector momentum, deeper services contraction, softer external-account support, and fragile business confidence. European equities performed better than the macro picture suggested, supported by AI-linked technology strength and optimism around U.S.-Iran diplomacy. This created a clear divide between weak economic fundamentals and more constructive market sentiment.
The most important warning came from eurozone PMI data. Manufacturing PMI slipped to 51.4, below the 51.7 forecast and down from 52.2, but it still stayed above the 50-expansion line. The bigger concern was services. Services PMI dropped to 46.4, below the 47.8 forecast and previous 47.6, while Composite PMI fell to 47.5. This confirms that eurozone private-sector activity is contracting, with services leading to the slowdown.
Germany looked more stable than the broader eurozone, but still not strong. Q1 GDP rose 0.3% QoQ and 0.4% YoY, while the GfK Consumer Climate Index improved to -29.8 and the Ifo Business Climate Index increased to 84.9. However, German PMI data remained weak, with manufacturing at 49.9, services at 47.8, and the composite index at 48.6, keeping Germany in contraction territory.
France delivered the weakest signal. Manufacturing PMI fell to 48.9, Services PMI collapsed to 42.9, and the Composite PMI dropped to 43.5, showing a deep private-sector contraction.
The eurozone’s external position also weakened. The current account surplus fell to 14.9B, far below the 26.3B forecast and was down from 25.6B. This reduces traditional support for the euro at a time of weak demand, high energy risk, and geopolitical uncertainty.
There were limited positives. Construction output rose 0.78% MoM, labor costs stayed at 3.30% YoY, and consumer confidence improved to -19.0. Still, sentiment remains negative.
Overall, the EU economy looks fragile and growth negative. The euro remains Neutral-to-Sell, while European equities are Neutral, with upside depending mainly on lower oil prices and credible U.S.-Iran peace progress.
Europe Weekly Outlook: Stagflation Risk Takes Control
The EU and euro area enter the week of May 25–30 in a Neutral-to-Defensive macro condition. The main story is no longer just weak growth. Europe now faces a more difficult mix of energy-driven inflation, softer demand, weak business activity, fragile consumer confidence, and a more complicated ECB policy path. This is why stagflation risk has become the central market theme.
The latest outlook is uncomfortable. EU officials have warned that Europe is facing a stagflationary trend after the energy-price shock linked to the Iran war. At the same time, the European Commission expects euro area growth to slow to 0.9% in 2026, while inflation is projected to rise to 3.0%, above the ECB’s 2% target. This mix pressures purchasing power, corporate margins, investor confidence, and policy flexibility.
Business activity already shows strain. The Flash Euro Zone Composite PMI fell to 47.5 in May, its weakest level since October 2023 and clearly below the 50-expansion line. Services activity contracted at the sharpest pace since February 2021, while new orders weakened and cost pressures increased. Because Europe is more exposed than the U.S. to imported energy shocks, high oil and gas prices can quickly spread into transport, production costs, food prices, and household spending.
This creates a hard choice for the ECB. Inflation risk argues for tighter policy, but weak growth argues for caution. On April 30, the ECB kept the deposit rate at 2.00%, the main refinancing rate at 2.15%, and the marginal lending rate at 2.40%.
The key data points this week are sentiment and inflation. Wednesday brings the EU and euro area Economic Sentiment Indicator, after April’s EU ESI fell to 93.5 and the euro area ESI to 93.0, both below the long-term average of 100. Friday is Europe’s main inflation test, with Germany and France releasing preliminary May CPI and HICP data.
For markets, EUR remains mixed. Higher inflation may support the euro through hawkish ECB pricing, but weak PMIs and recession risk limit upside. European equities remain defensive, while Bund yields could rise if German and French inflation surprise higher.
EUR/USD Technical Outlook: Compressed and Fragile
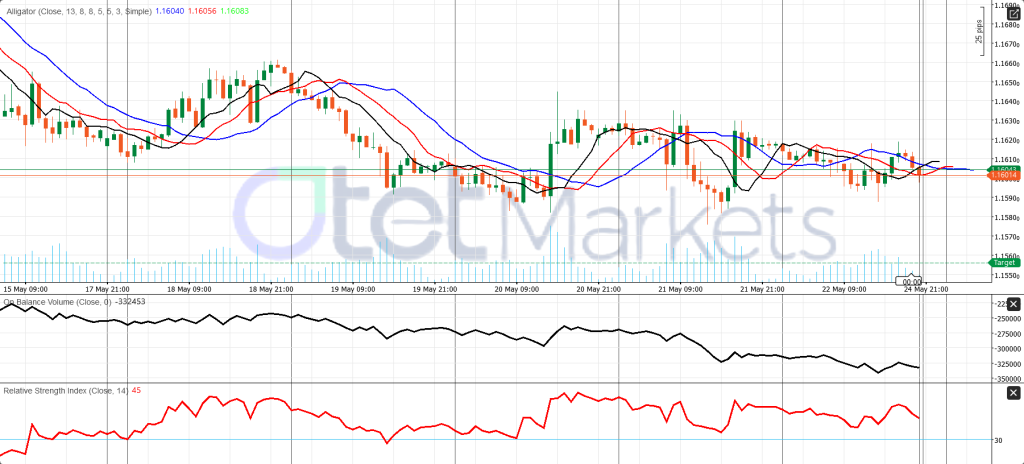
EUR/USD is trading near 1.16014, inside a tightly compressed Alligator structure, with the jaw at 1.16040, teeth at 1.16056, and lips at 1.16083. This signals weak directional momentum and a possible breakout decision ahead. The bias is slightly negative because price remains below the faster Alligator lines and has failed to clear 1.1610–1.1615. Resistance sits at 1.1608–1.1615, then 1.1625–1.1630. Support is at 1.1600, 1.1585, and 1.1560. Negative OBV and RSI near 45 confirm weak bullish momentum. Sell weakness unless price holds above 1.1615.
Gold Weekly Outlook: PCE Inflation Is the Key Test for XAU/USD
Gold enters the week of May 25–30 in a Neutral-to-Defensive condition. The market is caught between geopolitical safe-haven demand and rising rate-hike pressure. The broader bullish structure is not fully broken, but short-term momentum has weakened because the U.S. dollar remains firm, Treasury yields are elevated, and sticky inflation expectations are keeping the Federal Reserve outlook hawkish.
Spot gold ended the previous week near $4,509.12/oz, down 0.8% on Friday and heading for a 0.7% weekly loss. Gold futures also fell 0.7% to around $4,510.70/oz, moving toward a 1.1% weekly decline. This was not a major bearish breakdown, but it showed that gold struggled to attract strong upside even while the U.S.-Iran conflict remained unresolved.
The main pressure came from interest-rate expectations. The Fed’s April minutes showed that more policymakers were open to rate hikes if inflation stayed above the 2% target. At the same time, U.S. inflation expectations rose, with the University of Michigan’s 1-year inflation expectation at 4.8% and the 5-year expectation at 3.9%.
Real yields were the strongest headwind. The U.S. 10-year TIPS auction yield rose to 2.169% from 1.896%, increasing the opportunity cost of holding gold. The Dollar Index was near 99.24 also pressured XAU/USD.
Technically, gold is correcting, not collapsing. Key support sits at $4,480–$4,500/oz. A sustained break below this zone could trigger deeper profit-taking. On the upside, gold needs to reclaim $4,560–$4,600/oz to rebuild bullish momentum.
The key event is Thursday, May 28, when the U.S. releases PCE inflation, Core PCE, income, spending, GDP, durable goods, jobless claims, and new home sales. A hot Core PCE print with strong spending would likely pressure gold. Softer inflation with stable spending could support a recovery toward $4,560–$4,600.
XAU/USD Technical Outlook: Weak but Trying to Stabilize
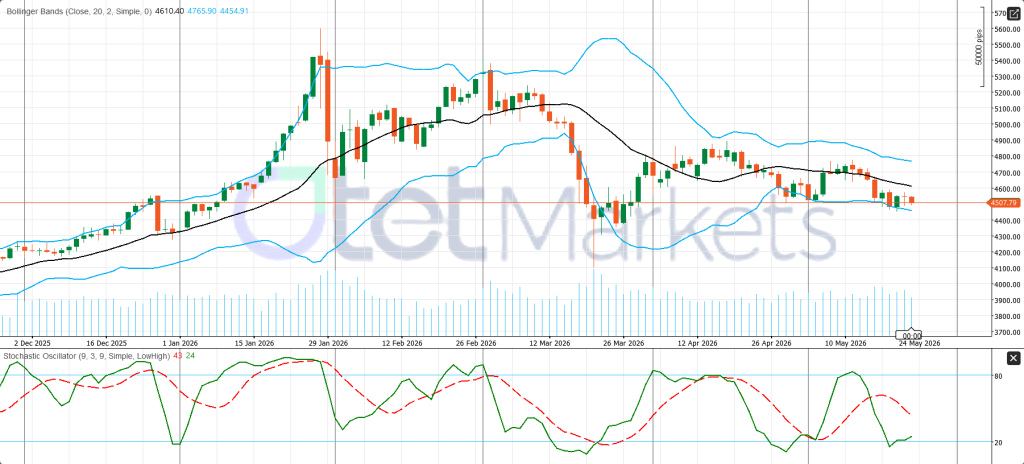
The daily XAU/USD chart remains under pressure, with price near 4,507.79, below the Bollinger middle band at 4,610.40. Gold is trading in the lower half of its volatility range, keeping the short-term bias negative. Immediate support is the lower Bollinger band at 4,454.91; a daily break below it could expose 4,400. Resistance remains at 4,610.40, then 4,765.90. The stochastic near 43/24 shows a rebound attempt, but as long as price stays below the mid-band, the move looks corrective, not a bullish reversal.
WTI Weekly Outlook: Oil Stays Supported by Hormuz Risk
The energy market enters the week of May 25–30 in a Neutral-to-Buy condition, with oil still trading more like a geopolitical asset than a normal demand-and-supply commodity. The main driver remains the U.S.-Iran conflict, the status of the Strait of Hormuz, and whether diplomacy can reduce or extend the current oil-risk premium. WTI remains supported by tight global supply, falling inventories, and Persian Gulf risk, but the upside is not clean because traders are also watching peace headlines, demand concerns, and Thursday’s heavy U.S. macro calendar.
By late Friday, Brent traded near $103.20 per barrel, up 0.6% on the day, while WTI traded around $96.28, down 0.1%. Despite the late-week stabilization, both contracts were heading for sharp weekly losses. Brent was on track to fall nearly 6%, while WTI was set for a weekly decline of almost 9%. This shows that traders removed part of the geopolitical premium as U.S.-Iran peace hopes improved.
The key development was reported ship movement through Hormuz. Iran’s state media said 35 merchant vessels, including tankers and container ships, passed safely through the strait over 24 hours under Iranian supervision. Earlier, 26 ships reportedly crossed the route. Since around one-fifth of global oil and gas flows through Hormuz, any sign of restored transit immediately reduces extreme supply-disruption fears.
Still, this is not full normalization. Hormuz traffic remains below pre-war levels, and Iran’s permit and toll system keeps uncertainty high. Oil is pricing a controlled and politically sensitive transit regime, not a normal supply environment.
The inventory picture remains supportive. U.S. crude inventories showed a large weekly drawdown, helped by stronger exports. However, geopolitics dominated the inventory signal. U.S. supply data were mildly bearish, with the oil rig count rising to 425 and the total rig count increasing to 558.
WTI Technical Outlook: Elevated but Losing Momentum
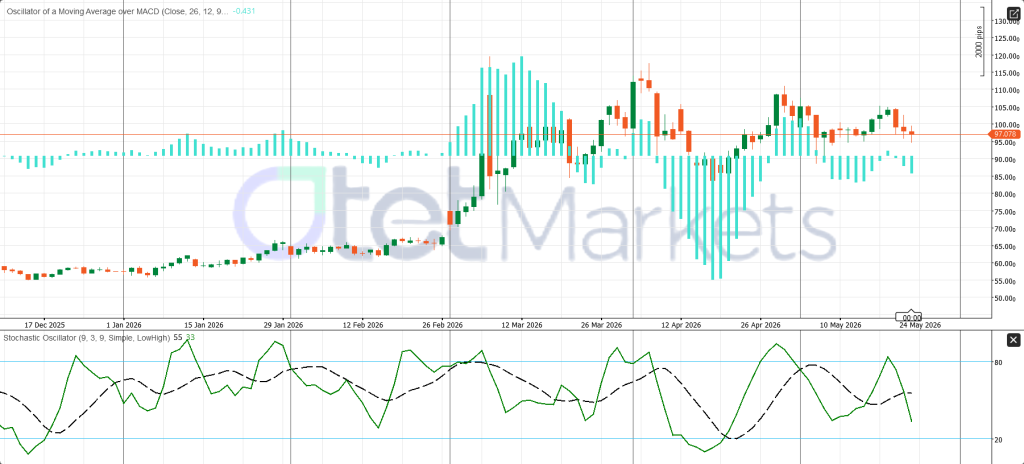
The daily WTI chart remains elevated, but short-term momentum has weakened. Price is trading near 97.078, while the MACD-based oscillator is slightly negative at -0.431, showing fading upside pressure. The key pivot is $97.00, but WTI needs a clean break above $100.00 to turn technically constructive again. Below $100, the chart remains in a corrective range with mild downside bias. Support sits at $95.00, then $90.00–$91.00 if selling deepens. Resistance is $100.00, $105.00, and $110.00. Stochastic near 55/53 confirms neutral but softening momentum.
Crypto Weekly Outlook: Bitcoin Needs $80,000 to Rebuild Confidence
The crypto market enters the week of May 25–30 in a Neutral-to-Defensive condition. Bitcoin remains the main stabilizer for the broader digital-asset market, but short-term momentum has weakened after failing to hold above the $80,000–$82,000 resistance zone.
The previous week ended in fragile stabilization. Bitcoin managed to stop part of its decline, but the rebound lacked strong follow-through. The main pressure was macro-driven: elevated U.S. Treasury yields, stronger Fed rate-hike expectations, ETF outflows, and uncertainty around the U.S.-Iran conflict kept risk appetite cautious.
The clearest warning came from institutional demand. U.S. spot Bitcoin ETFs recorded $1.84 billion in outflows across six sessions after the April CPI release on May 13, ending a two-and-a-half-month inflow run that had added $4.4 billion to the ETF complex. Spot order flow also weakened, with Bitcoin seeing nine consecutive sessions of net selling from May 12 to May 20, totaling around $1.2 billion in sell aggression.
Macro conditions remain the key driver. Fed minutes showed policymakers are more willing to consider rate hikes if inflation stays above the 2% target, while markets priced in a 25-basis-point hike by year-end. Higher real yields and a firm dollar usually pressure crypto because they reduce liquidity appetite.
Altcoins remain selective and high-risk. Ethereum needs to recover above $2,150–$2,200 to reduce downside pressure. Until then, rallies may remain vulnerable to selling.
The key event is Thursday, May 28, when the U.S. releases PCE inflation, Core PCE, income, spending, GDP, durable goods, jobless claims, and new home sales. A hot Core PCE print would likely support the dollar and yields, pressuring BTC and ETH. Softer inflation could help crypto recover.
BTC/USD Technical Outlook: Momentum Turns Bearish
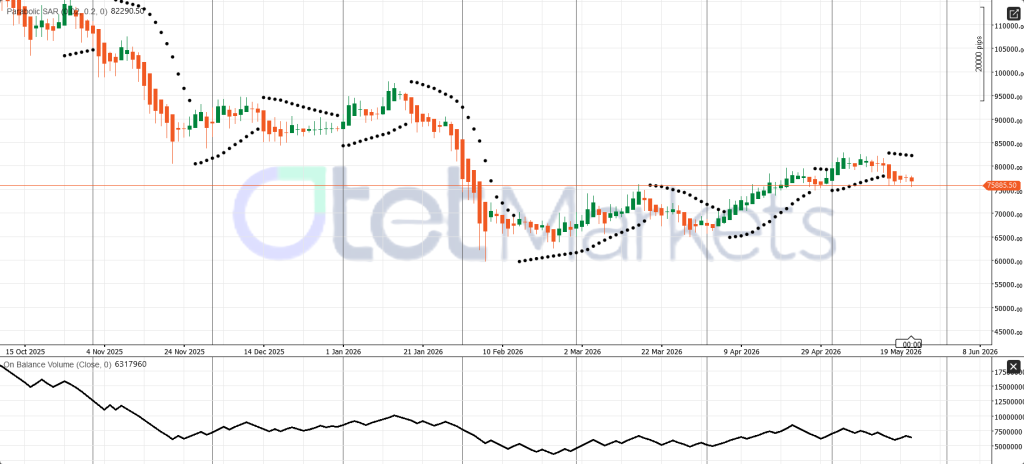
BTC/USD has lost momentum after failing to extend its recovery. Price is trading near 75,885.50, while the Parabolic SAR sits much higher at 82,290.50, confirming that short-term control has shifted back to sellers. The immediate pivot is 75,885, with key support at 75,500. A decisive break below that level could expose 72,000, then 68,500–70,000. On the upside, resistance sits near 78,500, while 82,290 remains the main trend-reversal barrier. OBV has softened but not collapsed, suggesting buyers remain present, though without strong conviction.
Share
Hot topics

STP, NDD, ECN and DMA: Broker Execution Models Decoded
When picking a forex broker, we don’t just look at the brokerage that has the lowest spreads, bonuses, and other kind of what is apparent for us. There is one...
Read more




Submit comment
Your email address will not be published. Required fields are marked *