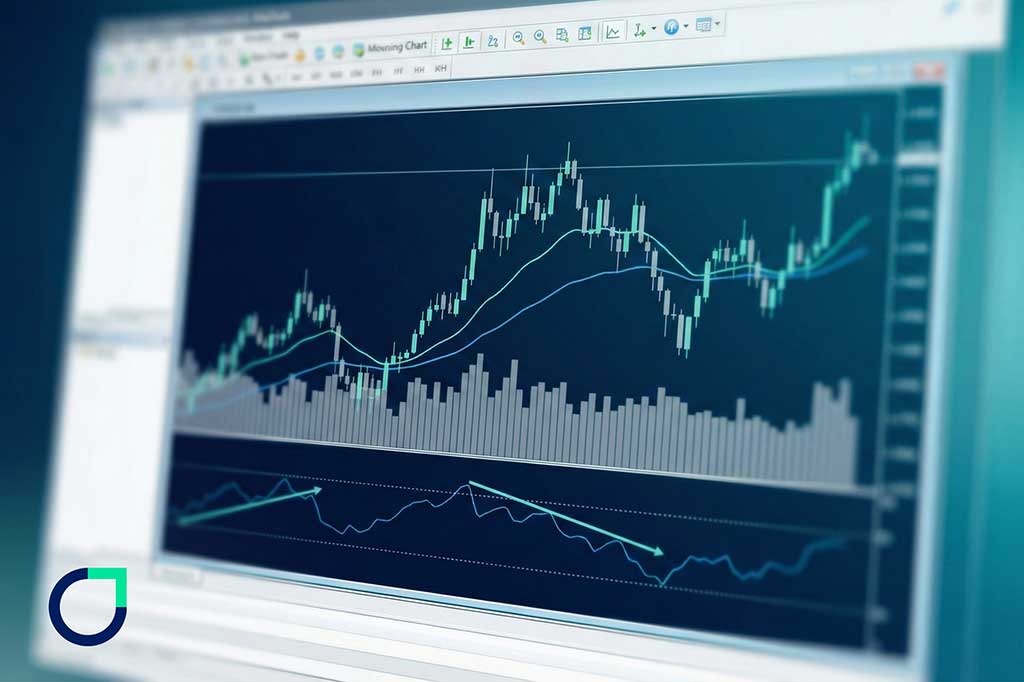
The best indicator for short term trading
When it comes to short-term trading, everything happens quickly. Movement can take place over a matter of minutes; momentum can build and fade quickly; and traders often have to make quick decisions without hesitation. If you’ve entered into a position thinking that you timed it perfectly, only to have the price reverse just a few candles later, then you understand how demanding short-term trading can be.
But here’s the good news: there’s nothing wrong with short-term trading. It just requires a different toolset than swing trading or long-term investing. You’re not trying to predict what will happen weeks from now; instead, you’re trying to capture clean and realistic price movements, while maintaining control of risk.
In this article from otet, you will be provided with a fast, efficient, and simple way to set up a short-term trade. We will also define the purpose of indicators why they are important and how you can use them to help you make your decisions.
One important point to consider before we get started: Short-term trading is primarily about getting better timing and confirmation of price movement than it is about simply having more technical signals. As a result, short-term indicators become meaningful only when they serve a specific purpose and not simply as an appealing piece of artwork.
How Short-Term Indicators Work
Indicators typically perform all of this: they are essentially calculators that sit on top of prices, taking raw data—such as price, time, volume, and/or volatility and creating a format for interpreting it.
Some analytical tools assist you in following trends; others assist you in measuring volatility or in confirming whether price issues have truly broken out. The main point here is that you need to understand what the indicator measures, not just the type of lines you get from it.
The sad reality is that you won’t have time to ‘wait for confirmation’ in lower timeframes, as long-term traders will. In short-term trading, confirmation should be fast and should have some correlation to actual short-term prices.
Price in the short-term is based on order flow, liquidity, and short bursts of momentum; therefore, any indicator that does not react quickly or smooths out too much price provides a late entry.
So how should you be thinking about indicators in fast-moving markets?
- One indicator should give you the direction (where the price is leaning right now).
- One indicator should confirm the strength (is the move supported or weak?).
- One indicator should define your risk (where is your stop, based on real volatility?).
If you are using five different trend indicators, you won’t receive five times the accuracy; you will receive five delayed messages.
This is also why traders who move from Forex to different platforms sometimes get better results when they simplify. Even on advanced setups like cTrader Accounts, the traders who last are usually the ones who keep their charts clean and their decisions consistent.
Why Traditional Indicators Often Fail in Short-Term Trading
Although traditional indicators are not inherently flawed, they are often misused in fast-moving environments.
For example, let’s take a moving average crossover. On a daily chart—using a cross-over can help traders stay in longer trends; however, on a 1-minute chart—a cross-over will produce so many directional changes that it can feel like the indicator is simply playing with you.
This occurs for many reasons:
Lag is expensive when time is short.
Most of these indicators come from past data averages. Averages smooth noise, but short-term trading is noise-heavy. The average is always behind when the price moves quickly.
Market structure changes faster intraday.
One liquidity sweep can change the whole story in short timeframes. A slow indicator might be considered still “bullish” while the market already sweeps through and reverses.
Short-term trading has more fake-outs
On lower timeframes, breakouts often fail. Again, there will be a clean break above a particular level only to return the price sharply back below that same level. Most traditional indicators will confirm this “break” after the return pushes back below.
Indicators can’t replace context.
This is the main point of this discussion. Traditional indicators tend to fail because they are used like traffic lights by traders: green means buy; red means sell. However, markets do not respect traffic lights. Instead of treating indicators like traffic lights, traders should view them as secondary confirmation tools. Price tells the main story; indicators simply support it.
If you are serious about being consistent, it would be advisable to pair indicator logic with simple price action concepts like the best candles for trading strategy (think: strong closes, rejection wicks, and definitive momentum candles). Candles do not provide magic to a trader, but they do represent behavioral patterns in a distinct way.
Therefore, this is where short-term indicators will help, if the right indicator is selected and used correctly.
The Prime Choice for Short-Term Traders
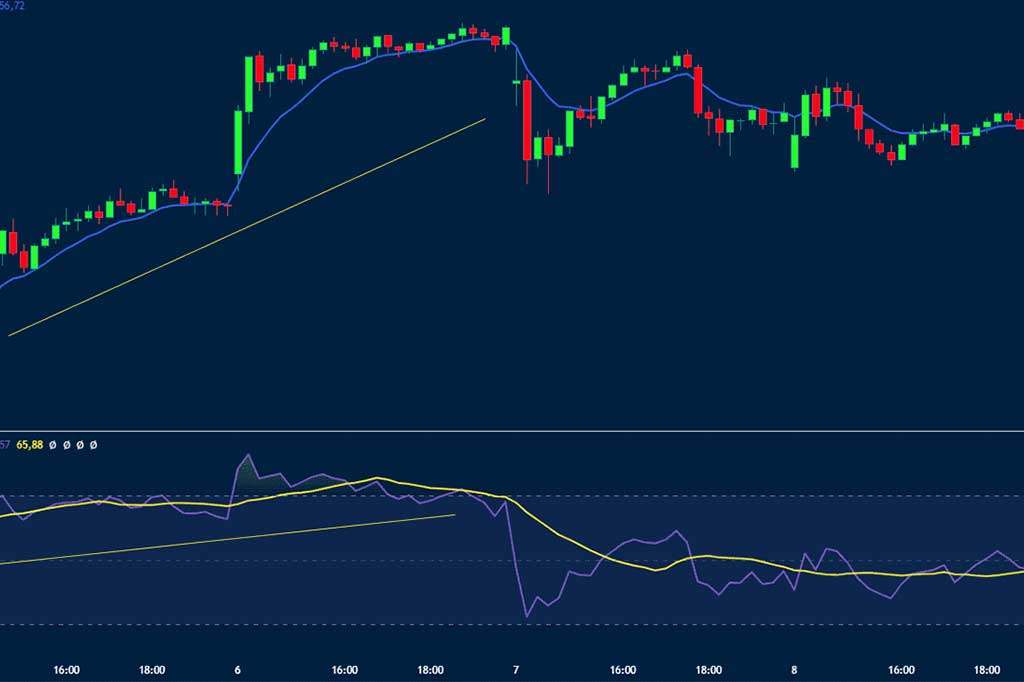
If I had to choose what many traders consider the best indicator for short-term trading, especially across Forex, indices, and cryptocurrency markets, it would be VWAP (Volume Weighted Average Price).
VWAP is not simply another moving average, but rather a price benchmark that is based on volume-driven value; as such, it provides a greater sense of real participation than simply being a time reference point.
Why VWAP works so well intraday
The VWAP serves as a type of “intraday fair value line” for traders. If the price is accelerated above the VWAP, the session is likely bullish. Conversely, if the price is below the VWAP, the session is likely bearish.
The true usefulness of using VWAP is that it will help you avoid chasing after price action.
- When the market is stretched far above VWAP, that is a signal indicating you may have missed an entry point.
- When the market pulls back to VWAP and holds or rejects it, you may find a cleaner entry.
- If the price increases above the VWAP and then fails, that is a quick way to see that the price is weak.
A simple way to trade VWAP (without overcomplicating it)
You should think of VWAP as a “Gravity line” for the trading session.
- On strong trending days, the price will stay close to VWAP and respect it as it rises and falls.
- On Trending in range days: the price will cross the VWAP line numerous times and get chopped up multiple times, meaning you are not forcing any trades.
That alone can save you from forcing trades on days that aren’t trending.
What timeframe is best?
For traders who scalp or take fast intraday positions, VWAP can be especially effective, with 1 to 15-minute timeframes, depending on your trading style.
VWAP shouldn’t be treated as the core; use it as a direction filter and your location tool (where price is relative to intraday value).
VWAP becomes even more useful by adding two secondary confirmation methods: confirmation by volume and volatility-based stops to your trading system.
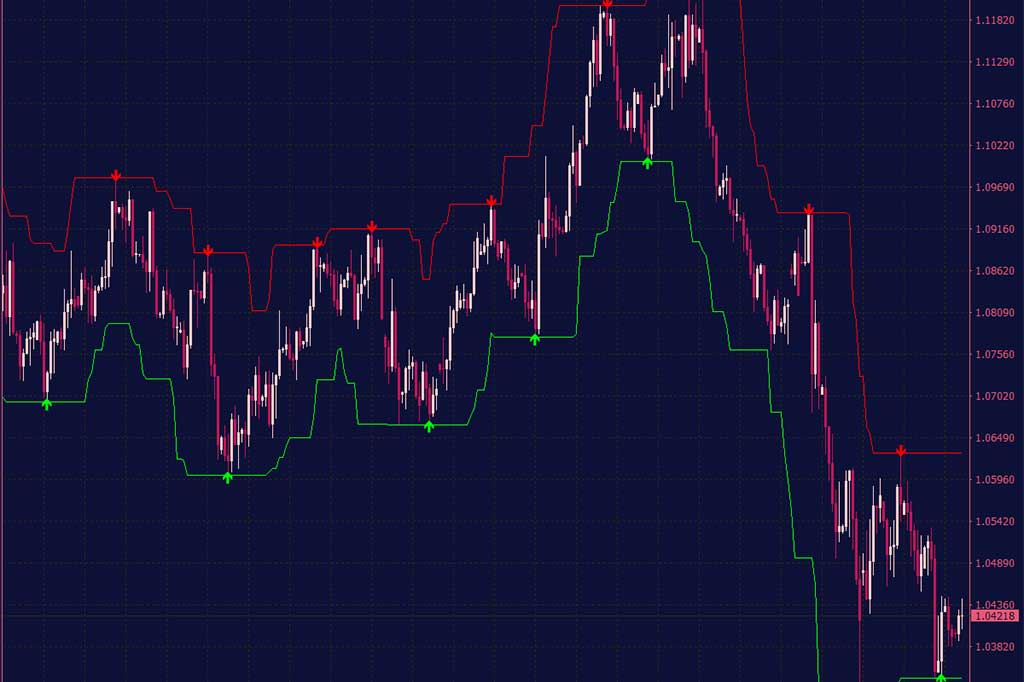
Essential Support Indicators for Short-Term Accuracy
Volume Indicators( Confirming Breakouts vs. Fake outs )
There are so many breakouts in short-term trading real level breaks are rare.
Volume indicators serve a great purpose here—not because volume can help to predict the future, but rather volume indicates the relative level of participation in a move that just occurred.
Read More: What is an indicator and its types?
If you break a level with low volume, it could indicate one of the following:
- The move is driven by a small push.
- It may reverse once liquidity is collected.
- The breakout may become a trap.
If you break a level with high volume, it indicates:
- More traders are participating.
- The move has better odds of follow-through.
- The breakout is less likely to instantly fail.
How to use volume in a clean, realistic way
- Mark your level (previous high/low, range edge, or session high).
- Wait for the price to break and close beyond the level.
- Compare volume on the breakout candle to recent candles.
- If volume is noticeably stronger, the breakout is more believable.
- If volume is weak, be cautious—or wait for a retest entry.
You don’t need a fancy suite of volume-related indicators. On a lot of instruments, even a basic volume histogram provides a lot of utility. If your broker or instrument does not provide good centralized volume (i.e., spot currency), you can often use tick volume as a rough proxy, and many traders do just that.
Average True Range (for Precise Stop-Loss Placement)
While there are many short-term traders who will be successful, there are also many short-term traders who will lose money even if they make a correct prediction because they do not have accurate stop-loss placement methods. Here are some methods that short-term traders will use to place stop losses:
- “10 pips sounds fine.”
- “I’ll put it below that candle.”
- “I don’t want to risk too much.”
However, the market operates based on volatility and not on what a trader thinks or feels.
That’s why Average True Range (ATR) is so useful. ATR calculates how far the price has typically moved over a defined period.
Therefore, by utilizing the ATR indicator, a trader will have a greater understanding of how much room the market has to move, and thus a greater opportunity to place a stop loss where the market can accommodate it.
Simple ATR stop logic
- If ATR is high, the market is swinging more → stops should usually be wider.
- If ATR is low, the market is calmer → stops can be tighter.
A practical approach:
- Use a fraction of ATR for your stop (example: 0.8x ATR on your entry timeframe).
- Or use ATR to validate a structure-based stop (example: stop below swing low, but make sure it’s not unrealistically tight vs ATR).
ATR won’t eliminate losses, but it helps prevent unnecessary stop-outs caused by normal market fluctuations.
Your First Short-Term Trade Using This Setup
Below is a step-by-step process you can consider like a checklist. Start with a demo account, then use small-sized trades, and increase the size only if you have been consistent.
Step 1: Pick one session and one market
Look for a time when the market is actually moving.
For instance:
- London session for different forex pairs.
- New York is open for indices.
- High liquidity period for crypto.
Begin trading with just one instrument to make consistency more important than variety.
Step 2: Set up your chart (keep it minimal)
Add only:
- VWAP (session VWAP)
- Volume histogram (or tick volume)
- ATR (14 is common, but you can test)
Do not include any other items or noise.
Step 3: Define your trade direction using VWAP
- If price holds above VWAP and creates higher lows, look for long trades.
- If price holds below VWAP and creates lower highs, look for short trades.
- If price crosses at or near the VWAP multiple times, then expect a range day (trade smaller or skip).
This helps you to avoid fighting the flow of the session.
Step 4: Mark the nearest “decision level”
Decision level is the place where traders react.
- Session high or session low
- Edge of an intraday clear range
- Most recent high or low swing in the same timeframe
Step 5: Wait for a clean break and close
This is where many traders rush.
For a breakout trade, require:
- Price breaks your level.
- A candle closes beyond it (not just a wick)
This avoids jumping into the first spike.
Step 6: Confirm the breakout using volume
Look at the volume of the breakout before considering entering.
- If the breakout candle’s volume is larger than the last few candles, that adds credibility to the breakout as more likely to be a true breakout.
- If the breakout candle’s volume is weak, consider waiting for a retest rather than immediately making an entry.
This will help reduce the number of fakeouts without slowing you down.
Step 7: Choose your entry style
Choose one of the following options to enter. Do not mix and match:
Option A: Breakout entry (faster).
Enter your trade immediately following the close of the breakout candle.
A breakout entry works best with larger volume and strong momentum.
Option B: Retest entry (safer).
Wait for a pullback to test the prior breakout level.
Enter if the prior level holds, and the price then negates in breakout direction.
Most beginner traders do better with retests because they reduce emotional chasing.
Step 8: Place your stop-loss using structure + ATR
Layering it into two parts:
- Structure Stop-Loss
- Buy trades: stop-losses should be under the last re-test low or last swing low.
- Sell trades: stop-losses need to be above the last re-test high or last swing high.
- ATR-Based Stop-Loss
- Check whether your stop-loss is at least a fraction of the ATR reading for the respective security and timeframe.
- If the distance between your stop and entry price is significantly smaller relative to the ATR, then expect that you will likely get stopped out.
The aim should be to have an appropriate distance for your stop-loss that accounts for the volatility of the security you are trading.
Step 9: Set a realistic target (don’t overpromise)
After creating your stop loss, you will need to determine a target.
- You can either pick the next most obvious area (swing high or swing low; or session high or session low) that is close to your entry price.
- Or you can use the risk-reward ratio of 1:1.5 as a template for determining your target.
Step 10: Manage the trade like a professional (simple rules)
Select one management rule.
- You can either move the stop-loss to break-even once there has been clear movement from the price away from the entry point (not immediately).
- Or you can scale out; thus, take some profit (at 1R) and let the rest ride the next resistance level.
Step 11: Exit if the trade thesis breaks
If price breaks back to the VWAP with strength and the volume begins to flip against you, respect that! Having discipline will reward you more as a short-term trader than courage.
Step 12: Journal the trade (2 minutes only)
Write down:
- Direction vs VWAP
- Level you traded
- Volume behavior
- ATR at entry
- What you did well / what you’ll adjust
This is how you improve faster than just “taking more trades.” A platform that offers fast execution and clean charting helps with this process. Many traders prefer cTrader Accounts for that reason, but any reliable platform can support this strategy.
Conclusion
In conclusion, short-term trading is so much simpler once you stop looking for “magic indicators” and instead develop a tiny system where each tool plays an important role.
The VWAP often acts as the best indicator for short-term trading when used as a directional and locational filter. Volume indicates the quality of a breakout, and the Average True Range, or ATR, indicates where to put your stop loss based on actual volatility. That’s all you need. No need for unnecessary clutter, which you often see on overly complicated charts.
If you take away only one thing from reading this article, let it be that your indicators are meant for assisting your decision-making process; they should never make your decision for you. Stick with your process, and use repetition to do the work of building your account.
On a final note, short-term indicators respond best to discipline and should not be used as a means of obsessing over them.
FAQ
Yes, with one adjustment: volatility and session behavior vary.
Crypto can move hard anytime, while Forex generally has clearer session moves (London/New York). VWAP, volume tools, and ATR still work, but your position size and stop distance may have to be wider in crypto as spikes happen more frequently.
Also, volume quality depends on the exchange/instrument. Crypto volume is easier to “see” and is generally more “real”. Spot Forex uses tick volume quite a lot.
For quick reversal detection, you will want to use tools that let you know that there is a momentum change and failure at key levels, not just ‘overbought/oversold’, etc.
Practical examples:
- Reclaim/failure of VWAP (price crossing and holding can suggest a shift).
- Volume spike + rejection candle at a level.
- Market structure shifts (lower high after an uptrend, higher low after a downtrend).
Reversals can be clearer in price action in many cases than an indicator. Your indicators have to confirm what the price is already saying.
An indicator is a tool that processes market data (price, volume, volatility, time) into a visual or numerical signal to help decision-making.
Common types:
- Trend indicators (help follow direction)
- Momentum indicators (show strength/weakness)
- Volatility indicators (measure movement range)
- Volume indicators (confirm participation)
- Support/Resistance tools (levels and bands)
In short-term trading, fewer types used correctly usually beat many types used loosely.
Usually, 2–3 is enough.
One for direction, one for confirmation, one for risk. If you add more, be honest: are they giving new information, or just saying the same thing to you in a different style?
A clean chart often leads to cleaner decision-making.
It depends on your personality. Fast scalpers: 1–3 minute charts
Balanced intraday: 5–15 minute charts
Whatever you choose, keep one “higher” timeframe for context (example: trade on 5-minute, check 15-minute for structure). This helps you avoid trading directly into major support/resistance levels.
Yes, because it’s structured and not overloaded.
Beginners usually struggle with:
entering too late
placing stops too tightly
overtrading on chop days
VWAP helps with direction and chop detection, volume helps avoid fake-outs, and ATR helps fix stop placement. That combination is beginner-friendly when practiced step by step.
Think of Otet as your reminder to keep execution consistent: one market, one session, one checklist.
Short-term success rarely comes from constant strategy-hopping. It comes from doing the same good process until it becomes boring and profitable.
Share
Hot topics

What Is Liquidity in Trading Strategy?
Liquidity plays a role in price execution when trading. You may have noticed the price came in worse than you expected and have already experienced liquidity at work without realizing...
Read more


Submit comment
Your email address will not be published. Required fields are marked *