Moving average Indicator (MA): Complete Guide for Traders
Introduction
If you’ve ever looked at a price chart and wondered how quickly prices move, you’re not alone, especially if you’re still learning What Is Forex and How Does It Work?.”
Price action on the market doesn’t move linearly; instead it moves up and down, then bounces back, or spikes upwards before settling into a range where price action stops moving for an extended period of time. For many people (especially new traders), this continuous movement can be daunting; as such, this is where the moving average comes into play.
The moving average indicator is one of the easiest to use and most commonly used tools by technical analysts. In terms of its appearance, the moving average has no glitz and glamour. And it doesn’t provide a trader with guaranteed instant profit. Therefore, the single most important aspect of the moving average is its ability to provide structure to a trader’s trading activities.
A majority of all professional level trading systems are based around a general moving average trading strategy—this helps them maintain their alignment with the overall trend and avoids emotional reactions that might lead to loss of capital.
What Is the moving average Indicator?
A moving average is a technical indicator that represents the average price of an Asset, calculated over a specified number of Periods. Those Periods can be as few as Ten or as many as Two Hundred depending on your reason for calculating a moving average.
The essence of moving average is Smoothness. moving averages Smooth out the fluctuations (volatility) in price and provide a general overview of the price movement over the desired period of time.
An analogy to the use of a moving average would be to drive through the fog. As you drive through the fog, it is extremely difficult to see more than a few feet ahead of the vehicle without being able to turn on the headlights of your vehicle to provide you with illumination. The moving averages are comparable to turning the headlights on of your vehicle to help you see past the interference of the fog (or the fluctuation in price) and to see towards your destination.
How Does a moving average Work?
A moving average is an average value utilizing a user-defined number of closing prices to derive the average.for example would be using the most recent 20 closing prices (to make) an average of them would be creating a 20 period moving average by adding all of the last 20 closing prices together and then dividing by 20.
Every time a new candle (which represents price action) closes, there will be a new addition and that new closed candle will replace the oldest closed candle within that group of candles. “This will create a moving line on the chart that moves through price actions, which can be easily observed on platforms such as metatrader5 account.”
As moving averages are derived from historical prices, they tend to lag in providing up-to-date reactions to price changes. The lag between occurrences of price movement and availability for utilization is referred to as “lag”. Although lagging may seem to have a negative connotation, it has the benefit of reducing the frequency of false signals because it smooths out much of the randomness typical of price changes.
Moving average Formula Explained
A simple moving average (SMA) provides a convenient way of averaging prices over a specified timeframe, which is easy as all you need to do is sum up the last 10 closes (the price of last period (10) at close) and divide that total by 10.
A price’s exponential moving average (EMA) provides different results for the most recent closing prices. Because of this, EMAs adjust to the financial market more quickly compared to SMAs.
Despite this difference, SMAs and EMAs both have the same objective—the time period being measured—and can therefore be used to calculate the average price for an instrument over a defined period, but they differ from each other with respect to their “smoothness” (i.e., change of value from one value (low, medium or high) to another).
Main Types of moving averages
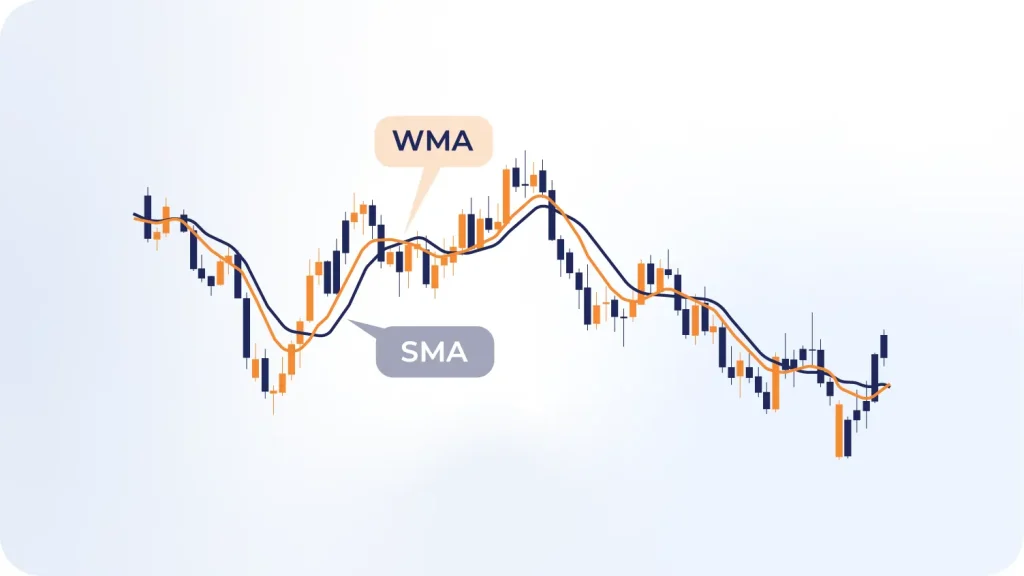
Simple moving average (SMA)
This is an averages weight equal with all points. While it is slower to react, it is also considered to be much more stable. Because of the short-term noise that is introduced in averages, many of the longer-term traders prefer using this as their trade strategy setup.
Exponential moving average (EMA)
The EMA gives more importance to recent prices. This makes it more suitable for short-term trading where quick reactions matter.
Weighted moving average (WMA)
The WMA assigns different weights to different price points. It is less common but can be useful in specialized systems.
Each type has its place depending on your trading style.
How to Use moving average in Trading
Identifying Trend Direction
A market is usually considered bullish when its price is above a moving average and bearish when its price is below this moving average. By knowing this simple fact, traders can help hamper themselves from making trades against the overall trend.
Dynamic Support and Resistance
In trending markets, price often pulls back toward the moving average before continuing in the trend direction. Traders use this as a potential entry point.
Moving Average Crossovers
Two common moving average systems use two different moving averages like the 50 EMA to help identify a trend direction. A crossing point occurs when the 50 EMA crosses up through the 200 EMA indicating that there Is potential for upward momentum. If this 50 EMA crosses down through the 200 EMA, it is possible that there will be continued downward pressure.
Best moving average Settings for Different Trading Styles
Best Settings for Day Trading
Traders will use shorter timeframes (from 5 mins to 15 mins) and shorter moving averages (9,20, and 50 EMA) when day trading.
An example would be: If the market is in an uptrend, to enter a buy order, they could enter once the price has pulled back to the 20 EMA, and they would stop out if the price drops to a level just below the most recent swing low.
This is an excellent way to enter into trades that are in a short-term momentum position but maintain control over their exposure (risk).
Best Settings for Swing Trading
Many swing traders use the 50 and 100-period simple moving averages (SMA) on the 4-Hour and Daily charts to make decisions about their trades. One strategy is to wait for the price of an asset to return towards the 50 SMA or 100 SMA during a trending market (the direction that the price is moving over time) and after getting confirmation with some sort of price action, e.g. a bullish pin bar candle. The swing trader could enter the trade with a stop loss below the previous swing low. This method can prevent overtrading and will result in larger moves in price.
Best Settings for Long-Term Investing
Long term investors monitor the 200 day moving average. If the price is above the moving average for a considerable amount of time, this indicates a strong upside long term trend.
However, if the price stays below the 200 day moving average for an extended period of time, that could cause the long term investor to reevaluate their position.
This will allow investors to stay consistent with the overall market patterns and not over react to short term fluctuations.
Limitations and Common Mistakes When Using moving averages
It Is a Lagging Indicator
Because it is based on past data, it cannot predict future movements. It reacts after price moves.
Using It Alone
Many traders make the mistake of relying solely on the moving average. It works best when combined with price action and risk management.
Over-Optimization
Constantly changing MA settings to match past price data often leads to unrealistic expectations.
Ignoring Market Conditions
moving averages perform well in trending markets. In sideways markets, they can generate frequent false signals.
Understanding these limitations helps you use the tool more effectively.
Step-by-Step Example of a moving average Strategy
Let’s walk through a practical moving average trading strategy.
- Open a 1-hour chart.
- Apply 50 EMA and 200 EMA.
- Wait for the 50 EMA to cross above the 200 EMA.
- Confirm that price closes above both averages.
- Enter on a pullback to the 50 EMA.
- Place stop-loss below the recent swing low.
- Target at least a 1:2 risk-to-reward ratio.
This approach keeps decisions structured and reduces emotional trading.
Platforms like cTrader platforms and otet markets provide built-in moving average tools, making it easy to apply this method directly on charts.
If you are new and wondering What is an indicator and its types?, moving averages fall under trend-following indicators. Many traders also consider them The best indicator for short-term trading when combined with proper confirmation.
Conclusion
across all styles of trading, the moving average indicator has proven to be a very reliable tool. Its strength comes from being straightforward and easy-to-use, but is still an effective method for analyzing trends, filtering out noise from your analysis, and providing direction for entering or exiting trades. Although there are no guarantees when trading with any type of indicator including moving averages, by using both discipline and risk management along with a moving averages strategy, this indicator can add additional value to your overall trading strategy. “The success of most traders comes down to using simple tools that they have learned how to apply repeatedly, just like choosing the right tools such as Best Crypto Wallet Trackers for 2026 in related markets.”
therefore, implementing a moving average strategy will require no added complexity to your current trading plan but will provide absolute clarity regarding what action to take when performing trades.
FAQ
What is the best moving average for beginners?
A lot of traders start off using the 50 S.M.A. or 20 E.M.A. because they typically provide acceptable signals and also do not react too slowly.
Can moving averages predict price direction?
No, they do not tell you what will happen in the future but are there to help you find out where price is already currently moving and also identify the potential for price to continue moving in the same direction as what it was moving in earlier.
What timeframe works best with moving averages?
It depends on your trading style. There is no universal answer; day traders will likely use very short time frames and long-term investors will likely use daily or weekly charts.
Is EMA better than SMA for day trading?
Many day traders prefer EMA because it reacts faster. However, the choice depends on your strategy and market conditions.
Share
Hot topics
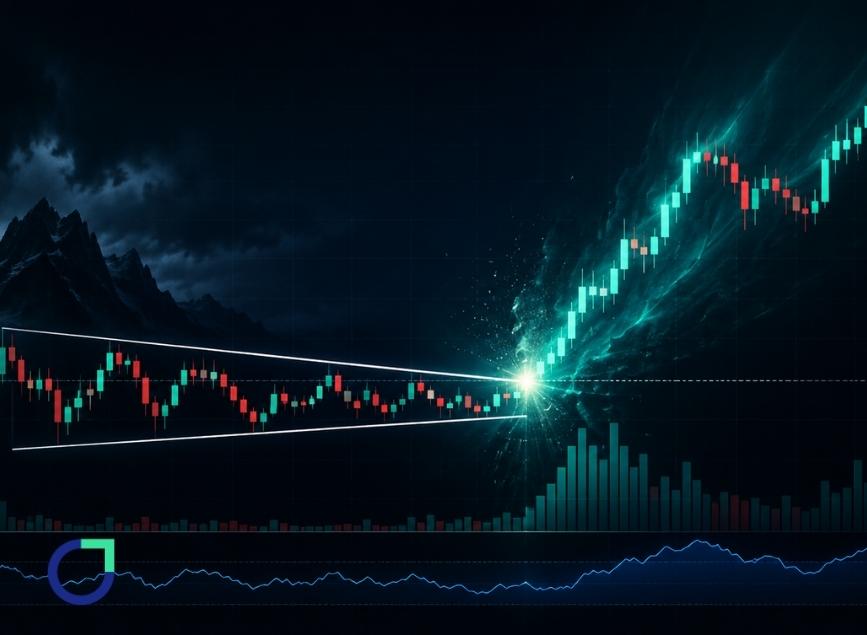
What Is a Breakout Trading Strategy and How to Trade It?
If you have ever observed a price move quietly for some time and then suddenly move in a particular direction, you have already seen a breakout in action. Breakouts can...
Read more


Submit comment
Your email address will not be published. Required fields are marked *