
US labor data and EU inflation. Market needs more clarity.
Markets remain in search of clarity as U.S. labor data and Eurozone inflation loom large next week. The U.S. economy continues to show resilience, with the Atlanta Fed GDPNow estimate rising to 3.9% (from 3.3%) on strong consumer spending (+0.6% MoM) and solid real consumption (+0.4% MoM). Core PCE inflation held steady at 2.9% YoY, signaling progress but not yet at target. Housing data was mixed, while rising Baker Hughes rig counts pointed to gradual supply recovery in energy. The upcoming jobs report will be critical in shaping Fed expectations, as payroll momentum has slowed and unemployment hovers at multi-year highs.
In Europe, inflation and growth signals diverged. Spain’s GDP grew 3.1% YoY, outperforming peers, but Germany’s Ifo business climate plunged to 87.7, its weakest since early 2024. Eurozone inflation is expected to edge higher in September (consensus: headline 2.3%, core 2.3%), with labor market data from Germany also closely watched.
Globally, Japan’s Tokyo CPI slowed to 2.5% YoY, South Korea’s sentiment remained weak, and Russia’s reserves climbed to $712.6B. Brazil saw strong FDI inflows, while Mexico cut rates amid sticky inflation.
U.S. Weekly Economic Review
The U.S. economy continues to outperform its peers, combining solid growth with steady disinflation, though headwinds from high rates and softer sentiment are becoming more visible.
Growth Momentum
Second-quarter GDP was revised up to 3.8% QoQ from 3.3%, reversing the prior contraction and underscoring robust demand, with final sales surging 7.5%. Inflationary pressures eased as the GDP price index slowed to 2.1%. Looking ahead, the Atlanta Fed GDPNow raised its Q3 projection to 3.9%, suggesting growth remains firm heading into year-end.
Inflation & Consumers
The Fed’s preferred gauge, Core PCE, held steady at 2.9% YoY for a fourth month, while headline PCE ticked up to 2.7%. On a monthly basis, both measures advanced modestly. Incomes rose 0.4% and personal spending gained 0.6%, backed by real consumption growth of 0.4%. Yet, sentiment weakened, with the Michigan Index slipping to 55.1.
Housing & Industry
Housing showed mixed signals: existing home sales dipped to 4.00M (-0.2% MoM), while new home sales surged 20.5% to 800K, their strongest since 2020. Permits fell, pointing to softer supply growth ahead. Industrial activity was uneven, with Richmond Fed’s index plunging to -17, while Kansas City Fed surveys improved to +4, signaling regional divergence.
Labor & Trade
The labor market remains resilient. Initial jobless claims fell to 218K, with continuing claims steady at 1.93M. Trade balances improved, with the goods deficit narrowing sharply to -$85.5B, though weaker wholesale inventories (-0.2%) could weigh on Q3 output.
Energy
Crude (-0.61M) and gasoline (-1.08M) inventories declined, supporting prices, while rig counts rose to 424 (oil) and 549 (total), suggesting gradual supply recovery.
U.S. Economy – Week Ahead Outlook
The U.S. economy enters the final week of September with a mixed picture: resilient growth and steady inflation on one hand, but persistent weakness in construction, subdued manufacturing and services, and a cooling labor market on the other. Upcoming high-impact releases — including ADP employment, ISM manufacturing, construction spending, nonfarm payrolls, and ISM services — will provide clarity on whether the economy is maintaining momentum or slipping toward a softer patch.
Construction Spending
The construction sector remains a drag. In July, total spending fell 0.1% MoM and 2.8% YoY, led by weakness in commercial property development. While infrastructure and data center projects are bright spots, residential construction remains constrained by affordability challenges, down 5.1% YoY. Despite Fed rate cuts, high borrowing costs, tariffs, and tighter immigration policies weigh on activity. August is expected to show another 0.2% monthly decline, underscoring that construction will lag any broader rebound.
ISM Manufacturing & Services
Manufacturing has contracted for six straight months as tariffs raise costs and curb investment demand. Regional Fed surveys suggest flat conditions, keeping the ISM index near 48.8 — still in contraction territory. Services, though holding above 50, show signs of softening, with ISM expected to ease to 51.6 from 52.0. Together, the surveys highlight muted business momentum across both sectors.
Employment
Labor market strength has clearly cooled. Payroll growth has slowed to an average of 29K over the past three months, and unemployment has risen to 4.3%, a near four-year high. September forecasts call for just 45K new jobs, with unemployment steady at 4.3% but at risk of edging up to 4.4%. Job postings remain below spring levels, while small-business hiring plans are subdued. Still, employers are reluctant to cut staff, reflected in low jobless claims (~230K). Limited labor force growth, constrained by weak immigration, adds further pressure.
Wages provide one area of stability, with average hourly earnings expected to rise 0.3% in September, holding the annual rate at 3.7%. However, without stronger job creation or longer working hours, income growth will remain under pressure, constraining household spending power.
Wall Street & USD Outlook
The U.S. equity rally has been fueled by expectations of Fed rate cuts, strong corporate earnings, and optimism surrounding AI and technology. Yet, stretched valuations — particularly in the tech sector — leave markets vulnerable to corrections if macro data, tariffs, or earnings disappoint. Last week, despite upbeat GDP, labor, and durable goods data, cautious Fed commentary weighed on sentiment, with equities closing nearly flat. In the week ahead, focus turns to the jobs report, ISM PMIs, and inflation data, all of which could validate or challenge the “soft landing + gradual cuts” narrative. Trade policy and fiscal risks remain underpriced and could re-emerge as destabilizing factors.
In FX markets, the U.S. dollar has softened in recent months as traders priced Fed easing ahead of peers. However, growth resilience, sticky inflation, and safe-haven flows pushed the dollar higher last week. The greenback will remain highly sensitive to rate differentials, yield dynamics, and capital flows. Stronger labor and ISM data could extend USD gains, while weaker prints may revive downside pressure.
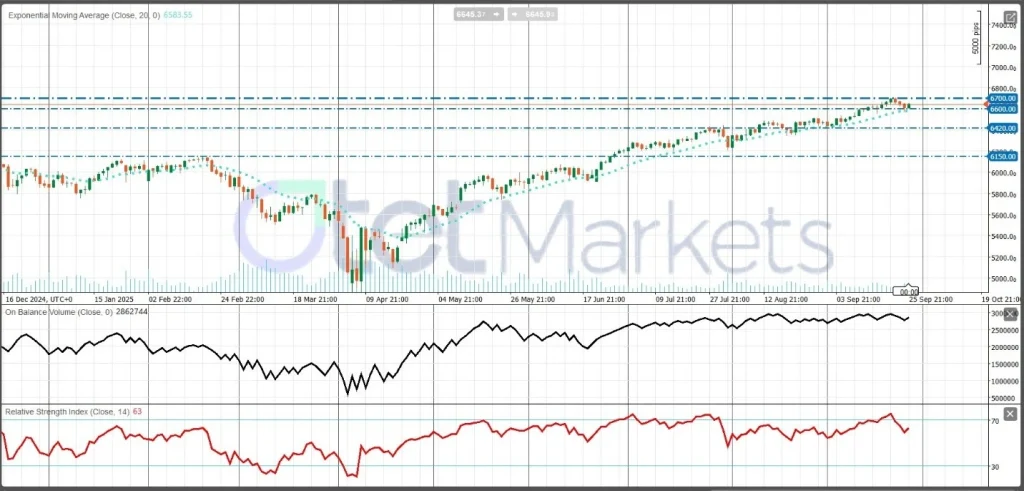
S&P 500 Technical Outlook
The broader trend remains bullish but stretched. Momentum indicators (RSI ~63–70) are near overbought, signaling limited upside without consolidation.
- Support: 6,420 → break risks pullback toward 6,150.
- Resistance: 6,700 → holding above interim 6,600 favors continuation, though sideways consolidation is likely.

DXY Technical Outlook
The dollar index is consolidating after rebounding from summer lows, with momentum neutral.
- Resistance: 98.00 → breakout confirms renewed bullish strength.
- Support: 97.40 → break exposes 96.00 pivot.
Europe & Eurozone: Sluggish Growth, CPI in Focus
The Eurozone economy remains stuck in a low-growth, soft-inflation environment, with recent data reinforcing structural weaknesses across the bloc. While Spain continues to outperform with resilient GDP growth, Germany — the region’s largest economy — struggles with weak demand and fragile confidence. France and Italy show mixed trends, leaving the overall Eurozone picture uneven and well behind the U.S. in the global growth cycle.
Growth Momentum
Spain remains the bright spot, with Q2 GDP up 3.1% YoY (vs. 2.8% expected) and quarterly growth at 0.8%. By contrast, Germany continues to falter, with sluggish output and soft consumption dragging down regional averages. Q2 Eurozone GDP rose just 0.1% QoQ, down from 0.6% in Q1, underscoring the weak growth backdrop. Divergence between stronger southern economies and northern industrial exporters highlights persistent imbalances across the bloc.
Inflation & Consumers
Price pressures are gradually easing. Eurozone M3 money supply growth slowed to 2.9% YoY in August (vs. 3.4% prior), reflecting tighter liquidity. Private-sector lending rose modestly (+2.5% YoY), showing some resilience despite higher rates. Consumer confidence improved slightly to -14.9 but remains deeply negative by historical standards, signaling ongoing household caution.
Business & Industry
Industrial activity remains under strain. Germany’s Ifo Business Climate Index fell to 87.7, its weakest since early 2024, with expectations at 89.7 and current conditions at 85.7. PMIs were also weak: France posted both Manufacturing (48.1) and Services (48.9) in contraction, while the Eurozone Manufacturing PMI slipped to 49.5. Germany offered a modest surprise, with Composite PMI (52.4) and Services PMI (52.5)back in expansion, though manufacturing remains the main drag.
Labor & Fiscal Position
Labor markets remain stable but uninspiring. France’s jobseeker totals declined slightly to 3.02M, their lowest since 2020, and Italian consumer confidence rose to 96.8. Yet cracks remain: German unemployment data due next week will be closely watched for signs of stress. Fiscal conditions are also a concern. Italian BTP auction yields rose to 3.62% (10-year) and 2.94% (5-year), reflecting higher financing costs. Spain’s trade deficit widened to -4.01B, while France maintained stable short-term funding near2.0%.
Week Ahead: CPI & Labor Data
The key release will be the September CPI flash estimate. Consensus expects headline inflation to edge up to 2.3% YoY (vs. 2.0% in August), with core inflation steady at 2.3%. A softer reading would reinforce bets on additional ECB easing in early 2026, possibly as soon as December with a 25 bps cut bringing the deposit rate to 1.75%. Conversely, sticky inflation could delay cuts. German unemployment figures will also be critical, as labor market weakness could amplify recession risks.
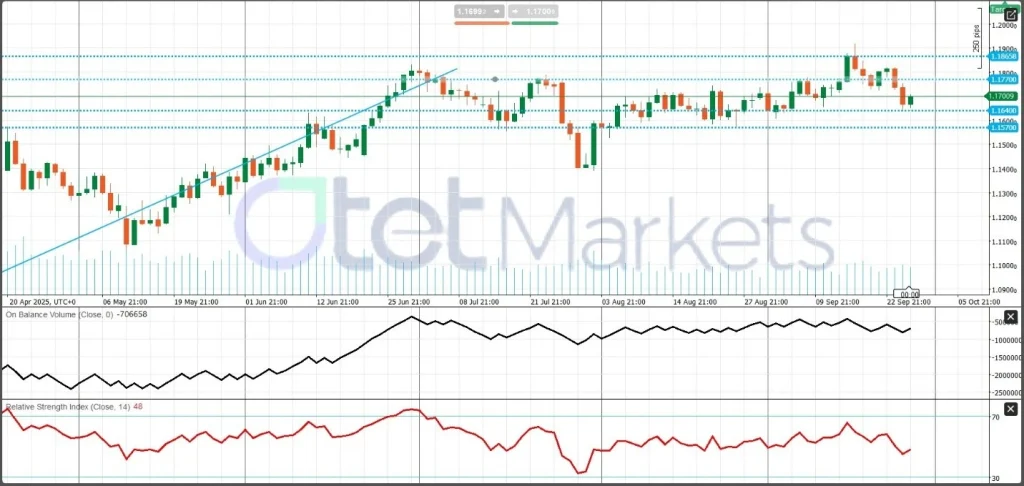
EUR/USD Technical Outlook
EUR/USD trades under broad pressure, reflecting growth and policy divergence with the U.S.
- Trend: Neutral-to-bearish; lower highs since mid-June, RSI ~48.
- Resistance: 1.1770, then 1.1865 → break could open 1.2000.
- Support: 1.1640, then 1.1570 → break would confirm renewed bearish momentum.
Gold — Current Market Condition & Weekly Outlook
Gold remains in a supportive but choppy environment shaped by two major forces: the interest rate path and overall risk appetite, even as the USD has been trending higher in recent days. Markets broadly expect the Fed to maintain a restrictive stance but gradually shift toward easing over the coming quarters as growth cools and inflation moderates. This expectations mix has capped U.S. real yields just enough to keep a floor under bullion, despite intermittent bursts of “higher-for-longer” rhetoric giving way to talk of rate cuts to offset growth risks. The dollar, meanwhile, has lost some of its earlier cyclical momentum but still rallies on strong U.S. data or safe-haven demand. Typically, those surges weigh on gold, yet in the current environment, rising safe-haven demand has cushioned the impact, allowing the bulls’ run to continue. In addition, geopolitics and tariff headlines continue to provide a low-frequency but high-impact bid, with investors using bullion to diversify equity-heavy portfolios, while central banks steadily increase their gold reserves.
Positioning remains moderate. ETF holdings have stabilized after prior outflows, while central-bank demand continues to serve as a structural backstop, particularly from emerging-market reserve managers. Speculative appetite is also evident: CFTC gold speculative net positions edged higher to 266.7K (vs. 266.4K prior), a neutral-to-slightly bullish signal given that net longs remain near multi-month highs. This suggests that while demand is firm, the market is vulnerable to profit-taking should macro data or yields turn against bullion.
On the macro side, inflation has eased but has not returned to pre-pandemic norms. Core measures remain sticky enough that bonds cannot decisively price aggressive cuts. This tug-of-war helps explain why gold has been range-bound: each time yields dip and the dollar softens, bullion tests higher; each time growth or inflation data surprise on the upside, those rallies stall. However, prices have not meaningfully broken lower, as risk appetite remains elevated, with the VIX holding above 18.
The week ahead is data-heavy. U.S. labor reports, ISM surveys, and inflation surprises are likely to dictate gold’s moves through their impact on yields and the dollar. A “goldilocks” sequence — softer jobs, cooler ISM prices, and steady growth — would likely push real yields lower and lift bullion toward the top of its range. Conversely, a strong payrolls report or sticky inflation indicators would nudge yields higher and weigh on gold in the near term. Fed commentary will also be critical: a cautious tone should limit downside, while hawkish pushback could embolden sellers.
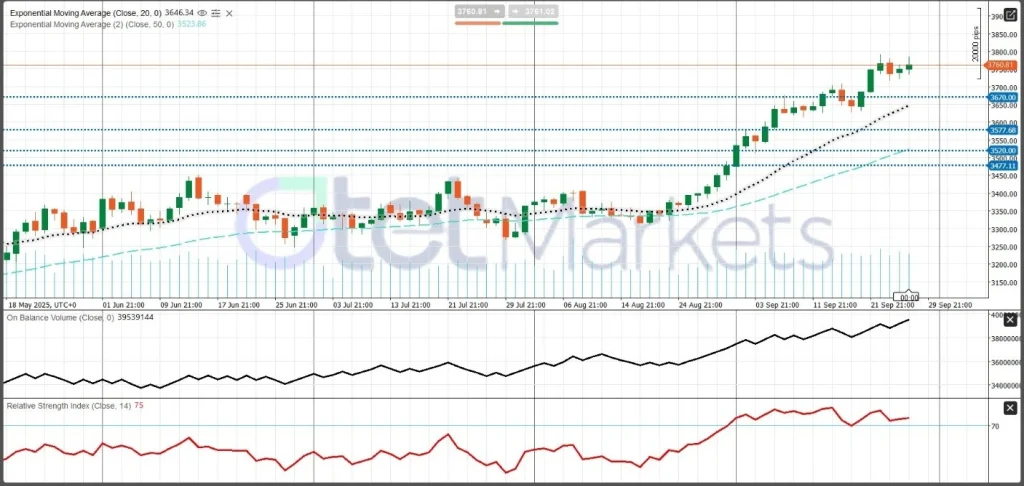
Technically, gold remains in broad consolidation but with an underlying bullish bias. Dips toward well-watched support zones continue to attract strategic buyers, while rallies into overhead supply draw in profit-taking and tactical selling. Momentum indicators remain constructive, with RSI above 70 and On-Balance Volume (OBV) trending higher, signaling persistent demand. The trend remains bullish, with a key pivot at the 20-day moving average around $3,650, which serves as a critical support level for maintaining upside momentum.
Energy Market Condition & WTI Weekly Outlook
Crude oil remains at the intersection of tightening near-term balances and uncertain macro demand. U.S. inventory signals have leaned supportive: the latest EIA report showed a modest crude draw alongside a decline in gasoline stocks, while natural gas storage injections came in below expectations. Refinery utilization has only eased slightly, and Baker Hughes reported an increase in active oil rigs, hinting at gradual future supply growth, though investment discipline remains the priority for U.S. producers. The API weekly report showed a 3.82M barrel crude draw for the week ended September 20, followed by official EIA data confirming crude inventories fell by 0.61M barrels. On Friday, Baker Hughes data also showed the oil rig count rising to 424 (vs. 418 prior), with the total rig count increasing to 549 (vs. 542 prior).
Globally, OPEC+ cohesion has held firm, with voluntary cuts and ad-hoc export management measures helping dampen volatility. At the same time, geopolitical risk premia continue to ebb and flow with headlines on shipping lanes and regional conflicts, keeping a built-in option-like bid embedded in flat prices.
Demand remains the variable. U.S. consumption and travel indicators are resilient, but Europe’s industrial weakness and China’s uneven recovery temper the global outlook. On balance, the IEA and OPEC narrative of a broadly balanced market with pockets of tightness remains valid, though margins for error are narrowing as the market transitions into Q4’s heating season. Product cracks have cooled from recent highs yet remain constructive enough to support refinery runs. However, any downside growth surprise could quickly filter through to crack spreads and crude differentials.
The term structure reflects this nuance. Prompt spreads are modestly backwinded, signaling a market not oversupplied but not facing acute shortages either. Volatility has subsided from earlier spikes, yet the options market continues to price two-sided tail risks: supply disruptions on one hand, and demand disappointments on the other.
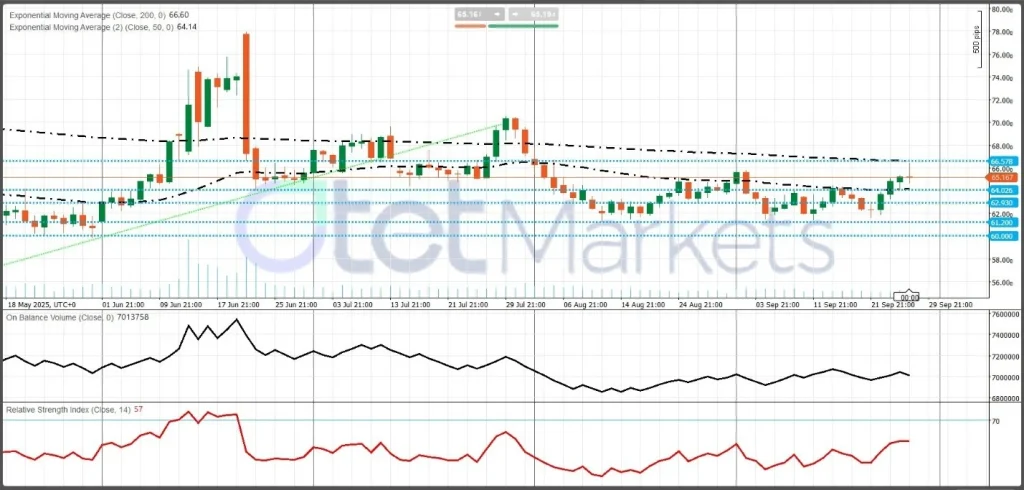
Technically, WTI consolidates within a broad range. Pullbacks into key support levels have attracted buying interest from macro funds and physical hedgers, while rallies toward resistance levels have met consistent selling from CTAs and producer hedging programs. Momentum indicators sit in the mid-range, while flattening moving averages point to balance rather than a decisive trend. For now, key resistance lies at the 200-day moving average around $66.60, while the 50-day moving average near $64.00 serves as the first and most important support.
Bitcoin & Crypto Market Update
Bitcoin resumed its decline after yesterday’s brief rebound proved short-lived. BTC is down 0.7% in the past 24 hours and has lost 4.5% over the past week. Broader sentiment has shifted to “Fear,” with the Crypto Fear & Greed Index falling to 40. Heavy selling and elevated liquidations are driving volatility, while macro headwinds add further pressure.
Market Snapshot
- BTC: -0.7% daily, -4.5% weekly
- ETH: -4% daily, -12% weekly
- SOL: -3% daily
- BNB: -2.5% daily
- Total market cap: $3.83 trillion (-1.4% in 24h)
This week has seen $1.7B in liquidations (95% long positions), marking the largest wipeout of 2025.
What’s Driving the Selloff?
- ETF Outflows – Bitcoin ETFs recorded $225.7M in outflows this week (SoSo Value), snapping a four-week streak of inflows. Weak institutional demand could weigh further on prices.
- Whale Selling – On-chain data shows large BTC holders (>1,000 BTC) have sold 147K BTC (~$16.5B) since August, cutting their share by 2.7%. This sustained selling caps recovery attempts.
- Macro Headwinds – Fed Chair Powell struck a cautious tone on rate cuts, lifting the USD and yields while pulling U.S. stocks off highs. Markets now price in 100 bps of cuts for 2025 (vs. 125 bps prior), with a 92% chance of a cut in October.
Investors will watch U.S. GDP, jobless claims, durable goods orders, and Fed speeches for clues on the timing of future cuts. Softer data could revive liquidity expectations and support crypto.
Technical Analysis – BTC
- BTC’s rebound from $107.2K stalled at $117.9K.
- Price is testing its rising trendline support (since April).
- A break below the 50-SMA and RSI under 50 keeps momentum tilted bearish.
- Key Levels:
- Support: $108,000 and then $106,000 → break risks a slide to $100,000 psychological support.
- Resistance: $111,000, $113,500, and then $117,900 → breakout could retest the all-time high near $125,000.
Should Buyers Worry?
Despite sharp headlines, the pullback appears to be a short-term correction rather than the start of a deeper bear market. Bitcoin’s weekly decline (-4.5%) is modest relative to its historical volatility. Much of the selling is driven by profit-taking and leveraged liquidations, while long-term holders remain steady.
Institutional flows also remain mixed: last week saw $1.9B in fund inflows, including $997M into Bitcoin and $773M into Ethereum, signaling underlying demand.
Share
Hot topics

Gold symbol in forex
Introduction If you have ever opened a trading platform and searched for gold, you probably noticed a specific code instead of the word “gold.” In the forex world, assets are...
Read more


Submit comment
Your email address will not be published. Required fields are marked *