
Weekly Economic review and Outlook: US inflation at the center of Stages
Global Economic Review – Week 28, 2025 (July 7–13)
The global economy faced renewed uncertainty this week as rising trade tensions, cautious central bank policy, and fragile consumer demand shaped the outlook across major regions. While hard data releases were limited, policy shifts and tariff announcements dominated headlines.
In the U.S., the expiration of the 90-day pauses on the reciprocal tariff program brought renewed focus to trade policy. Although the deadline was extended to August 1, over 20 countries were notified of new tariffs, alongside sectoral levies on goods like copper and pharmaceuticals. This added to policy uncertainty and further dampened economic sentiment. Revised data showed real personal consumption rose just 0.5% (annualized) in Q1, with May consumer spending down 0.3%. Credit growth also slowed, prompting analysts to revise Q2 GDP estimates lower, now averaging around 1.8%.
Business optimism slipped, with more firms planning to raise prices due to cost pressures. Nonetheless, inflation expectations declined, with the New York Fed’s one-year outlook falling to 3.02% and the University of Michigan’s to 5.0%. This gives the Federal Reserve room the chance to begin cutting rates, with most expecting a 50-basis point reduction by year-end. Labor market data remains strong, though softening demand may lead to a gradual rise in unemployment.
Globally, central banks held a cautious stance. The Reserve Bank of Australia unexpectedly kept its rate at 3.85%, citing firm domestic demand and slightly stronger inflation. Markets still expect gradual easing, with rates possibly falling to 3.10% by early 2026. Similarly, the Reserve Bank of New Zealand held its rate at 3.25%, noting support from high export prices and easing financial conditions, though downside risks remain.
In the UK, GDP fell 0.1% in May after a 0.3% decline in April, led by weakness in manufacturing. With Q2 growth near zero, expectations for a Bank of England rate cut in August are rising. In contrast, Canada’s June labor report surprised positively, with 83,100 new jobs and a drop in the unemployment rate to 6.9%, suggesting the Bank of Canada may pause rate cuts for now.
In Latin America, inflation was mixed. Mexico’s core CPI rose unexpectedly, while Brazil’s inflation climbed to 5.35%, potentially delaying easing. Meanwhile, Colombia and Chile saw faster-than-expected disinflation, reinforcing prospects for further rate cuts.
U.S. Economic Outlook – Week of July 14–18, 2025
The upcoming week is a pivotal one for the U.S. economy, with key data and corporate earnings poised to influence the Federal Reserve’s next policy steps. At the center of attention is the June Consumer Price Index (CPI), due Tuesday. After months of cooling inflation, June may signal a shift. Core CPI had slowed to a 1.7% annualized pace, the lowest since early 2021—but analysts now expect headline CPI to rise 0.25%, pushing the year-over-year rate to 2.6%, largely due to higher gasoline prices. Core CPI is forecast to increase 0.24%, lifting the annual rate to 2.9%, as tariff effects begin to impact core goods and services.
This inflation print comes at a critical moment. The Fed is debating whether to begin cutting rates as early as July or wait until September. The release of the June FOMC minutes this week may highlight divisions within the committee—some officials concerned about tariff-fueled inflation, others pointing to softening demand and labor market cooling. A stronger-than-expected CPI could delay rate cuts into Q3.
Adding to the week’s importance, Q2 earnings season kicks off for major banks, including JPMorgan, Citigroup, Wells Fargo, Goldman Sachs, Bank of America, and Morgan Stanley. Analysts anticipate strong trading revenues—possibly topping $26 billion—driven by tariff-induced market volatility. Still, investors will be looking forward to guidance, credit conditions, and how banks are managing loan growth and margin pressures amid slower momentum.
On Thursday, the June retail sales report will offer insight into consumer strength. After a 0.9% drop in May, overall sales are expected to be flat in June, while the control group may rise 0.3%. Weaknesses in auto sales continue, though e-commerce remains a bright spot. The data likely confirm that household spending is moderating after strong gains earlier in the year.
Closing out the week, June housing starts are expected to decline to a 1.23-million-unit pace, reflecting ongoing strain from high mortgage rates and softer permit activity—particularly in single-family housing. Multifamily construction remains supported by rental demand but is also showing signs of slowing.
Altogether, this week’s inflation data, earnings results, and consumer indicators will be crucial in determining the Fed’s path forward—especially with the next phase of U.S. tariffs set to begin August 1.
Wall Street Outlook – Week 29, 2025
Wall Street faces a critical test this week as Q2 earnings season and key inflation data converge to challenge market optimism. With expectations for early Federal Reserve rate cuts still uncertain, the June Consumer Price Index (CPI)due Tuesday—could heavily influence monetary policy sentiment. A stronger-than-expected reading may delay cuts, tighten financial conditions, and cap further equity gains.
Earnings season kicks off with major banks reports on Tuesday and Wednesday. Analysts project a strong quarter for most companies, with total revenues potentially exceeding $26 billion, buoyed by tariff-driven volatility. However, forward guidance will matter more than headline figures. Investors are especially focused on loan loss provisions, margin pressure, and capital return plans. Elevated share prices mean companies have little room to disappoint.
June CPI is expected to show 0.25% headline and 0.24% core inflation growth. This would lift the core annual rate to 2.9%, fueled by higher gasoline prices and the early impact of tariffs on goods and services. If inflation proves stickier than hoped, the Fed may opt for caution, pushing the expected September rate cut probability down to 60%, and shifting investor focus squarely onto corporate earnings as the main market driver.
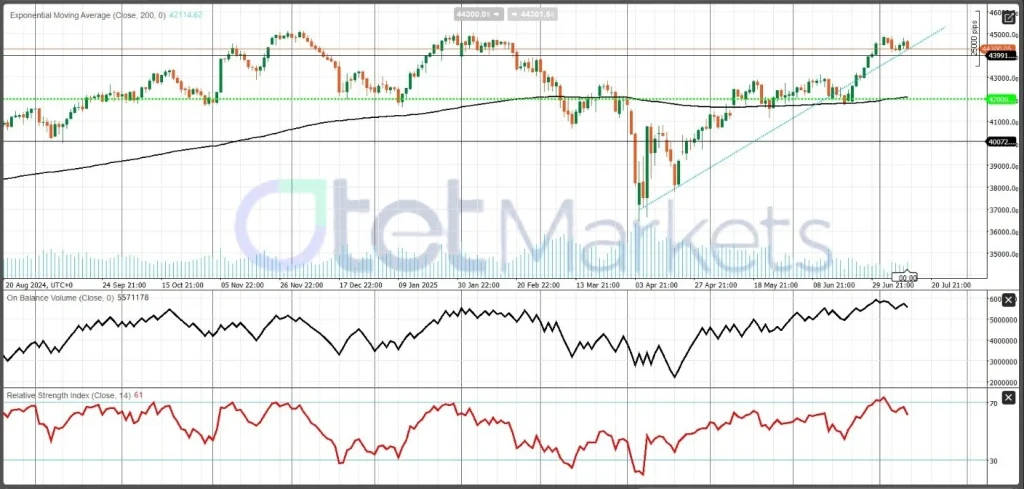
Technically, major indexes remain bullish. The Dow Jones Industrial Average continues to consolidate above the 200-day moving average at 42,000, a critical support. A break above 45,000 could open the door to fresh highs near 46,000, while downside risk intensifies below 43,000, with key levels at 42,000, 40,000, and possibly 36,000 on deeper corrections.
U.S. Dollar Outlook – Week 29, 2025
The U.S. dollar remains under pressure amid growing fiscal concerns, unpredictable trade policy, and rising expectations of Fed rate cuts. Down nearly 11% year-to-date, the Dollar Index (DXY) is on track for its worst annual performance since the 1970s. Despite a recent rebound—driven by tariff threats and risk-off flows—strategists caution that the dollar now behaves more like a “risky” asset than a traditional safe haven.
This week’s CPI data, bank earnings, and potential trade updates could set the dollar’s next direction. A strong CPI print might support the greenback by pushing back rate cut expectations. Conversely, soft inflation and cautious corporate guidance could reinforce downside momentum.
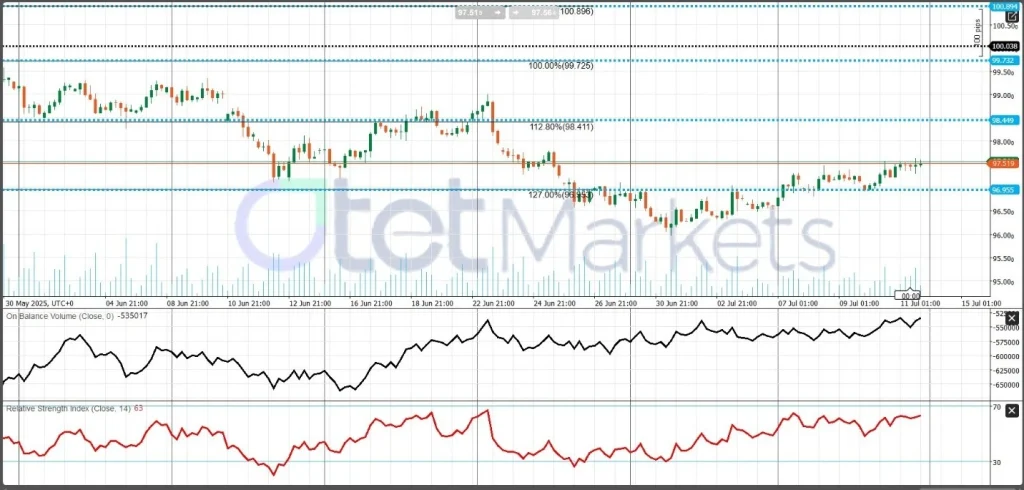
Technically, DXY trades in a decision zone between 97.00 support and 97.80 resistance, with upside potential capped at 98.50. A break below 97.00 risks a move toward 96.50–96.00, while a breakout could challenge the broader downtrend if supported by strong data.
UK Economic Review and Outlook – Week 29, 2025
The UK economy is entering a delicate phase, marked by two consecutive months of GDP contraction and rising expectations for a Bank of England (BoE) rate cut in August. May GDP fell by 0.1%, following a 0.3% drop in April, signaling broad-based weakness across manufacturing, construction, and industrial production. Although services saw a marginal uptick, overall momentum remains weak. Chancellor Rachel Reeves called the data “disappointing” and sought to reassure investors by emphasizing public investment and trade efforts, while acknowledging growing fiscal constraints and external risks, including U.S. tariffs.
Markets have now placed a 78% chance of a BoE rate cut next month. The BoE’s latest Financial Stability Report also flagged elevated risks from global trade tensions and sovereign debt, even as it reiterated the resilience of the UK banking sector. The Office for Budget Responsibility (OBR), meanwhile, highlighted the country’s limited fiscal headroom and “daunting” debt outlook.
Business sentiment has softened, and labor market indicators point to slowing momentum—exacerbated by the planned rise in national insurance contributions. Although Q1 GDP growth came in at 0.7%, the BoE projects just 0.25% for Q2, reinforcing the view that a rate cut is now increasingly likely. Consumers remain relatively stable but weakening real income growth and elevated inflation continue to weigh on broader demand.
In Week 29, all eyes will be on June inflation and wage data. Headline CPI is expected to hold steady at 3.4% year-over-year, while core inflation remains at 3.5%. Elevated food prices and recent oil spikes could keep price pressures sticky. However, services inflation may ease further to 4.6%, helped by moderating wage growth. Average weekly earnings (excluding bonuses) are expected to slow to 4.8% in the private sector, lending further support to the case for a 25bps rate cut to 4.00%.
Key developments this week include GDP and trade updates, BoE Governor Bailey’s speeches, and any signals on fiscal policy from Chancellor Reeves. Geopolitical concerns—especially rising U.S. trade barriers—pose additional external headwinds for UK exports.
Pound Outlook
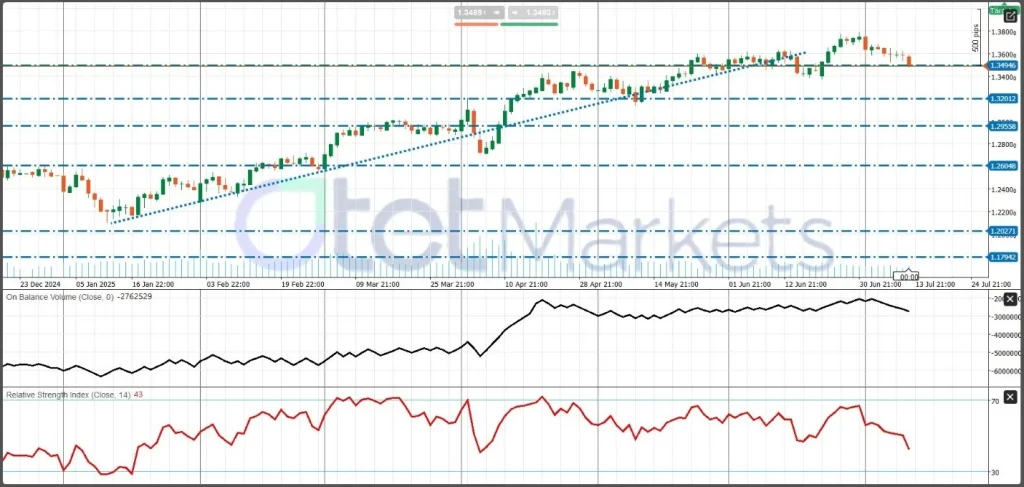
The British pound has turned bearish amid growing rate cut bets. With RSI near 43 and declining OBV, GBP/USD may fall toward 1.3350 or 1.3200 if support breaks. A reversal is possible if the dollar weakens, with resistance at 1.3600 and potential upside toward 1.3800.
Gold Market Review and Outlook!
Despite ongoing volatility and pressure across global markets, gold has remained resilient in recent weeks, consistently trading above $3,300 per ounce. This strength is underpinned by a combination of geopolitical uncertainty, robust central bank demand, and broad U.S. dollar weakness. Persistent tensions in the Middle East and the re-escalation of U.S. trade tariffs have further bolstered gold’s appeal as a safe-haven asset. Meanwhile, central banks continue to play a key role in supporting the market, with more than 1,000 tons of gold purchased annually, including a record 244 tons in Q1 2025 alone.
Despite gold’s impressive year-to-date gains of around 25–27%, analysts are becoming more cautious. HSBC has flagged that momentum is slowing, suggesting a correction may be on the horizon, with revised forecasts now ranging between $3,215 and $3,125 over the next 12–18 months. Similarly, Citi expects a retreat below $3,300, targeting a move toward $2,800 by late 2025, citing weakening investment demand as a key concern.
From a macro perspective, Federal Reserve policy signals remain a critical driver. Delayed rate cuts have weighed on gold in recent sessions; however, persistent economic risks could still prompt easing later this year, offering renewed support. In addition, geopolitical and trade-related tensions—particularly any escalation in global conflicts, sanctions, or tariff actions—continue to reinforce gold’s defensive characteristics.
Another powerful force remains central bank buying, which is expected to provide a buffer against short-term corrections. Should this trend continue, it could offer structural support for gold prices through the second half of 2025.
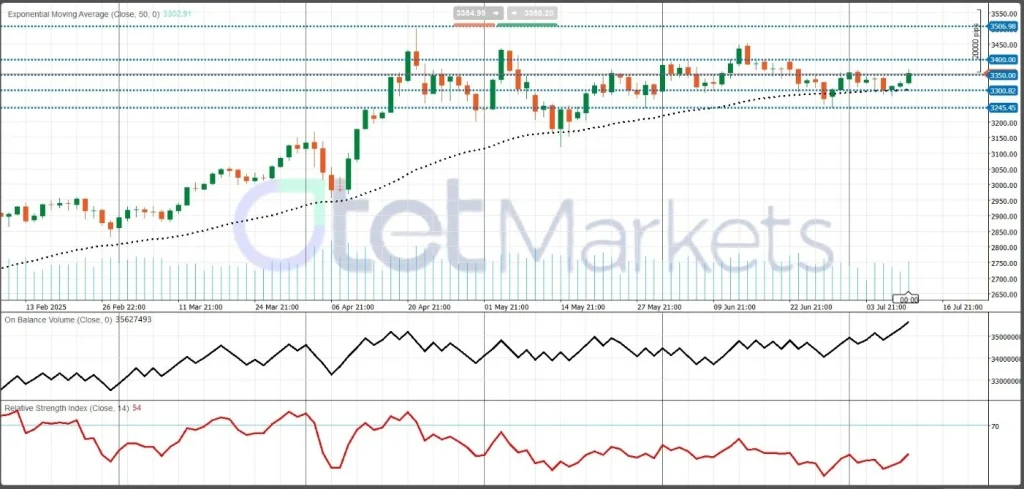
Looking at the technical picture, gold is currently consolidating near key support levels, but the broader outlook remains cautiously bullish. The 50-day moving average, now aligned near $3,300, has held as a meaningful support zone. The Relative Strength Index (RSI) at 54 reflects a neutral to slightly bullish tone. As long as gold maintains its footing above this key level, the uptrend remains intact.
- Key Support Levels: ~$3,300 (short-term), followed by ~$3,240–$3,272 (38.2% Fibonacci retracement).
- Key Resistance Levels: ~$3,360 in the near term, with a breakout above $3,400 potentially resuming the broader bullish trend.
In summary, while short-term technical weakness and profit-taking could introduce volatility, the medium-term trend remains constructive. Strong central bank accumulation, ongoing geopolitical risk, and a softer dollar continue to provide a favorable backdrop for gold heading into the second half of the year.
WTI Market Review and Estimates
WTI crude has recently traded in the $66–69 per barrel range, supported by seasonal summer demand, tight physical inventories, and heightened geopolitical risk sentiment. According to the International Energy Agency (IEA), July refinery runs, and strong diesel crack spreads are tightening physical supply, even as headline output forecasts have been revised upward due to higher OPEC+ production. However, the IEA also trimmed its 2025 global oil demand forecast by 20,000 barrels per day, projecting growth of just 700,000 b/d—the slowest annual pace since 2009 (excluding the pandemic years). The agency cited weakening consumption in tariff-sensitive economies such as China, South Korea, Japan, and Mexico.
On the supply side, global output is expected to increase by 2.1 million b/d in 2025, led by both OPEC+ and non-OPEC producers. Despite this, the tightness in the summer physical market has helped keep prices firm. Last week, Brent rose by approximately 3%, while WTI gained around 2.2%.
In the U.S., drilling activity continues to decline. Baker Hughes reported the 11th consecutive weekly drop in active rigs, with U.S. oil rigs falling by one to 424, the lowest level since September 2021. Total rigs now stand at 537. This sustained contraction in drilling suggests U.S. crude production could slow further unless prices rise meaningfully.
WTI Outlook for the Week Ahead
Despite increased output from OPEC+, the U.S., and other producers, the IEA’s lower demand forecast points to a potential supply surplus by late 2025. However, seasonal physical constraints—driven by peak refinery runs and high summer fuel usage (jet fuel and diesel)—are expected to keep inventories tight and support prices in the near term.
U.S. domestic supply signals also remain price supportive. With rig counts at multi-year lows and capital discipline still in effect, exploration and production (E&P) activity is likely to stay subdued unless there’s a marked pickup in demand.
Geopolitical risks also remain in focus. Any escalation in Middle East tensions or the introduction of new U.S. sanctions or tariffs could further disrupt market sentiment and drive prices higher.
Overall, WTI is expected to remain range-bound with a bullish bias, likely holding above $65 per barrel. The market faces a tug-of-war: on one side, weakening demand prospects; on the other, tight physical supply and production constraints. A breakout above $70–72 could materialize if geopolitical risks intensify or U.S. inventory draws accelerate. Conversely, a move below $65 could signal that demand concerns are becoming dominant, potentially weighing on producer activity and price stability.
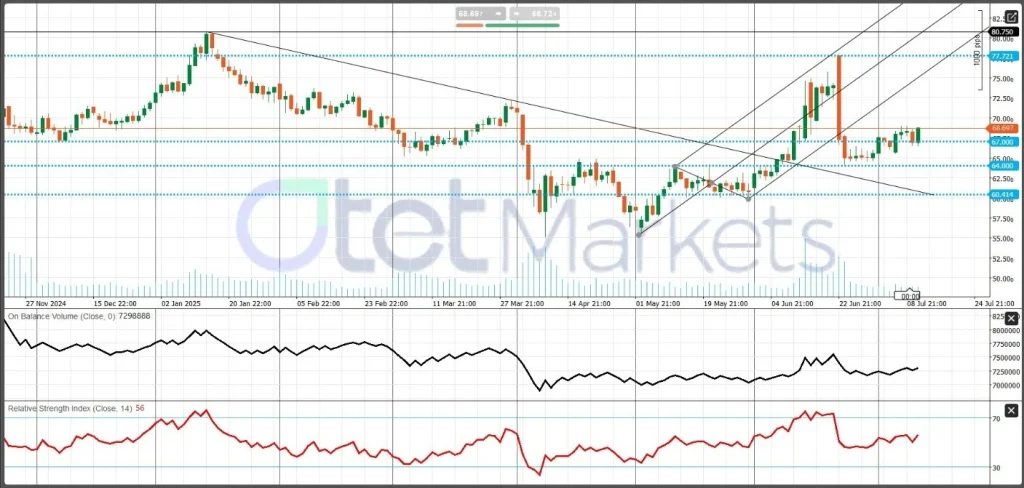
Technical Outlook
The strong uptrend seen earlier in the year has faded, but bullish momentum remains intact. The Relative Strength Index (RSI) stands at 56, indicating neutral-to-positive conditions. Meanwhile, On-Balance Volume (OBV) suggests continued accumulation, reflecting resilient buying interest on dips.
As long as WTI holds above key technical support near $65, short-term price action may remain constructive, with upside potential toward the $72 level if market catalysts align.
Bitcoin Market Review
Bitcoin has surged to new all-time highs, recently trading around $118,100, driven by a major technical breakout above the $111K–$112K range and a sharp short squeeze that liquidated over $1 billion in bearish positions. Momentum remains robust, underpinned by significant spot Bitcoin ETF inflows—now totaling approximately $51 billion year-to-date—and growing adoption among institutional investors and corporations.
Key drivers of this rally include the anticipated Federal Reserve rate cut in September, positive regulatory developments from U.S. crypto legislation, and intensified attention during “Crypto Week”. From a technical standpoint, Bitcoin has broken out of a descending channel, reclaiming key resistance around $110K, with RSI readings indicating strong but not yet overbought momentum.
Still, caution is warranted. Analysts at HSBC and Citi have warned that sentiment could reverse, particularly if ETF inflows slowly. Citi, in particular, forecasts a possible retracement toward $100K should bullish momentum fade.
BTC Weekly Outlook (July 14–18)
Bitcoin enters Week 29 with a bullish tone, supported by favorable technical structure, institutional inflows, and optimistic regulatory signals. The $120K level stands as a critical resistance point; a decisive breakout could open the path toward $125K–$134K, or even $140K, if bullish momentum continues. However, a near-term pullback or consolidation toward the $108K–$100K range remains possible if sentiment cools or macroeconomic risks intensify.
Ongoing record-high ETF inflows and expectations for regulatory clarity from U.S. lawmakers during Crypto Week could continue to provide a positive backdrop. Conversely, any shift toward stricter regulations or delays in the Fed’s rate-cut timeline could act as a drag on price action.
Institutional activity also appears supportive. Whale wallet activity is increasing, and basis rates remain elevated—both signs of sustained institutional demand. Some analysts forecast an additional ~16% rise through mid-July, with upside targets around $132K.
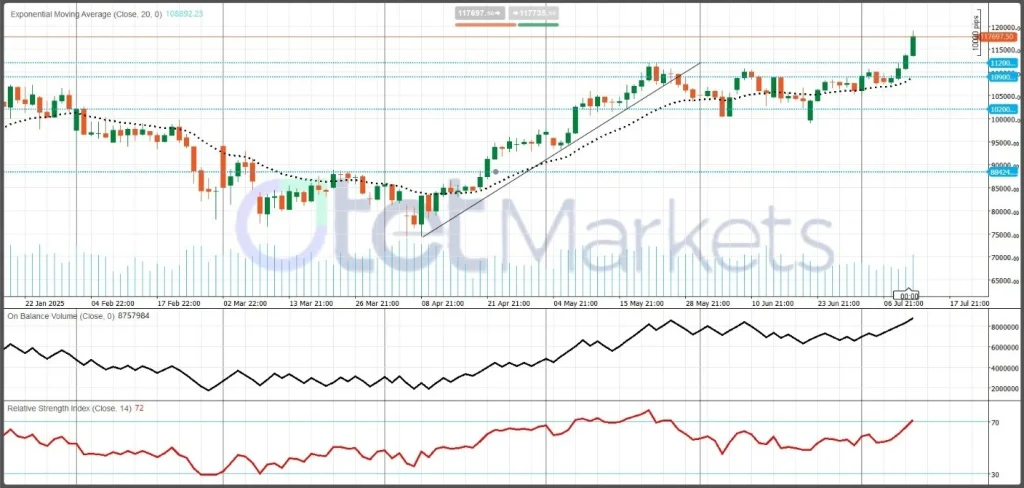
Technical Setup
Bitcoin continues to trade within a bullish channel. Key technical levels include:
- Support:
- $109,000 (20-day EMA)
- $107,000, with deeper support near $100,000
- Resistance:
- $120,000 (immediate resistance)
- A breakout could target $125,000–$134,000, based on Fibonacci extensions and trend projection
- Momentum:
- The RSI is near 72, reflecting strong momentum with some room before reaching overbought territory
Share
Hot topics

What is News Trading in Forex? A Complete Guide to Event-Driven Strategy
Introduction If you have ever watched the forex market during a major economic announcement, you know how dramatic it can be. Prices jump within seconds. Spreads widen. Volatility explodes. For...
Read more


Submit comment
Your email address will not be published. Required fields are marked *