
Global Market Outlook in a short end week, Happy Thanksgiving!
Global Market Outlook heads into a holiday-shortened week with U.S. Thanksgiving shaping both liquidity and price action. With fewer trading sessions and thinner participation, markets may see sharper, more headline-sensitive moves than usual, especially around key macro releases and central-bank communication.
U.S. Economy Weekly Review — Resilient Growth with Clear Signs of Cooling
U.S. economic data this week reflected an economy that remains resilient on the surface, even as several underlying indicators point to a gradual cooling phase. Growth momentum is still supported by solid services activity, improving external balances, and steady—though moderating—business investment. However, the labor market, housing activity, and parts of manufacturing continue to soften, shaping a more balanced but uneven macro picture heading into year-end.
Data delayed by the government shutdown offered mixed signals for the Federal Reserve. The latest non-farm payrolls report showed 119K new jobs, downward revisions to prior months, and an uptick in the unemployment rate to 4.44%, signaling a slow but steady easing in labor demand. Wage growth has also moderated, with average hourly earnings rising just 0.2% MoM and 3.8% YoY, consistent with cooling inflation pressures. Jobless claims continued to rise, and ADP data showed marginal private-sector job losses, reinforcing a picture of a still-functioning but less dynamic job market.
Despite the cooling labor backdrop, the Fed remains divided ahead of the December meeting. Some officials favor maintaining current rates, while others see justification for a 25-bps cut to support slowing activity. The next CPI and jobs reports will arrive after the December meeting, leaving policymakers dependent on partial data and market pricing, which ended the week with higher odds of a cut.
On the growth front, business activity remains generally positive. S&P Global PMIs stayed in expansion territory, driven by services, while manufacturing signals were mixed. Hard data such as factory orders and durable goods suggest moderate but not accelerating capex. Construction spending improved modestly but remained lower on a yearly basis due to elevated financing and input costs. Externally, the trade deficit narrowed, and capital inflows were strong, helping lift the Atlanta Fed GDPNow estimate for Q4 to 4.2%, highlighting ongoing economic resilience.
Housing remains a key soft spot. Higher mortgage rates continue to suppress demand, with applications and builder sentiment both subdued. Meanwhile, credit conditions remain tight, and market yields elevated, reinforcing the drag from higher borrowing costs.
Financial conditions were stable overall: Treasury auctions cleared smoothly at slightly higher yields, the U.S. dollar firmed modestly, and markets priced a slower pace of Fed easing.
Bottom line: The U.S. economy remains on a path of resilient but gradually slowing expansion—strong enough to avoid near-term recession risks, yet clearly cooling across jobs, wages, housing, and manufacturing. The Fed is likely to maintain a patient stance as the economy transitions away from overheating toward a more sustainable, balanced growth profile.
U.S. Economic Outlook – Week of 24–29 November 2025
The upcoming holiday-shortened week is one of the most pivotal of Q4, as the Federal Reserve receives its final batch of delayed economic data ahead of the December 9–10 FOMC meeting. With October CPI cancelled and November CPI and employment reports arriving only after the meeting, this week’s releases—September retail sales, PPI, durable goods, the Q3 GDP second estimate, and the September/quarterly PCE inflation—will heavily influence policy expectations.
Markets enter the week with a picture of an economy that has remained remarkably resilient. Q2 GDP expanded at 3.8%, and the Atlanta Fed’s GDPNow model points to 4.2% growth in Q3. The labor market also surprised to the upside in September, adding 119k jobs, with unemployment at 4.4%. Yet despite these firm numbers, Fed policymakers are deeply divided. Dovish comments from NY Fed President John Williams pushed market pricing for a December rate cut from ~40% to as high as 70%, leaving incoming data as the decisive factor.
Tuesday’s releases center on September Retail Sales, giving a long-delayed view of consumer momentum. Expectations call for a softer but still positive 0.4% gain, reflecting pressure on middle- and lower-income households. The PPI report—in lieu of October CPI—will be key for interpreting pipeline inflation. Additional indicators like Case-Shiller home prices, Pending Home Sales, and Consumer Confidence will round out the consumption outlook. Confidence remains weak: the Conference Board index fell to 94.6 in October, with job perceptions deteriorating and households increasingly worried about income prospects.
Wednesday delivers the biggest data wave of the week. Durable goods orders, Weekly Jobless Claims, Advance Trade, New Home Sales, Chicago PMI, the Beige Book, and most importantly PCE and Core PCE all land at 08:30 ET. Durable goods have been a bright spot, driven by tech-related investment and expected to rise again in September. For inflation, Core PCE is expected at 0.2% MoM, keeping the YoY rate at 2.9%, consistent with steady disinflation.
Overall, September and Q3 PCE data are likely to reinforce a soft-landing narrative: cooling inflation, steady income growth, and gradually slowing consumer spending. For markets, the bias leans modestly dovish—unless inflation or spending prints surprise to the upside, which could quickly revive fears that the Fed may skip a December cut.
USD and Wall Street in the week ahead
For the week ahead, the US Dollar and Wall Street are both on a short leash to PCE, retail sales, and durable goods.
If the data confirm a soft-landing mix—cooling inflation, slower but positive spending—the dollar should trade sideways to slightly softer and US equities can stabilise with a modest pro-growth bias. Any upside surprise in inflation or activity, however, risks reviving “no-cut” pricing, pushing yields and the dollar higher and putting renewed pressure on stretched tech and AI valuations.
U.S. Dollar – Data-Dependent, Slightly Dovish Bias but With Clear Upside Risks
The U.S. dollar begins the week caught between softer Federal Reserve expectations and still-solid U.S. economic fundamentals. The Fed’s stance remains firmly data-dependent, with a mild tilt toward easing given progress on disinflation and the broader “soft-landing” narrative. If this week’s key indicators—PCE, retail sales, durable goods, and jobless claims—come in broadly as expected, markets are likely to lean slightly more dovish, keeping the DXY range-bound to mildly softer. In this scenario, the dollar remains supported, but not strong enough to extend a sustained rally, as positioning remains somewhat over-owned.
However, the upside risks are significant. Any combination of strong retail sales, firmer core control, accelerating durable goods/core capex, sticky PCE/Core PCE prints, or improving labor signals would quickly challenge the rate-cut narrative. Such data would push front-end Treasury yields higher and lift the dollar broadly, particularly against major crosses.
Technical Outlook
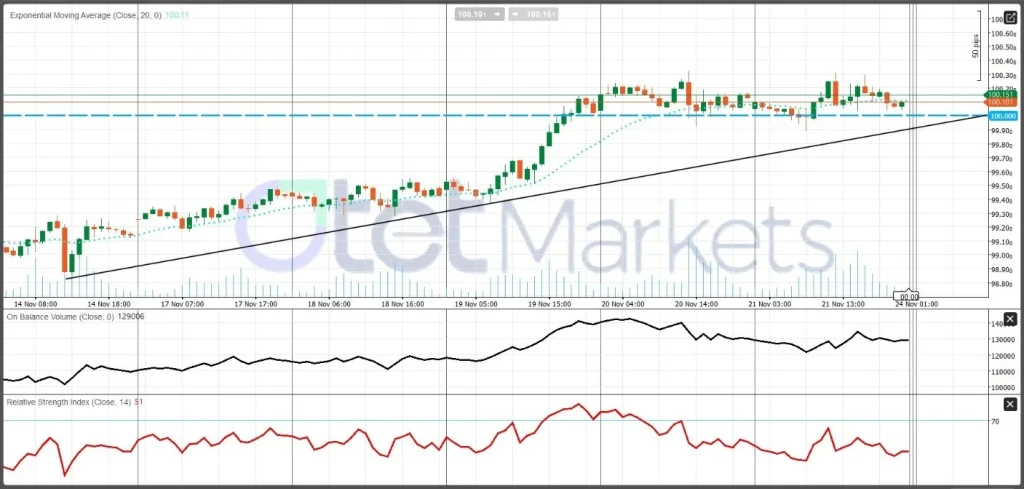
The USD remains mildly bullish above 100.00, supported by a short-term uptrend with price holding above a rising trendline and the EMA20. The recent surge on Nov 19–20 has transitioned into a tight consolidation just above the 100.00 pivot.
- Support: 100.00, then 99.6–99.8
- Resistance: 100.15–100.30
- Momentum: RSI near 51 and flat OBV suggest cooling momentum but no reversal.
Overall, the dollar trades with a neutral-to-slightly-bullish bias, highly sensitive to this week’s data.
Wall Street – Earnings Fatigue, Data Sensitivity, and Fragile Positioning
U.S. equities enter the week in a delicate balance, caught between solid-but-slowing macro data and uncertainty over the Fed’s next move. Growth indicators remain respectable, and inflation continues to ease, keeping the “soft landing” story alive. However, this has not been translated into market conviction. Instead, investors are navigating an environment where earnings momentum has faded, and the market is increasingly sensitive to upcoming macro releases.
This week’s key data—retail sales, durable goods orders, and the GDP revision—will determine whether the economy is cooling from “hot to warm” or still running near a 3–4% real growth pace. A moderate slowdown would be equality-friendly, as it reduces Fed risk and supports a controlled demand environment. But if the data come in too strong, particularly in spending or capex, markets may quickly price out rate-cut expectations and revert to a “higher-for-longer” stance—pressuring equity valuations and risk appetite.
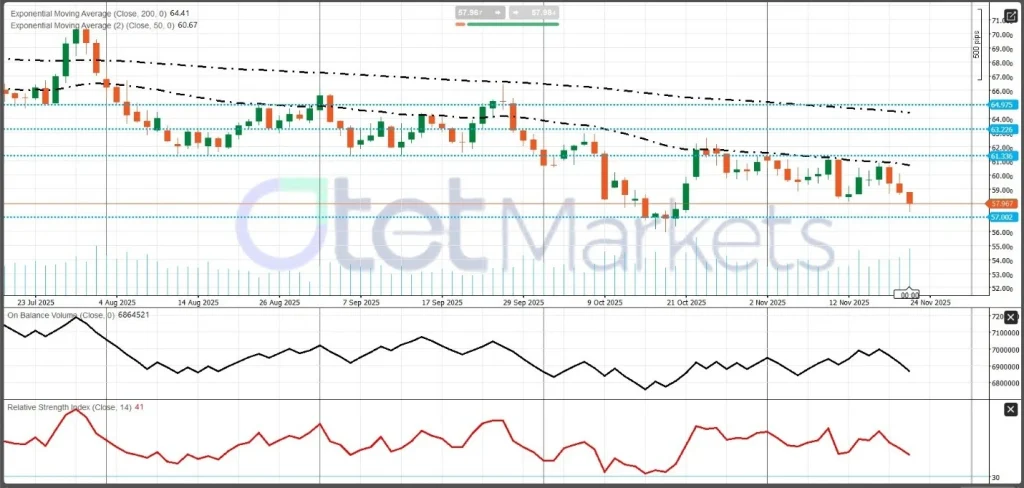
S&P 500 Technical Picture
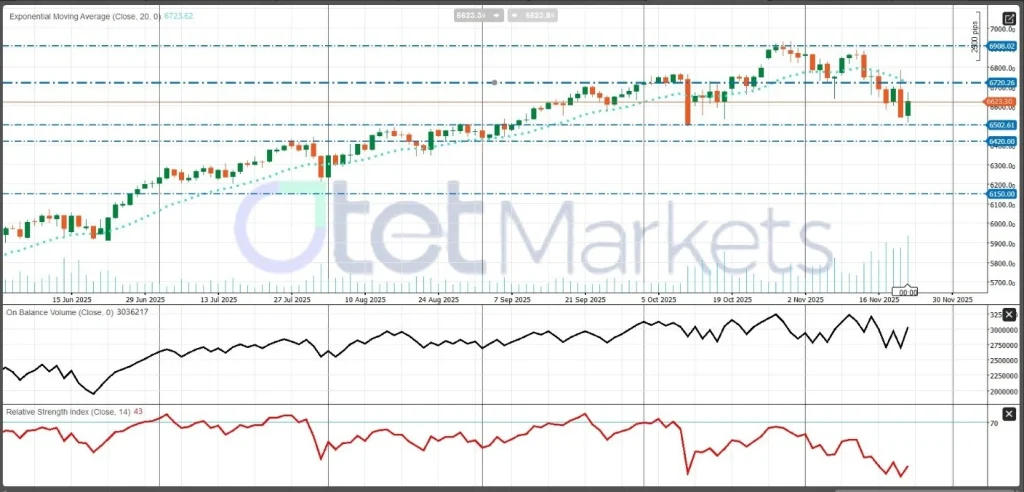
The index remains short-term cautious to bearish below 6720. The medium-term trend is still up, but recent price action marks a clear correction after failing near 6908. Momentum is soft, with RSI near 43 and price trading around the falling EMA20. Rising sell volume and choppy OBV indicate increasing distribution.
- Resistance: 6720–6730, then 6908
- Support: 6620, with major demand at 6500–6420; a break below 6420 opens 6150
Overall, Wall Street trades in a narrow range, highly dependent on this week’s data to determine direction.
New Zealand & RBNZ Policy Outlook
The Reserve Bank of New Zealand (RBNZ) is set to announce its next policy decision in the coming week, with markets widely expecting a 25-bps rate cut, bringing the Official Cash Rate down to 2.25%. This follows the central bank’s larger 50 bps cut in early October, a move driven by subdued economic growth and signs of excess capacity. Recent data has reinforced this softer macro picture: Q3 employment fell 0.6% YoY, the unemployment rate climbed to 5.3%, and wage growth moderated further, indicating that labour-market slack is deepening. Although headline CPI edged up slightly to 3.0% YoY, the rise was driven mostly by temporary factors, leaving underlying price pressure relatively contained. As a result, another small cut remains the most likely outcome.
Across Oceania, both Australia and New Zealand appear firmly in a late-cycle phase, marked by firm but plateauing labour costs, softening demand indicators, and a broadly risk-off global backdrop. A stronger USD and weakening tech sentiment also pressured the Australian dollar and New Zealand dollar, while regional equity markets softened.
New Zealand’s domestic data painted a picture of weak demand and easing inflation momentum. The Performance of Services Index rose marginally to 48.7, but remained below 50, signaling continued contraction in services. The Food Price Index fell 0.3% MoM, extending the cooling trend in consumer-level inflation. Upstream pricing indicators were similarly soft: PPI Input rose just 0.2% QoQ, and PPI Output held at 0.6%, both lower than expectations and consistent with cost pressures.
On the financial side, RBNZ offshore holdings edged up to 58.6%, signaling continued integration with global markets. In FX, the NZD traded broadly in line with regional peers, weighed down by global risk aversion and a firmer USD. Domestic data offered little support, reinforcing a cautious tone.
Overall, New Zealand remains in a soft patch, characterized by subdued services activity, easing inflation, and stable but unspectacular external conditions. From a policy standpoint, this reinforces a “hold with mild easing bias” stance as long as currency markets remain orderly. Across Oceania, economic conditions resemble those of small, open, late-cycle economies: not under acute stress but constrained by slower growth, softer demand, and limited room to diverge from global financial trends—particularly with USD strength capping AUD and NZD performance.
NZDUSD Technical Picture
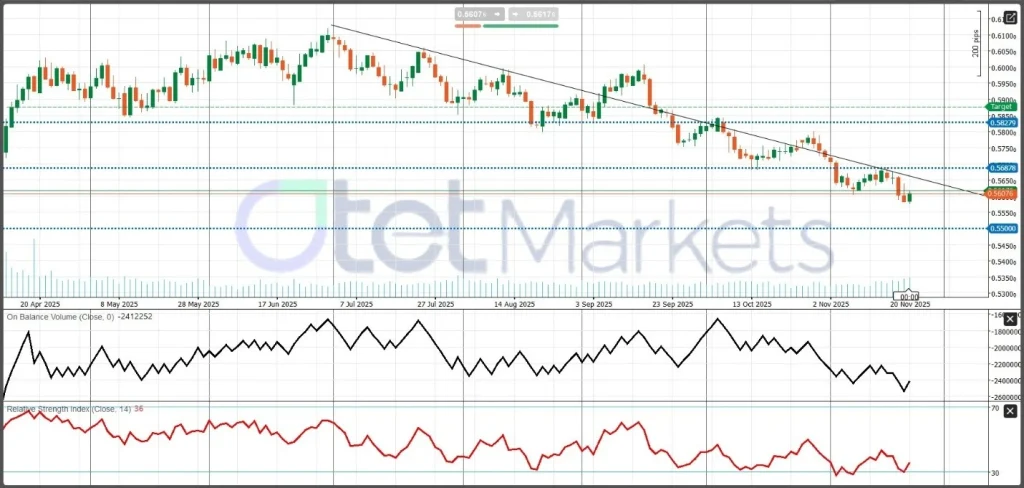
NZDUSD remains bearish below 0.5688, still respecting a clear downtrend. Momentum is weak (RSI ~36), OBV trends lower, and the pair sits below its descending trendline. Key levels include resistance at 0.5688 / 0.5828, and support at 0.5600–0.5580, followed by a major floor at 0.5500.
Gold Market – Weekly Outlook
Gold enters the week with a firm’s underlying foundation, supported by ongoing ETF inflows and steady central-bank buying. However, despite this strong structural demand, price action remains range-bound, with investors awaiting key U.S. data that will shape expectations for the Federal Reserve’s December meeting. The metal maintains a mildly bullish bias above $4,000, with a decisive bullish signal only emerging if price can close firmly above $4,100–$4,120.
Fundamentally, several forces continue to underpin the market. Physically backed gold ETFs posted their fifth straight month of inflows, adding around $8.2bn in October, highlighting persistent institutional interest. Positioning in futures markets has eased, with CFTC net longs below September levels but still positive, suggesting a less crowded market and room for new long exposure if macro conditions become supportive. Meanwhile, central-bank demand remains a strong structural tailwind, consistently providing a floor during pullbacks.
At the same time, gold remains highly sensitive to movements in U.S. real yields and the dollar. Recent moderation in Fed rate-cut expectations and a steadier USD have limited upside momentum near the top of the current range.
This holiday-shortened U.S. week (Thanksgiving) may produce thinner liquidity and exaggerated moves. Key catalysts include October PCE inflation, Durable Goods, Initial Jobless Claims, and the second estimate of Q3 GDP—all of which feed directly into the market’s expectations for the December FOMC. Shutdown-delayed data such as PPI and retail sales, plus several Fed speeches, create additional potential for sentiment swings.
Scenario Outlook
- Upside: If PCE and economic activity show cooling inflation and softer growth, rate-cut expectations may firm, real yields could ease, and gold may make another attempt at the $4,100–$4,120 breakout zone.
- Downside: Stronger-than-expected spending or sticky inflation could push yields and the USD higher, driving gold back toward $4,020–$4,000 support. A renewed USD rally remains the clearest downside risk.
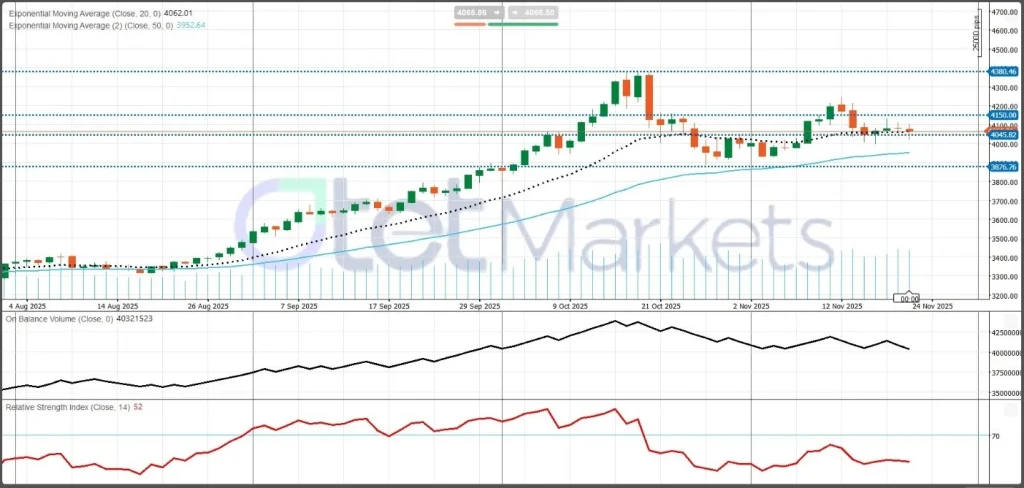
Technical landscape supports a neutral-to-bullish stance. The medium-term trend is still constructive, with price above the rising EMA50 (~$3,953). Short-term consolidation around the EMA20 (~$4,062) reflects a pause rather than a reversal. Momentum is neutral (RSI ~52), and OBV shows cooling but not reversing pressure.
Key levels:
- Resistance: $4,100–$4,150; above that, $4,380.
- Support: $4,045–$4,000; below that, $3,876.
Energy Market — Current Conditions & Weekly Outlook
The energy complex remains in a soft patch, with Brent around $62/bbl and WTI in the high-$50s, reflecting a market that is still supply-heavy and uncertain on demand. OPEC+ has confirmed a modest December output increase (~137 kb/d) but signaled concern about winter oversupply by pausing further hikes in Q1 2026. That pause is helping to stabilize prices at the margin, yet it has not been enough to shift the broader tone away from bearish. The EIA’s latest STEO reinforces this bias, projecting global inventories rising through 2026, keeping medium-term price pressure tilted lower. Geopolitical risk premia have eased somewhat, though sanctions uncertainty around Russian flows continues to add two-way volatility rather than a clear bullish impulse. In contrast, U.S. natural gas (Henry Hub ~ $4.5/MMBtu) is firmer, supported by seasonal heating demand and stronger LNG export pull.
This week’s price action was a tug of war between headlines and fundamentals. Crude gave back prior gains after Russia resumed loadings at the Novorossiysk Black Sea hub, reducing immediate supply fears and pushing Brent and WTI lower. However, geopolitical risk still intensified in the background: Ukraine struck major Russian refineries, and the U.S. escalated sanctions targeting Lukoil and Rosneft, while also warning of possible secondary sanctions on countries trading with Russia. These steps do not remove barrels instantly, but they raise friction around logistics, insurance, and financing, especially for refined products—keeping a floor under prices.
U.S. inventory data were mixed. The API reported a surprise crude build, but the EIA showed a meaningful crude draw (–3.4M bbl) and tighter Cushing stocks, largely due to lower imports. That was supportive for WTI. The bearish element was in products: gasoline and distillates built despite slightly higher runs, hinting at sluggish end-user demand heading into winter. On the supply side, Baker Hughes rig counts ticked higher, signaling shale stability rather than a surge.
Looking ahead, a Thanksgiving-shortened U.S. week could amplify moves in thinner liquidity. The key drivers are the EIA petroleum status report and the Nov. 30 OPEC+ meeting. Base case remains soft oil/supported gas: continued product builds or weak demand keep crude heavy unless OPEC+ turns more restrictive. Upside risk comes from tighter product balances, firmer OPEC+ compliance rhetoric, or renewed disruptions; downside risk from oversupply signals and a stronger USD.
Technically, WTI stays in a clear downtrend below $60–61 (EMA50 zone). $57 is the immediate floor; a break opens $55 then $52. Resistance sits at $60.7–61.3, then $63–65. Overall, bears control structure unless prices reclaim the upper band.
Crypto Market — Current Conditions & Weekly BTC Outlook
The crypto market is still working through a clear risk-off correction after the sharp October blow-off. The rally peak has been followed by broad deleveraging, leaving sentiment cautious and volatility elevated. Total market capitalization sits near $2.95 trillion, while Bitcoin dominance around 56–57% underscores BTC’s continued role as the main directional anchor for the entire complex. Bitcoin itself is consolidating in the $80k–$90k zone after a multi-week decline, with large intraday swings showing that positioning remains fragile and conviction is low.
Spot ETF flows have been the most visible headwind. U.S. spot Bitcoin ETFs have recorded heavy net outflows this month, especially driven by large redemptions from IBIT, which has weakened dip-buying confidence. A handful of recent sessions showed small, uneven inflows, but the flow trend has not stabilized enough to signal a clear inflection. In the broader market, ETH and large-cap altcoins have underperformed BTC, consistent with a defensive rotation toward liquidity during stress periods. Derivatives conditions look cleaner but thinner: funding/basis and open interest have cooled notably, reducing near-term forced-selling risk, yet also removing the leverage fuel that typically powers a fast V-shaped recovery.
Looking into the week ahead, BTC and the wider market are still digesting this leverage-driven reset. Direction hinges on two variables: U.S. macro outcomes and whether ETF outflows show sustained stabilization. Because the U.S. week is shortened by Thanksgiving, liquidity may be patchy, raising the likelihood of exaggerated, headline-driven moves. The key external inputs are U.S. PCE inflation, GDP revision, durable goods, jobless claims, and Fed communication, all of which will shape real-yield expectations and broader risk appetite. ETF flow behavior remains the most direct crypto-specific signal: persistent outflows keep rallies capped, while consistent inflows would be the clearest near-term bullish catalyst. A renewed rebound in leverage—after earlier liquidation waves—would also materially affect the speed and direction of any move.
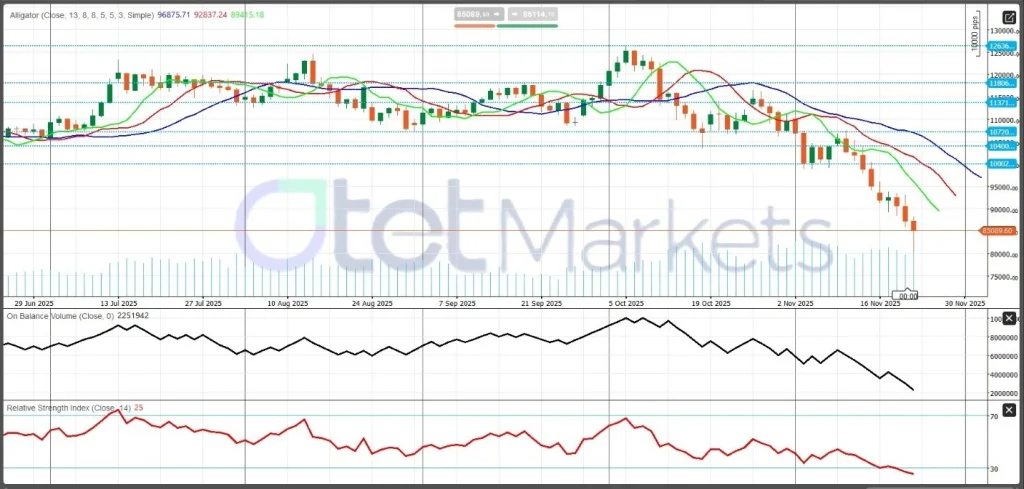
Technically, BTC remains bearishly biased below 95k–100k. The structure has shifted into a strong short-term downtrend since early October, with lower highs and lower lows and bearish moving-average alignment. Momentum is deeply oversold (RSI ~25), which raises bounce risk, but falling OBV confirms ongoing distribution. Immediate support sits near ~85k, then 80k–75k; resistance is 90k–95k, then 100k–104k, with heavier supply above. Bottom line: oversold conditions may produce tactical rebounds, but a trend change requires stabilizing ETF flows and a reclaim of 95k–100k.
Share
Hot topics

What is Balance in Forex? A Complete Guide for Traders
Introduction When you open a trading account for the first time, one of the first numbers you see on your screen is your balance. It looks simple. It looks clear....
Read more


Submit comment
Your email address will not be published. Required fields are marked *