
US Core PCE Inflation Rises in May 2025 as Income and Spending Decline
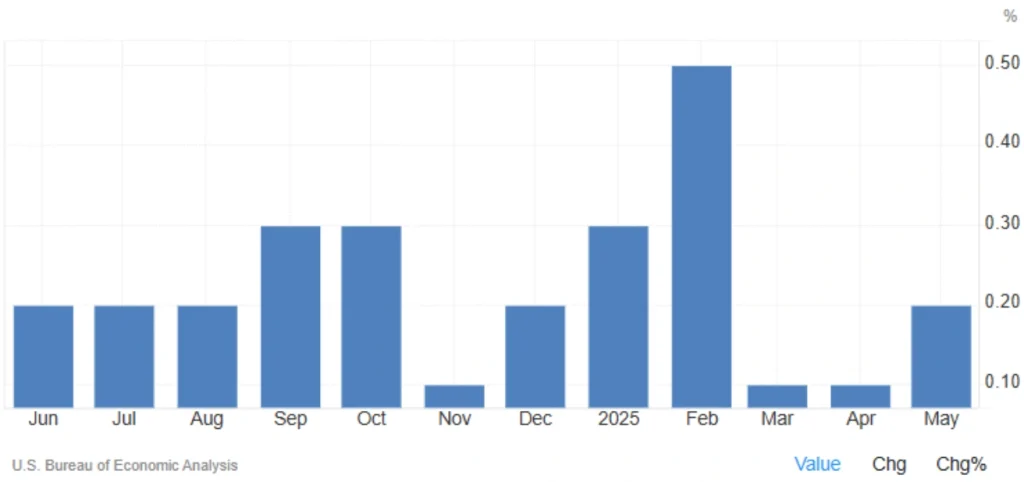
Despite hopes for a broader disinflation trend, core inflation (the Fed’s preferred metric) rose 0.2% in May, in line with forecasts. On a yearly basis, however, the Core PCE came in at 2.7%, slightly higher than the market’s expectation of 2.6%. This rise in US Core PCE inflation indicates persistent price pressures.
Meanwhile, U.S. personal income dropped by 0.4%, marking the first monthly decline since September 2021. Consumer spending also fell by 0.1%, disappointing forecasts of mild growth, further complicating the US Core PCE inflation scenario.
Key U.S. Economic Data – May 2025
| Indicator | May 2025 | Forecast | Previous (Revised) |
|---|---|---|---|
| 🔸 Core PCE MoM | +0.2% | +0.2% | +0.2% |
| 🔸 Core PCE YoY | +2.7% | +2.6% | +2.8% |
| 🔻 Personal Income | -0.4% | -0.3% | +0.7% |
| 🔻 Personal Spending (PCE) | -0.1% | +0.1% | +0.2% |
| 🔻 Real Disposable Income | -0.7% | — | +0.8% |
Educational Insight: What Is Core PCE?
The Core Personal Consumption Expenditures (Core PCE) index tracks the prices of goods and services, excluding the volatile food and energy sectors. It’s the Federal Reserve’s go-to gauge for assessing underlying US Core PCE inflation.
🔍 Unlike CPI, Core PCE adjusts for consumer behavior and substitution — making it a more nuanced measure of real-life inflation.
💡 Example: If red meat prices rise and consumers switch to chicken, Core PCE factors in that shift, reflecting the true cost burden on households more accurately.
Market Impact Analysis
🔺 Inflation Still Sticky
The uptick in core inflation to 2.7% YoY suggests underlying price pressures remain persistent. This complicates expectations for near-term rate cuts from the Fed. Consequently, the US Core PCE inflation proves to be a significant factor in economic forecasting.
🔻 Falling Income & Spending
The 0.4% drop in personal income and a decline in consumer spending highlight potential weakening in demand, raising concerns about a slowdown in economic momentum, against the backdrop of US Core PCE inflation.
Read More: What Is the PCE Index and Why Is It Important in Markets?
Cross-Market Reactions
| Market | Implication |
|---|---|
| 💵 Forex | Likely bullish for USD due to sticky inflation |
| 📉 Equities | Pressure on consumer-related sectors; risk-off mood |
| 📊 Bonds | Long-term treasuries may gain as growth slows |
| 🪙 Gold | May see inflows as a hedge against stagflation |
Outlook & Policy Scenarios
The May data reveals a mixed picture, elevated inflation paired with declining income and consumption, a situation often referred to as “mild stagflation.” This is particularly concerning given the context of US Core PCE inflation figures.
📌 Short-Term Scenario:
If Core PCE stays above the 2% target, markets must adapt to prolonged high interest rates, heavily influenced by US Core PCE inflation metrics.
📌 Mid-Term Scenario:
If the decline in income and spending deepens — and is matched by weakness in employment and production — pressure may build for the Fed to ease policy, even if inflation remains somewhat elevated.
Bottom Line:
The Federal Reserve faces a tightrope walk — balancing inflation control with growing signs of demand softening. Traders should brace for potential volatility as the market digests this dual narrative of sticky prices and shrinking wallets.
Share
Hot topics

What is News Trading in Forex? A Complete Guide to Event-Driven Strategy
Introduction If you have ever watched the forex market during a major economic announcement, you know how dramatic it can be. Prices jump within seconds. Spreads widen. Volatility explodes. For...
Read more


Submit comment
Your email address will not be published. Required fields are marked *