
US Building Permits Fall to Lowest Level Since June 2020
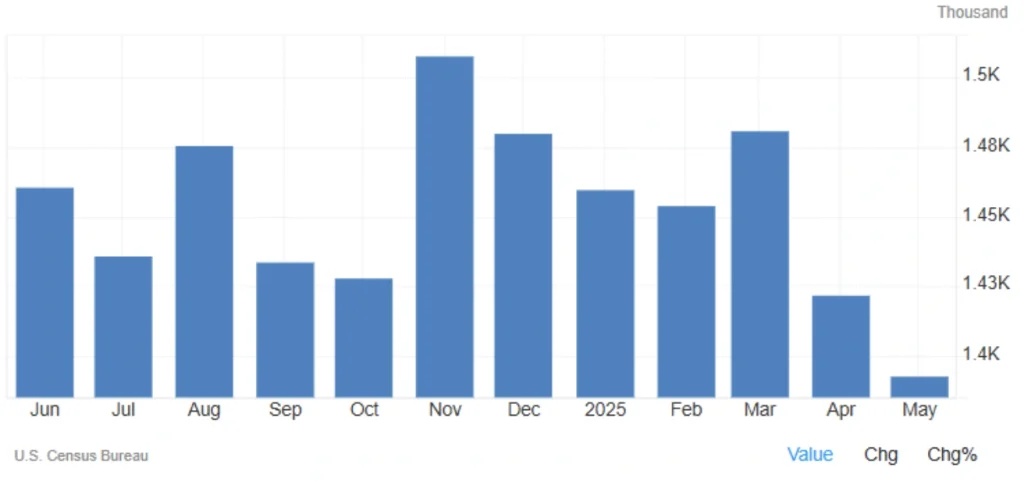
In another sign of slowing momentum in the housing sector, US building permits dropped by 2% in May 2025, falling to an annualized rate of 1.393 million units, the lowest since June 2020 and below market expectations of 1.43 million.
Breakdown of Building Permits
| Category | MoM Change | Annual Rate (thousands) |
|---|---|---|
| Total Permits | ↓ 2% | 1,393 |
| Single-Family Homes | ↓ 2.7% | 898 |
| 5+ Unit Buildings | ↑ 1.4% | 444 |
What Are Building Permits?
👉 Building permits are leading indicators for the housing and construction sectors, signaling future residential development plans.
🔸 Reported as Seasonally Adjusted Annual Rates (SAAR)
🔸 Based on applications filed with local authorities
🔸 A decline often reflects weak demand, higher costs, or builder pessimism about the economic outlook.
Read More: US Producer Price Index Shows Mild Growth in May 2025
Impact Analysis: Another Sign of Housing Market Slowdown
💡 Key Factors Behind the Drop
- High mortgage rates continue to dampen demand — particularly in the single-family segment, which saw the steepest decline.
- New trade tariffs on imported materials like steel and lumber have increased construction costs, discouraging investment in new projects.
✅ The Midwest stood out as the only region with growth, possibly due to lower land and construction costs.
What Does This Mean for the Broader Economy?
📌 The decline in permits, combined with other soft housing data, is a warning sign of weaker demand and investor hesitation.
📌 If this trend continues, we may see:
- Reduced private investment
- Slower GDP growth
- Pressure on policymakers to ease monetary conditions further
Share
Hot topics

What is News Trading in Forex? A Complete Guide to Event-Driven Strategy
Introduction If you have ever watched the forex market during a major economic announcement, you know how dramatic it can be. Prices jump within seconds. Spreads widen. Volatility explodes. For...
Read more


Submit comment
Your email address will not be published. Required fields are marked *