Top 10 forex indicators
Top 10 forex indicators Every Trader Should Know
Introduction
Many forex traders become overwhelmed by looking at price charts. The candles are always moving, and it can seem crazy because of the number of trends forming or breaking, and all the news affecting the markets in seconds. A lot of people will begin to look for the Best Forex Indicators to help them make sense of what appears as chaos.
Indicators are designed to simplify market information. They take price data, sometimes volume data, and convert it into visual signals that help traders interpret direction, strength, and potential turning points. However, indicators are often misunderstood. They are not prediction machines, and they are not shortcuts to guaranteed profit. They are tools — and like any tool, they work best when used correctly.
What Are Forex Indicators and Why Are They Important?
The level of emotions involved, like fear and greed, can create volatility in the financial markets, and to avoid making decisions that are purely driven by emotion you should use an objective method of analysis.
An example of using an objective method of analysis is to look at a technical indicator to see if an upward or downward trend is likely to continue, and if so, this can be determined by measuring the momentum of the indicator.
In this way, a trader may state, “I believe the market will go up,” or “based on the chart pattern and the momentum of the price, it is clear that the market will continue to rise.” Changing how you think about making a trading decision from an emotional place to one based on logic is very important for the eventual success of a trader. Indicators can help reduce the level of uncertainty associated with making a decision.
How Forex Indicators Help Reduce Emotional Trading
One of the biggest challenges in Forex trading is emotional control. After two losing trades, doubt creeps in. After three winning trades, overconfidence may appear. Indicators help create a rule-based environment.
For example, a trader may decide only to enter when RSI crosses above 50 while price is above a moving average. That rule eliminates impulsive entries based on fear or excitement. Instead of guessing, the trader waits for defined conditions.
This structured approach doesn’t eliminate emotion entirely, but it creates discipline. Over time, discipline becomes more important than finding the Best indicator for forex.
Types of Forex Indicators
The type of forex indicator you will use for analysis is generally divided into the four major types; Trend Indicators, Momentum Indicators, Volatility Indicators and Volume Indicators. Each of these categories has a specific purpose for analysis, and to analyze the differences is critical to your success.
Trend Indicators give you an overall view of what the market is doing, i.e., is the market moving Up, Down, or Sideways? Popular examples of trend indicators are Moving Averages and MACD.
Trend Indicators are smoothing out the price data & also giving you a clear indication of where the price is generally headed.
Example of Application: It can be used to determine if the market is moving in one direction, or if it is moving sideways.
Advantages of Trend Indicators: They are easy to use and work well in a trending market, either up or down.
Disadvantages of Trend Indicators: They lag behind price, and can give an inaccurate signal about the market turning.
Trend indicators are best used by traders who want to follow momentum type trades, rather than try to trade reversals.
Features: They show overbought and oversold levels.
Applications: Used to detect potential exhaustion or reversals.
Advantages: Good for entry timing.
Disadvantages: Can give false signals in strong trends.
Momentum tools are often considered Professional Forex indicators because they help refine entries rather than simply confirm direction.
Volatility Indicators
Volatility indicators measure how much price fluctuates. Bollinger Bands and ATR are key examples.
Features: Expand during high volatility and contract during low volatility.
Applications: Useful for setting stop-loss and identifying breakout potential.
Advantages: Adaptive to market conditions.
Disadvantages: Do not indicate direction.
Volatility tools are often used alongside trend or momentum indicators to create balance.
Volume Indicators
Volume indicators attempt to measure participation. In Forex, volume is typically tick-based rather than centralized.
Features: Show activity levels.
Applications: Confirm breakout strength.
Advantages: Adds confirmation to price moves.
Disadvantages: Less precise in Forex compared to stocks.
Understanding What is an indicator and its types? allows traders to combine categories intelligently instead of randomly stacking tools.
Detailed Review of the Top 10 Forex Indicators
Now let’s examine the Top 10 forex indicators every trader should understand in detail.
1. Moving Average (or MA): A Moving Average is calculated based on how much something has traded for a period of time. The MA graph will create an illusion as to where price has traded, while giving you a sense of how much price has changed over time, as well as where the market is currently moving overall. The other major Moving Average’s that traders often use to determine longer term trends in the financial markets are a 50-period Moving Averages and a 200-period Moving Average.
2. Exponential Moving Average (or EMA): An EMA is very similar to an MA, however the EMA responds faster than an MA to changes in prices. With this feature, the EMA is often times, the most preferred choice when measuring momentum, due to the fact that it responds rapidly to shifts in momentum.
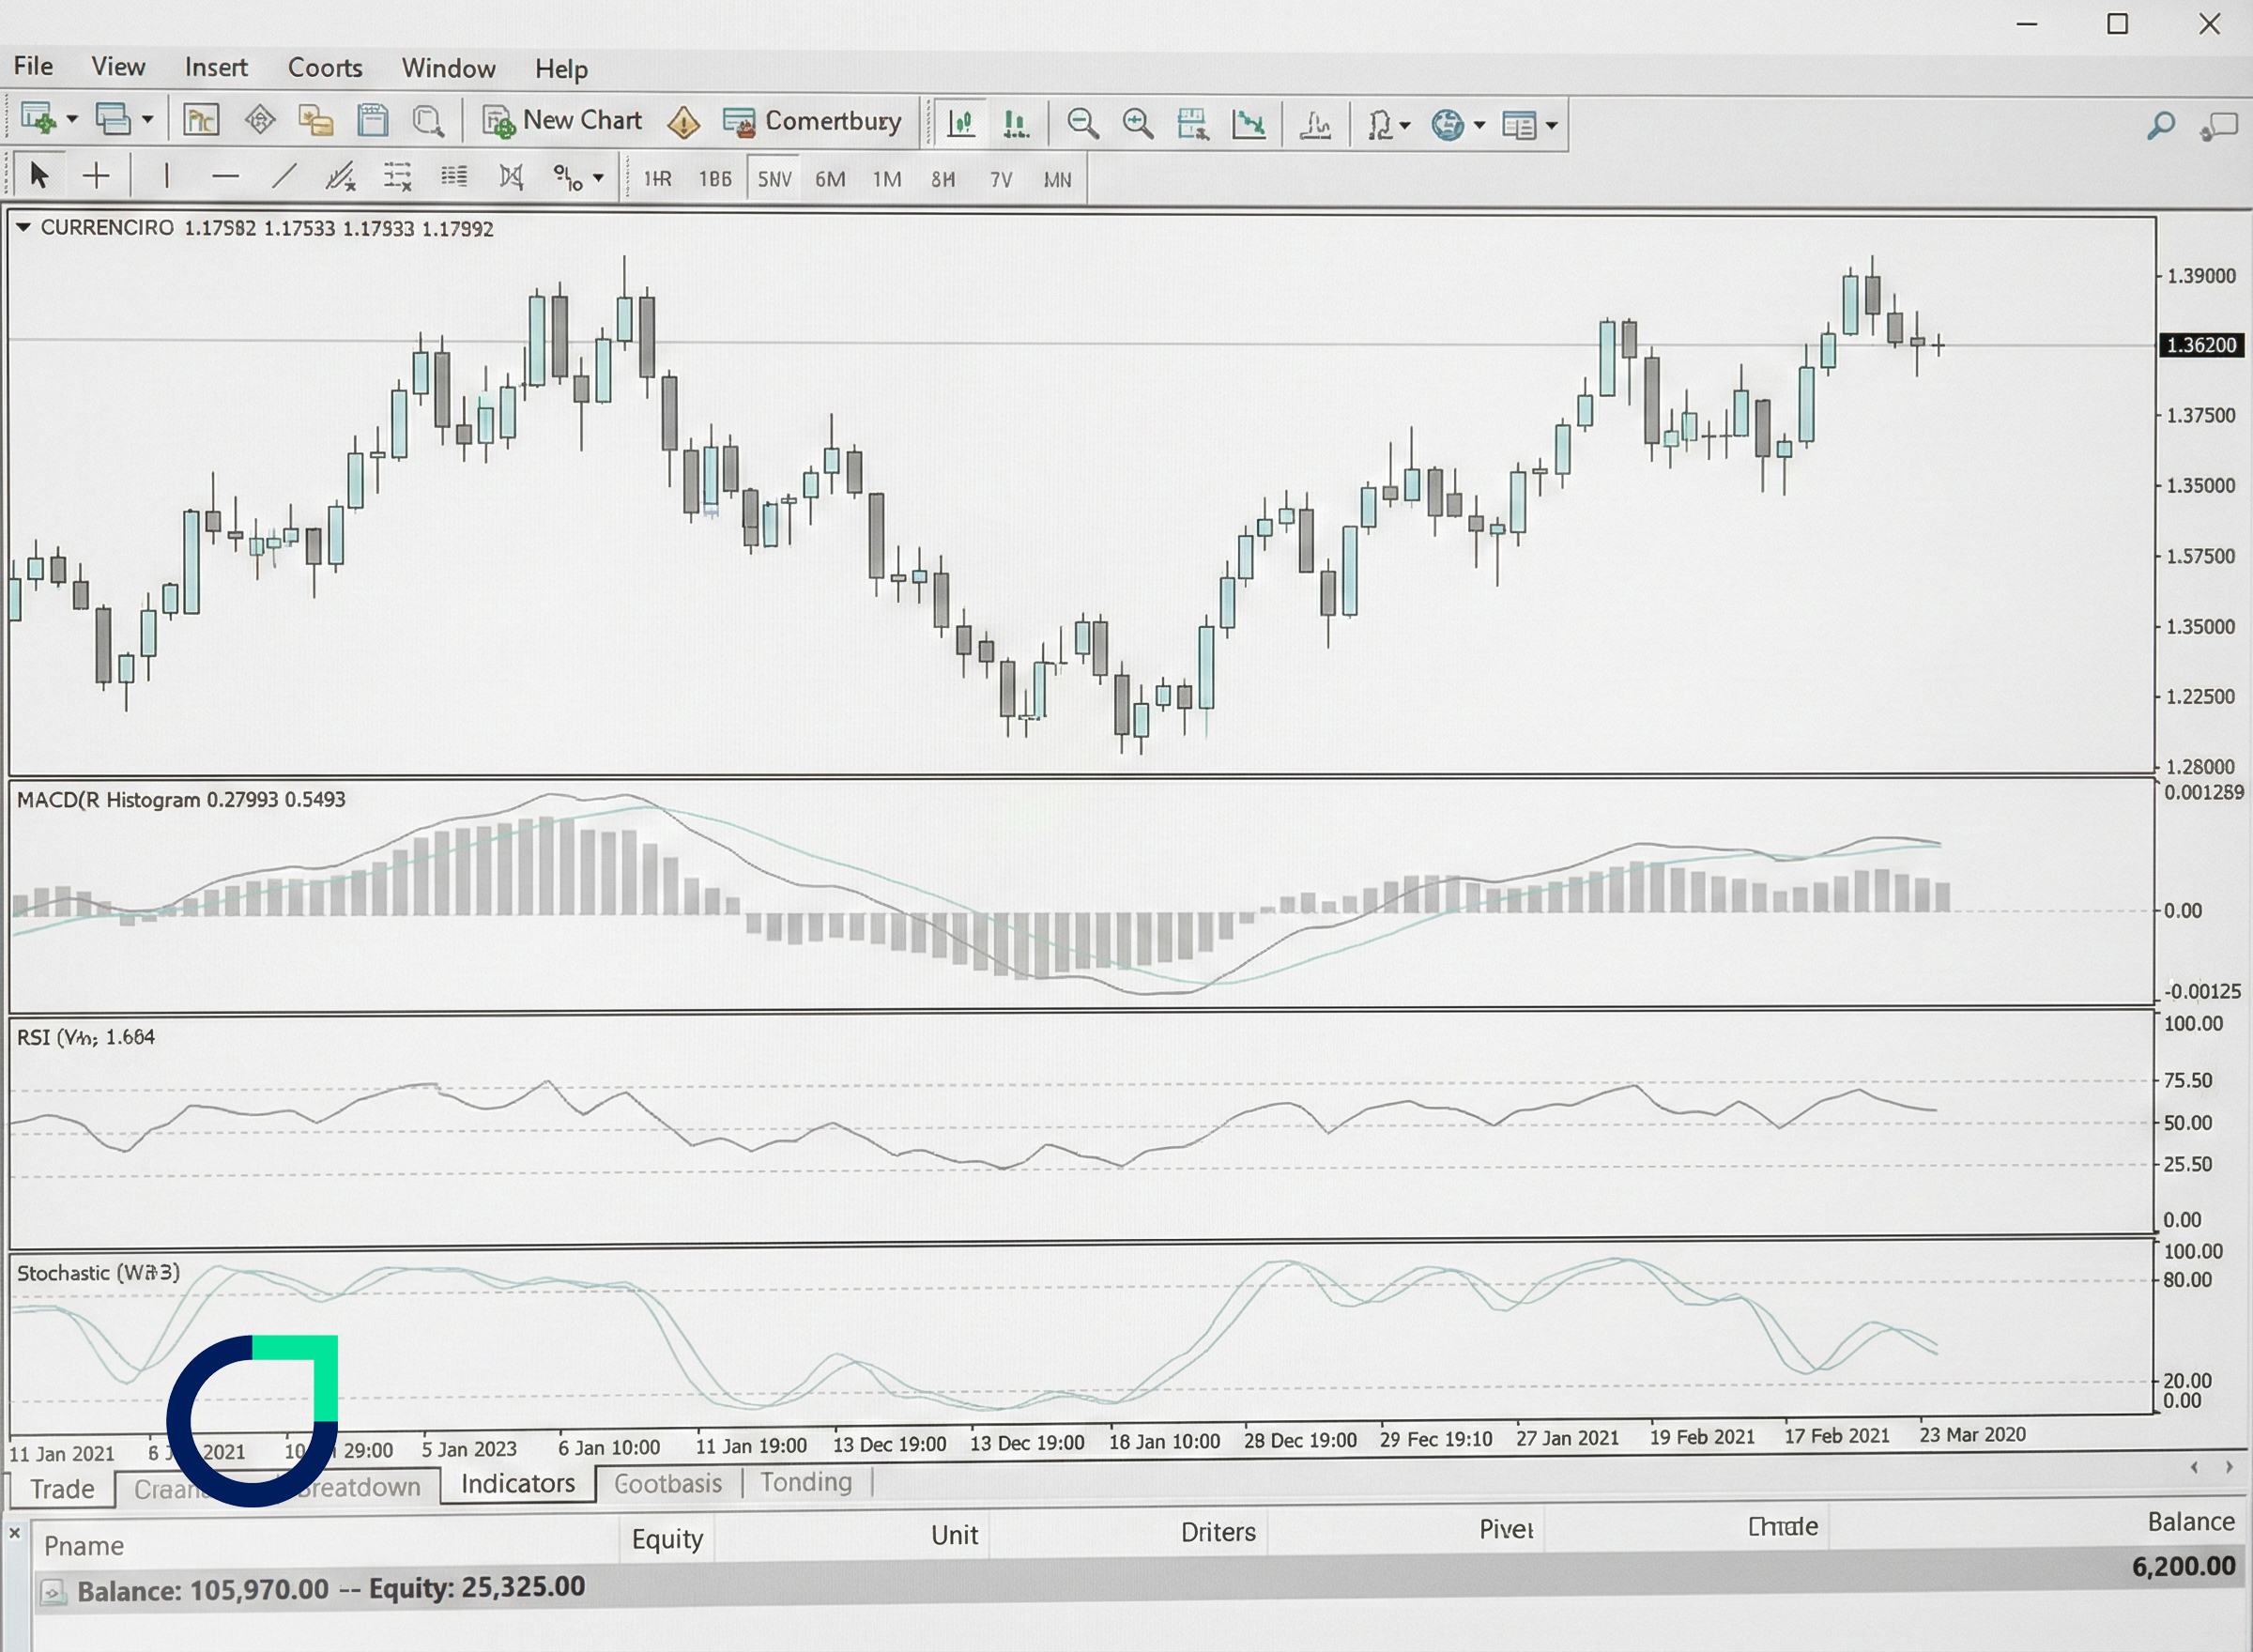
3. MACD: The MACD consists of two moving averages along with a histogram that combine to help traders identify when the momentum has shifted. The crossovers (when the two MAs cross) can help traders identify possible continuation of current trends or possible reversal of current trends.
4. RSI (Relative Strength Indicator): RSI uses a scale of 0 to 100 to measure the relative strength of price movement. RSI value above 70 indicates an overbought condition while RSI values below 30 indicate an oversold condition.
5. Stochastics: Stochastic uses the relationship of a closing price to the recently traded price ranges and are particularly good in flat markets where price may be likely to reverse.
6. Bollinger Bands: Bollinger Bands consist of a moving average line with two outer bands that represent price volatility. When price touches the outer Bollinger Band, traders should anticipate price either breaking out from or pulling back to the moving averages.
7. Average True Range (ATR): ATR is a measure of market volatility to provide traders with a more logical stop-loss distance rather than just picking a number out of the air.
8. Fibonacci Levels: Fibonacci levels can be used to identify potential areas of pullback within the trend or potential reversal of a trend and many traders use these levels in conjunction with moving averages as a means of confirming the areas of interest.
9. Ichimoku Cloud: The Ichimoku Cloud is a complete system in a single visual representation that can provide traders views of the trend, support/resistance and momentum. Although the Ichimoku Cloud may seem complicated initially, it can provide the trader thorough analysis of any market.
10. Parabolic Sar: The Parabolic SAR uses dots at varying locations above or below current price levels as indicators of possible reversal points and possible trailing stop levels.
Best Forex Indicators for Scalping
Scalping requires speed and precision. Traders often use:
- EMA (9 and 20 periods)
- RSI (short timeframe settings)
- Bollinger Bands
- Stochastic Oscillator
Scalpers often search for the Best indicator for forex, but success usually comes from combining a trend tool with a momentum tool rather than relying on one signal.
Best Forex Indicators for Day Trading
Day traders focus on intraday movements. Common tools include:
- 20 & 50 EMA
- MACD
- RSI
- VWAP
These indicators help identify short-term trends and momentum shifts within a single trading session.
Best Indicators for Swing Trading
Swing traders hold positions for days or weeks. They typically use:
- 50 & 200 MA
- RSI
- Fibonacci
- ATR
These tools help identify larger trends and meaningful pullbacks.
Forex indicators list
Below is a comprehensive overview of common Forex indicators and their uses.
| Indicator | Category | Main Use | Key Strength |
| MA | Trend | Identify direction | Simplicity |
| EMA | Trend | Faster trend signals | Responsiveness |
| MACD | Trend/Momentum | Crossovers & divergence | Dual insight |
| RSI | Momentum | Overbought/Oversold | Entry timing |
| Stochastic | Momentum | Reversal zones | Sensitivity |
| Bollinger Bands | Volatility | Breakouts | Adaptive |
| ATR | Volatility | Stop placement | Risk control |
| Fibonacci | Retracement | Pullback levels | Structural clarity |
| Ichimoku | Comprehensive | Full analysis | Multi-function |
| Parabolic SAR | Trend | Reversal signals | Visual simplicity |
This Forex indicators list gives traders a structured foundation for further study.
Common Mistakes When Using Forex Indicators
When a trading chart has too many tools, you create one of a trader’s biggest mistakes. When indicators do not agree, they make decisions much more difficult, not easier.
Another common error is to expect perfect accuracy from any tool. No tool can predict the future with 100% certainty; the market is always being affected by many other factors in addition to its own activity, such as news and other global events.
Traders also often use technical indicators in the wrong conditions based on how they are supposed to be used. For example, using RSI in a smooth upward or downward trend without the proper context is going to cause you continual losses.
How to Choose the Best Forex Indicator for Your Trading Style
Choosing the right indicator depends on your personality, timeframe, and risk tolerance.
Trend-following traders may rely on moving averages and MACD. Reversal traders may prefer RSI and Stochastic. Risk-focused traders often use ATR to manage stop placement.
Platforms like the MetaTrader platform and metatrader5 account make testing indicators straightforward. Brokers such as Otet provide access to customizable environments where traders can experiment safely.
Ultimately, the Best forex indicators are the ones that align with your strategy and discipline. Mastery of a few tools is far more powerful than shallow knowledge of many.
Conclusion
Forex indicators are important resources that offer structure and guidance when trading Forex markets. Using them can help reduce emotionally-based trading decisions and consequently help you to identify price trends, how much price is moving (momentum), how unpredictable price is (volatility), and how many market participants are involved in making that trend happen.
However, they cannot guarantee you success regardless of what you do with them. What creates your trading advantage is your understanding of how to effectively combine and consistently use them.
The true key to success in trading forex is to develop a few different trading tools that fit your individual trading style and then focus on mastering those tools rather than continuing to look for more tools. Maintaining disciplined behaviour towards your fundamental rules of trading will likely provide you with greater trading success than using any one indicator alone.
FAQ
Can I trade forex successfully without indicators?
Absolutely, as some price action traders doing this without any indicators. Indicators can help guide decisions, however they are not necessarily must-have tools for successful trade setup.
Is there a 100% accurate forex indicator?
No, because the forex market is influenced by so many different factors, and there are no tools available to give you perfect accuracy with any market.
Which indicator is best for identifying trend reversals?
Momentum-based indicators like the RSI and the MACD are among the most popular options, especially when used in conjunction with support and resistance level analysis.
Share
Hot topics
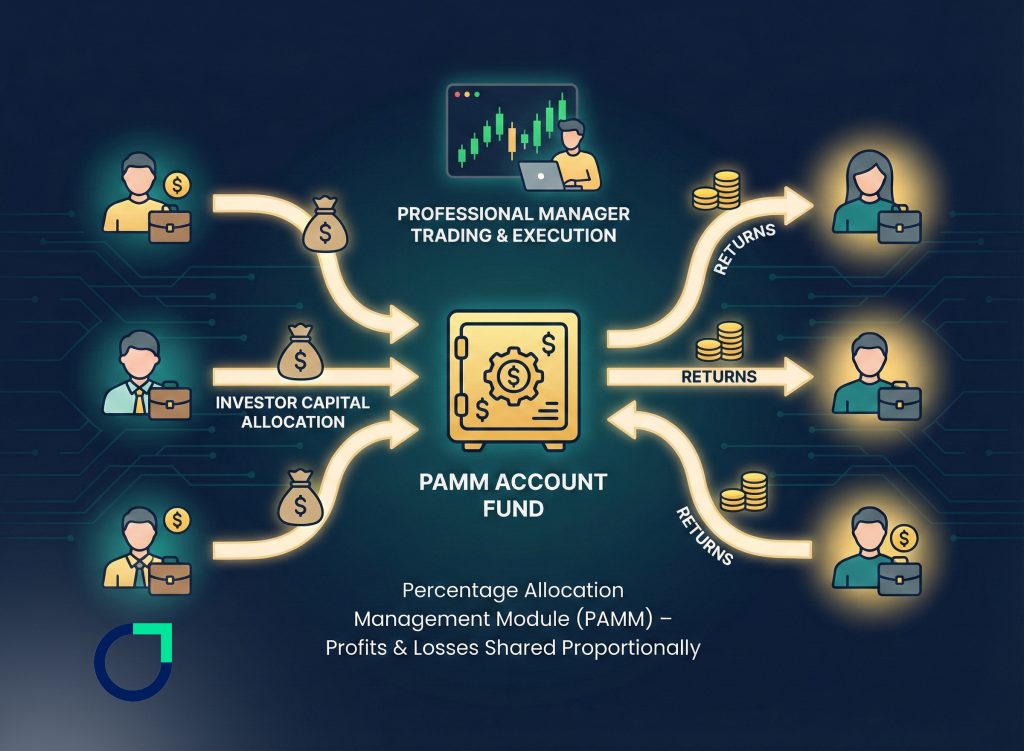
What Is a Forex PAMM Account? Complete Guide
Introduction If you’ve ever wanted to invest in Forex but had reservations about doing it alone, you’re not by yourself! Many people are interested in investing in the Forex market...
Read more


Submit comment
Your email address will not be published. Required fields are marked *