
Understanding Correlation in Financial Markets
Estimated reading time: 8 minutes
Table of contents
- What is Correlation in Financial Markets?
- Pearson Correlation: The Standard Approach for Linear Relationships
- Spearman Correlation: Ranking Relationships and Robustness
- Kendall Correlation: Measuring Agreement in Rankings
- Correlation in Portfolio Construction
- Important Considerations in Correlation Interpretation
- Correlation and Trading Strategies
- Final Thoughts: The Role of Correlation in Smart Investing
In the world of investing, correlation plays a crucial role in how assets interact with each other. Whether you’re building a diversified portfolio or trying to identify new trading opportunities, understanding the relationship between different financial instruments can significantly affect your strategy. In this detailed guide, we’ll explore the concept of correlation in financial markets and how investors can apply three key correlation coefficients—Pearson, Spearman, and Kendall—to assess risk and opportunity in their portfolios.
What is Correlation in Financial Markets?
In financial markets, correlation measures the degree to which two assets move in relation to one another. It tells you whether the prices of two assets are:
- Positively correlated (they move in the same direction).
- Negatively correlated (they move in opposite directions).
- Uncorrelated (no clear relationship in their movement).
The correlation coefficient is typically expressed as a number between -1 and +1:
- +1 means a perfect positive correlation: Both assets move in lockstep.
- -1 means a perfect negative correlation: As one asset rises, the other falls in equal measure.
- 0 means no correlation: The movements of the assets are completely unrelated.
Understanding these correlations allows investors to determine how different assets or securities will perform relative to one another under different market conditions. This insight is invaluable for diversification, risk management, and formulating trading strategies.
Pearson Correlation: The Standard Approach for Linear Relationships
What is Pearson Correlation Used For?
The Pearson correlation coefficient is the most commonly used method for determining the linear relationship between two assets. This method is ideal when:
- The relationship between the asset returns is approximately linear. This means the price movement of one asset can be predicted by a proportional change in another.
- The data does not contain significant outliers (extreme price movements or rare events that distort the data).
How Does Pearson Correlation Work?
Pearson measures the degree of the linear relationship by calculating how well two sets of data points (e.g., the returns of two assets) match up. The calculation assumes that both data sets follow a normal distribution and that the relationship between them is proportional.
A high positive Pearson value (close to +1) indicates that the two assets tend to move in the same direction over time. A negative Pearson value (close to -1) means they tend to move in opposite directions. A Pearson value around 0 indicates no linear relationship.
Limitations of Pearson Correlation
While Pearson correlation is widely used, there are important caveats that investors should be aware of:
- Extreme outliers can distort the Pearson coefficient. For instance, if there’s a market crash or a sudden boom, a few extreme data points can skew the results.
- Non-linear relationships are not captured accurately. Pearson assumes a linear relationship, meaning it may not work well if two assets only behave similarly under certain conditions (like during market downturns) but diverge under normal circumstances.
Real-World Example
Let’s say you are analyzing the daily returns of Apple (AAPL) and Microsoft (MSFT) over a year. If the Pearson correlation coefficient is 0.85, this suggests that the two stocks tend to move in the same direction most of the time. If both stocks rise together, your portfolio would not be well-diversified. If, however, the Pearson correlation were 0 or negative, then adding one stock to your portfolio could reduce overall risk by providing diversification.
Read More: What is Fundamental Analysis? A Comprehensive Guide for Traders
Spearman Correlation: Ranking Relationships and Robustness
Why Use Spearman Correlation?
Spearman’s rank correlation coefficient is more useful than Pearson when you’re dealing with non-linear relationships or want to assess rank-based relationships. Instead of focusing on the raw returns of assets, Spearman evaluates how well the ranks of the returns match up over time. This method is best when:
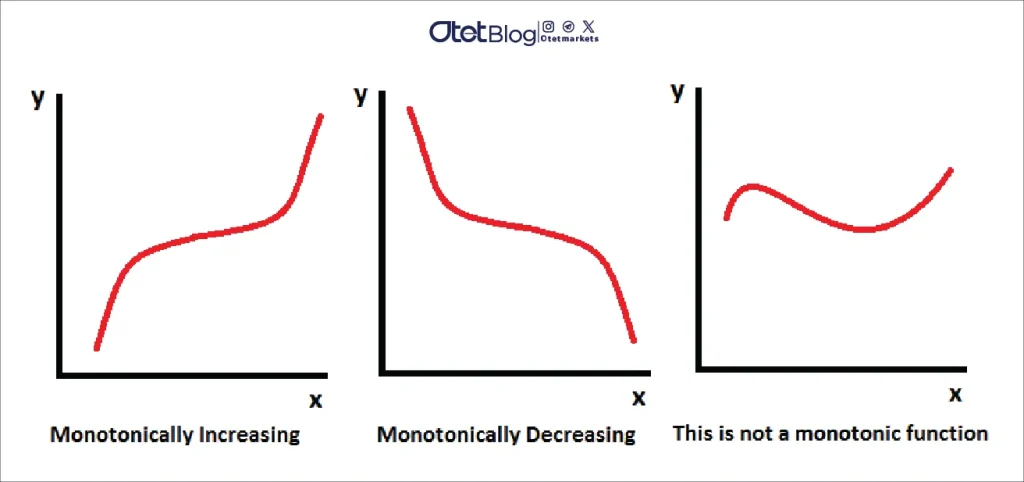
- You believe the relationship is monotonic rather than linear. This means that as one asset increases, the other asset increases (or decreases) consistently, but not necessarily in a proportional manner.
- You need robustness against extreme outliers, as Spearman compares ranks rather than actual values.
How Does Spearman Correlation Work?
Spearman’s rank correlation works by ranking the returns of both assets and then assessing how well the rankings align. If the rankings of the two assets align perfectly, the Spearman correlation is +1. If the rankings are inversely related, the correlation will be -1. A 0 would mean that there’s no monotonic relationship between the two.
Why Spearman is More Robust Than Pearson
Spearman is less sensitive to extreme outliers, making it a more resilient method for evaluating correlation in volatile markets or periods of extreme price movement.
Real-World Example
Let’s look at Bitcoin (BTC) and Ethereum (ETH). These cryptocurrencies don’t always follow a linear pattern. However, during periods of high volatility, their movements tend to align—when one rises sharply, the other often rises in tandem. Spearman correlation would capture this alignment more accurately, even if the relationship is not perfectly linear. Pearson might report a lower correlation because of the non-linear nature of the relationship.
Kendall Correlation: Measuring Agreement in Rankings
What Makes Kendall Different?
The Kendall tau correlation coefficient is another rank-based measure, similar to Spearman, but it focuses on the agreement of ranks rather than their exact values. It’s useful when:
- You’re working with small datasets (such as fewer assets or fewer data points).
- You need to understand the degree of agreement between the rankings of two datasets.
How Does Kendall Correlation Work?
Kendall measures the number of concordant and discordant pairs of ranked data. A concordant pair occurs when the ranks of two assets move in the same direction, while a discordant pair occurs when the ranks move in opposite directions. Kendall then compares these pairs to generate a correlation coefficient.
Real-World Example
Suppose two market analysts rank the top 10 tech stocks based on their annual returns. If their rankings largely overlap, the Kendall tau coefficient will be high, suggesting a strong agreement between their assessments. This information can help investors choose which analysts’ opinions they should prioritize when selecting stocks for their portfolios.
Read More: The Art of Reward and Risk Management: Financial Success
Correlation in Portfolio Construction
One of the most critical uses of correlation in investing is in portfolio diversification. Understanding how different assets correlate with each other allows investors to reduce overall portfolio risk by selecting assets that don’t move in lockstep.
Diversification and Correlation
The principle of diversification aims to combine assets with low correlation so that when one asset falls, another might rise, balancing the overall risk. For example, combining stocks (which are volatile) with bonds (which tend to be more stable) helps reduce the risk of a portfolio.
- If two assets have a high positive correlation, they tend to move together, offering limited diversification benefits.
- If the correlation is low or negative, the assets tend to behave independently, reducing the overall risk of the portfolio.
Matrix of Covariance/Correlation
Professional portfolio managers often use a covariance or correlation matrix to analyze the correlation between all the potential assets in a portfolio. Based on this analysis, they use optimization techniques to find the optimal asset allocation that minimizes risk.
Example of Correlation in Action
In a typical portfolio, combining assets with low correlation—such as stocks and real estate investment trusts (REITs)—can provide greater stability. When stocks fall during a market correction, REITs may continue to perform well, maintaining the portfolio’s value.
Important Considerations in Correlation Interpretation
1. Statistical vs. Practical Significance
Just because you observe a statistically significant correlation doesn’t mean it’s practically relevant. For example, a small correlation might still be statistically significant due to the large volume of data, but in practice, it may not affect the investment strategy much. Conversely, a large correlation in a small sample might not pass the statistical tests, but it could still be relevant in real-world scenarios.
2. Time-Varying Nature of Correlation
Correlations between assets are not static. They can change over time, especially during periods of market crisis. For instance, during the 2008 financial crisis, assets that were previously uncorrelated suddenly exhibited a strong positive correlation as the market collapsed. Investors must consider the dynamic nature of correlation when making decisions.
3. Correlation Does Not Imply Causation
A high correlation between two assets does not necessarily mean that one asset causes the other’s movements. The correlation may arise due to external factors such as market-wide news or macroeconomic events.
Correlation and Trading Strategies
1. Pairs Trading
In pairs trading, investors identify highly correlated asset pairs and bet on the reversion to the mean. If one asset in the pair moves too far away from the other, traders expect the prices to realign. However, this strategy requires constant monitoring because correlations can break down unexpectedly.
2. Hedging
Hedging is another strategy where investors take positions in correlated assets to reduce risk. For instance, if you hold a stock, you might short a correlated ETF to protect yourself against downside risk. However, if the correlation changes unexpectedly (e.g., during a market shock), the hedge may not work as intended.
3. Commodities and Forex
In markets like commodities (e.g., gold) and currencies, correlation analysis helps traders gauge the behavior of related assets. For example, traders might expect gold to move oppositely to stock indices, but this correlation can shift depending on the broader economic environment, such as interest rates or geopolitical events.
Final Thoughts: The Role of Correlation in Smart Investing
Understanding correlation in financial markets is essential for constructing well-diversified portfolios and managing risk effectively. However, it’s just one part of a broader investment strategy. To make the best decisions, investors should combine correlation analysis with insights from fundamental analysis, technical analysis, and an understanding of macroeconomic conditions.
Key Takeaways:
- Pearson is great for linear relationships but is sensitive to outliers.
- Spearman and Kendall help assess relationships based on rankings, which is useful when the relationship isn’t strictly linear.
- Monitor changes in correlation over time, as asset correlations are dynamic and affected by market conditions.
- Diversify wisely by including assets with low or negative correlations to reduce risk and improve returns.
By mastering correlation analysis and combining it with other investing principles, you can make smarter, more informed decisions in both bullish and bearish markets, ensuring your portfolio is better prepared for whatever comes next.
Share
Hot topics

what is spread trading?
If you’ve spent any time in financial markets, you’ve probably heard traders talk about spreads. Sometimes they mean the difference between bid and ask prices. Other times, they’re referring to...
Read more


Submit comment
Your email address will not be published. Required fields are marked *