
A Critical Week for the Global Economy and Financial Markets | Week 17, 2026
Markets enter a critical week as investors track the latest economic data, central bank signals, corporate earnings, and geopolitical developments for clues on growth, inflation, interest rates, and risk sentiment. This weekly outlook covers the key global market drivers likely to shape currencies, equities, commodities, bonds, and broader investor positioning in the days ahead.
U.S. Economy Review: A Resilient Market Story, but a Mixed Real-Economy Week
The U.S. economy ended the latest week with a mixed but still resilient picture. The biggest positive came from inflation, where March producer prices were softer than expected. Headline PPI rose 0.5% month on month and 4.0% year on year, while core PPI increased just 0.1% in the month and 3.8% on the year. That mattered because it suggested inflation pressure was still concentrated in energy-linked areas rather than spreading broadly across the economy. Import prices rose 0.8% and export prices 1.6% in the month, showing traded goods inflation remained elevated, but not out of control.
Growth signals were less convincing. Regional manufacturing surveys improved sharply, with the Philadelphia Fed index rising to 26.7 from 18.1 and new orders jumping to 33.0 from 8.6. But hard data told a weaker story: industrial production fell 0.5%, manufacturing output slipped 0.1%, and capacity utilization dropped to 75.7% from 76.1%. In simple terms, confidence improved faster than actual factory activity.
The labor market stayed relatively firm. Initial jobless claims fell to 207,000, a sign layoff remained limited, although continuing claims rose to 1.818 million, hinting that finding a new job may be getting slightly harder. Housing was clearly weaker, with the NAHB index falling to 34 from 38, showing that builder confidence remains under pressure. Consumer demand also looked stable rather than strong, as Redbook retail growth slowed to 7.0% from 7.6%.
Financial markets finished the week much stronger than the real economy. Stocks rallied on softer inflation, strong earnings, and falling oil prices, while the dollar and yields eased. The main takeaway is that markets are pricing a soft-landing and lower-risk scenario, even though the underlying economy still looks uneven.
U.S. Economic Outlook for the Week Ahead
The U.S. enters the new week in a mixed but still expansionary position. Growth is clearly slowing, but the economy is not rolling over. Real GDP rose just 0.5% annualized in Q4 2025, while live Q1 estimates remain modest at 1.3% on the Atlanta Fed GDPNow model and 2.3% on the New York Fed nowcast. The labor market is still holding up reasonably well, with March payrolls up 178,000, the unemployment rate at 4.3%, and initial jobless claims at 207,000. But inflation remains an uncomfortable problem: March CPI rose 0.9% month on month and 3.3% year on year, core CPI stood at 2.6% y/y, and PPI increased 0.5% m/m and 4.0% y/y. Add in a 0.5% drop in industrial production and a record-low preliminary Michigan sentiment reading of 47.6, and the message is clear: activity is slowing, prices are still too firm, and confidence has deteriorated sharply.
The key event this week is Tuesday, April 21, when markets will focus on March retail sales, pending home sales, and policy headlines including Fed Governor Christopher Waller’s remarks and Kevin Warsh’s Senate confirmation hearing at 10:00 a.m. ET. Retail sales matter most because the central question is whether the consumer is still absorbing higher fuel costs or beginning to bend. Headline retail sales are expected to rise 2.0% in March, but that figure may exaggerate demand strength because sales are reported in nominal terms and gasoline likely accounted for a large share of the increase. The bigger issue is not whether spending held up in March, but whether that resilience can last if the Iran conflict keeps energy prices elevated.
Later in the week, Thursday’s jobless claims and flash PMIs will provide the freshest read on layoffs and business activity, while Friday’s final Michigan sentiment will show whether the collapse in confidence was real or temporary. Markets will also watch earnings, Treasury supply, and oil. Wall Street ended last week on a strong note, with the S&P 500 at 7,126.06 and the Nasdaq at 24,468.48, helped by easing Middle East fears and a sharp drop in crude. Still, with oil near $85 versus roughly $67 in late February, inflation risk has eased, not disappeared.
USD and Wall Street Market Condition, and Outlook for the Week Ahead
The week ahead for USD and Wall Street looks constructive on the surface, but the rally is now entering a more difficult phase. Markets ended last week increasingly pricing a world of lower oil, lower immediate geopolitical stress, softer inflation pressure, and resilient earnings. That mix was bearish for the dollar and strongly bullish for U.S. equities, but it remains highly conditional. If de-escalation between the U.S. and Iran continues, this backdrop can hold. If it breaks down, the reversal could be fast and aggressive.
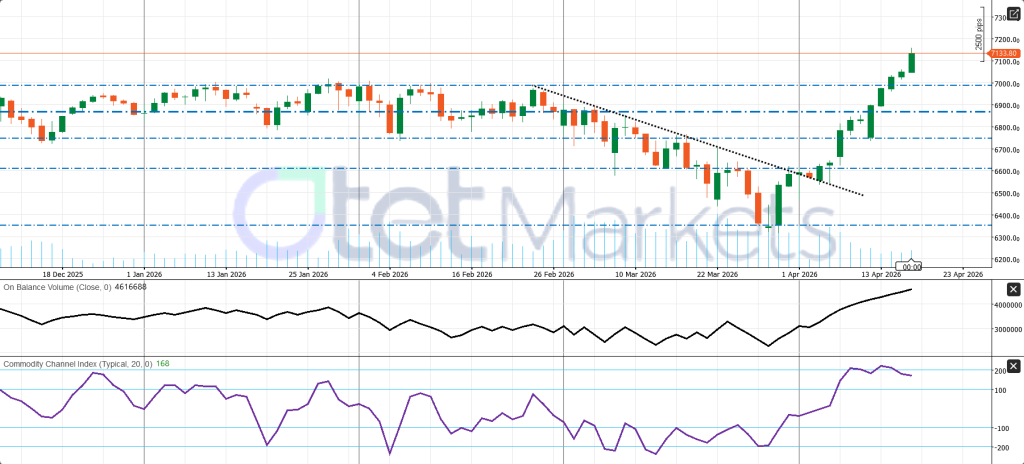
On Wall Street, momentum is strong. The S&P 500 closed at 7,126.06, the Nasdaq at 24,468.48, and the Nasdaq has now risen for 13 straight sessions, its longest winning streak since 1992. S&P has rebounded roughly 12% from its March 30 low. The rally was not driven only by big tech. As oil prices fell sharply, travel, airlines, cruise operators, and consumer-sensitive stocks also surged, while energy shares lagged as the war premium came out of crude. That broadening improved the tone of the rally, but it also means the market has already primarily placed in a lot of good news. From here, upside likely needs clean earnings beats, stable guidance, and continued geopolitical calm.
Technically, the S&P 500 has become decisively stronger. Price is trading around 7,133.80, right at a key breakout zone. A daily close above that area could open the way toward 7,200, while support now sits near 7,000, then 6,850. Momentum is strong, with On-Balance Volume rising sharply, but the CCI at 168 suggests the market is also becoming overheated in the short term. The trend is bullish, but it is no longer cheap to chase.
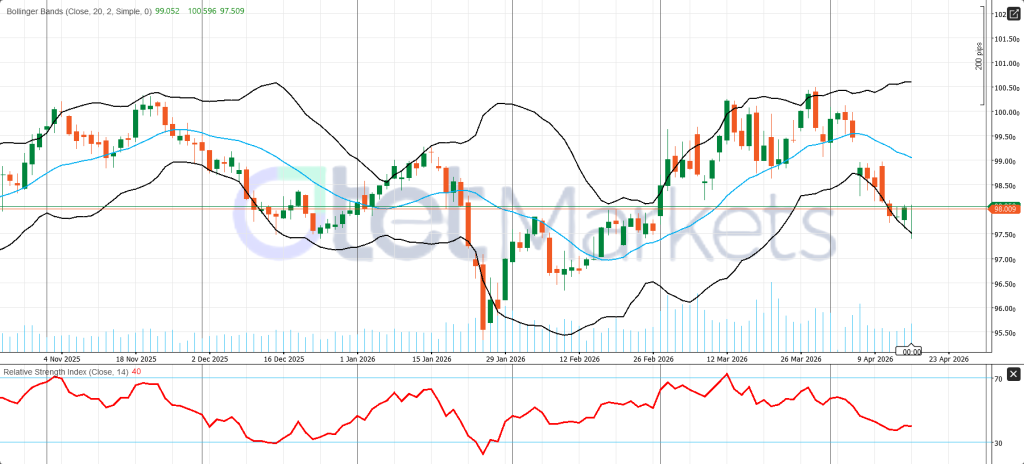
For the U.S. dollar, the tone has softened. The DXY fell to 97.96 on Friday, after touching 97.632, its lowest level in seven weeks, and ended the week down 0.6%, marking a second straight weekly loss. This weakness came mainly from fading safe-haven demand as risk appetite improved and oil fell. Still, this does not yet look like a structural dollar breakdown. Fed policy remains uncertain, inflation is still elevated, and U.S. data have not collapsed. Technically, DXY remains weak below the 99.05 resistance area, with 97.50 as first support and 96.50 below that if selling deepens.
The most important drivers this week are clear: Tuesday’s retail sales and Kevin Warsh hearing, Thursday’s jobless claims and flash PMIs, Friday’s Michigan sentiment, and earnings from Tesla, Boeing, Intel, and Procter & Gamble. In the near term, both USD and Wall Street still depend heavily on one thing: war headlines and oil.
EU Economy Review in the past week
Inflation Reaccelerated, Industry Stabilized, but the Recovery Still Looked Fragile
The euro-area economy ended the week in a fragile but not collapsing position. The data showed that the region avoided the worst-case outcome from the recent energy shock, but it also failed to deliver a convincing recovery story. The clearest shift came from inflation. Headline euro-area CPI rose to 2.6% year on year in March, up from 1.9% in February, showing that price pressure reaccelerated faster than markets had hoped. This rise was not limited to one country. France’s inflation accelerated to 2.0%, while earlier releases from Spain and Italy also pointed to firmer price pressure. Germany added to the concern with a sharp rise in wholesale prices, reinforcing the idea that the earlier oil and energy shock was feeding back into upstream costs across the bloc.
That said, this was not a fully hawkish inflation story. The broader message was that headline inflation strengthened more than the core trend, meaning the ECB still has to separate energy-led price pressure from a genuinely renewed domestic inflation cycle. In practical terms, this made the outlook for ECB easing less comfortable, but it did not force markets to suddenly price a new tightening phase.
On growth, the picture improved only modestly. Industrial production rose 0.4% month on month in February, which was better than expected and helped relieve some downside fears after earlier weakness. But output was still below year-earlier levels, meaning euro-area industry is stabilizing, not truly recovering. This is an important distinction: the downturn may have paused, but the sector is still soft in historical terms.
The external backdrop stayed supportive, but not strong. Eurostat reported that the euro area returned to a goods trade surplus of €11.5 billion in February, showing that the bloc still has an external cushion. But because the current-account surplus narrowed and the surplus itself was only modest, trade is not yet delivering a strong new growth impulse.
Germany remains the biggest weak point in the euro-area story. Downgraded growth expectations, weaker external demand, and higher energy costs continue to weigh on the bloc’s largest economy. The overall takeaway is that Europe is still caught between two pressures at once: weak growth and renewed headline inflation. That leaves the euro area looking more like an economy in fragile stabilization than one entering a fresh expansion phase.
Eurozone Economic Outlook for the Week Ahead
The eurozone enters the new week with a fragile but not collapsing backdrop. The main risk is increasingly clear: Europe is facing the possibility of energy-driven stagflation, where growth stays weak while inflation rises again. Christine Lagarde warned on April 17 that the Iran war poses risks to both growth and inflation, and the IMF now expects euro-area growth of just 1.1% in 2026 and 1.2% in 2027, both lower than previously expected. At the same time, the IMF sees inflation at 2.6% in 2026, up from 2.1% in 2025. That is an uncomfortable mix for the ECB, because tighter policy could deepen weak demand, while staying on hold could leave the euro and equities vulnerable.
The underlying problem is that the eurozone was already weak even before the latest Middle East shock. Demand had been soft, consumer confidence was poor, and surveys such as ZEW and IFO had already signaled a struggling economy. That means the region is not just dealing with a temporary oil shock; it is dealing with higher energy costs on top of an already fragile demand environment. If inflation rises further while growth remains weak, the eurozone could slip deeper into a stagflation Ary setup. In that case, the best outcome for Europe would be a quick end to the war and a sustained fall in energy prices. Otherwise, pressure on consumers, margins, and confidence is likely to intensify.
This makes next week’s data especially important. The first key release is flash consumer confidence on Wednesday, April 22 at 16:00, after March already showed a sharp deterioration. The Economic Sentiment Indicator fell to 96.6 from 98.2, the Employment Expectations Indicator dropped to 96.4, and consumer confidence declined to -16.3, its weakest since October 2023. Then on Thursday, April 23, markets will focus on the flash April eurozone PMI, which will help determine whether the block is simply slowing or moving closer to recession. If PMI and confidence hold up, markets may conclude the region is still weak but stable. If they deteriorate further, recession fears will return quickly, especially in cyclical and banks.
For markets, the euro has recently benefited more from dollar weakness than from a clearly hawkish ECB. EUR/USD was around 1.1789 on April 17, after touching 1.1848, an eight-week high. Eurozone equities also improved, with the STOXX 600 rising more than 1% on April 17 and posting a fourth straight weekly gain. But both the euro and stocks remain highly sensitive to oil prices, ECB speeches, and war headlines. The broad takeaway is that Europe has not collapsed, but it remains economically soft, policy-constrained, and extremely exposed to energy and confidence shocks.
Energy and Commodities Review: Oil Crashed, Precious Metals Rose, and Industrial Inputs Sent Mixed Signals
Last week in commodities there was all about one major shift: markets moved from fearing a severe Middle East supply shock to pricing a fragile de-escalation scenario. That change triggered one of the sharpest reversals of the year, especially in energy. Oil was hit hardest as the war premium came out fast, while gold and silver still advanced, supported by a weaker U.S. dollar and lower Treasury yields. Industrial commodities told a more mixed story, with supply-chain disruptions keeping parts of the complex tight.
The biggest story was clearly crude oil. After trading near or above $100 earlier in the crisis, prices collapsed once Iran signaled that the Strait of Hormuz in the Persian Gulf would remain open to commercial shipping during the ceasefire period. By Friday, Brent crude fell $9.01, or 9.07%, to $90.38, while WTI dropped $10.48, or 11.45%, to $83.85. Even after that sharp fall, oil remained well above pre-war levels near $70, showing that geopolitical risk had not disappeared completely. Around 20 ships were seen moving through Hormuz again, which helped markets believe the worst-case disruption had eased, at least for now.
U.S. inventory data added nuance. For the week ended April 11, crude stocks fell 0.9 million barrels, gasoline inventories dropped 6.3 million barrels, and distillates fell 3.1 million barrels. Total commercial petroleum inventories declined by 9.0 million barrels, pointing to tighter product markets even as geopolitics dominated headline price action. Natural gas was different: storage rose by 59 Bcf, a sign of more comfortable supply.
Precious metals stayed firm. Spot gold rose 1.5% to $4,861.32, with futures settling at $4,879.60, extending a fourth straight weekly gain. Silver also remained fundamentally strong, helped by a projected 46.3-million-ounce market deficit in 2026. Meanwhile, copper and nickel held support from higher sulfur-related input costs, reminding investors that even as energy cooled, supply-side stress across commodities had not fully gone away.
Gold Weekly Outlook
Gold enters the new week in a constructive position, but the trade is no longer one-way. Spot gold ended this week around $4,785–$4,830 per ounce, after touching a one-month high earlier and extending its run to a fourth straight weekly gain. That tells us investors still want exposure to bullion, but they are no longer paying the same panic premium seen at the peak of the Middle East shock. The market is now being driven by a more balanced mix of dollar weaknesses, Fed expectations, and geopolitical headlines.
From a macro perspective, three forces matter most. First, the U.S. dollar softened, which supports gold mechanically. Second, lower oil after the reopening of the Strait of Hormuz in the Persian Gulf eased inflation and real-rate fears, which also helped bullion. Third, the same de-escalation headlines reduced the need for an urgent crisis hedge, limiting upside momentum. In short, gold remains supported, but it is no longer trading as a pure safe-haven asset.
Underneath the surface, structural demand is still strong. Commodity funds focused on gold and precious metals took in about $822 million in the latest week. Central banks bought a net 27 tones in February, while official-sector buying had already reached 31 tones just two months into 2026. China also remained important: local gold ETFs recorded inflows for a seventh straight month, and the PBoC extended its gold-buying streak to 17 months in March. Those figures help explain why gold has stayed firm even as immediate geopolitical stress eased.
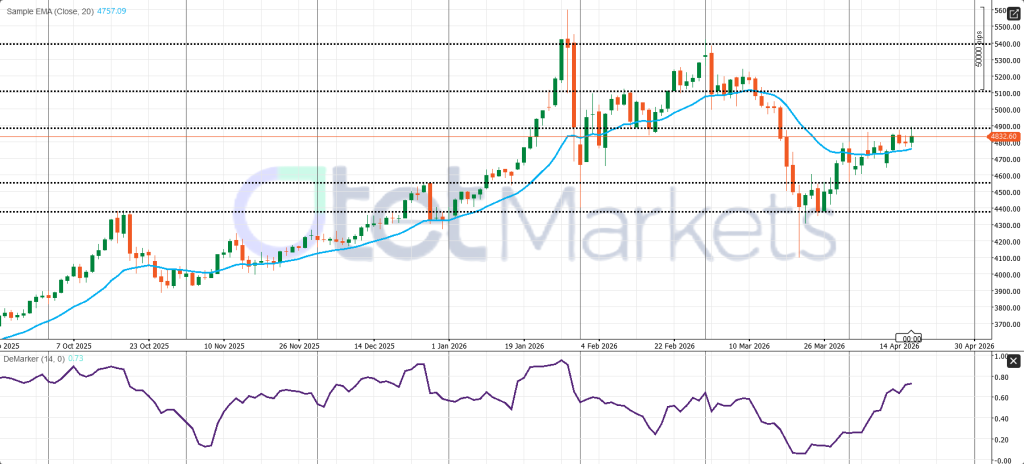
Technically, XAU/USD near 4,832.60 looks constructive above the 20-day EMA at 4,757.09, but it is testing a key decision zone. 4,900 is the main resistance. A clean break above that level would strengthen the bullish case and open room toward 5,100, while failure there could trigger consolidation back toward 4,757, 4,550, or even 4,400. The bottom line is that gold’s medium-term floor still looks solid, but next week’s short-term direction will depend heavily on the dollar-oil-Fed triangle.
WTI Weekly Outlook
The oil market enters the new week in a high-volatility transition phase. The immediate panic premium has come out fast, but the deeper supply shock has not been fully repaired. WTI ended last week in the mid-$80s after a steep Friday decline, triggered by Iran’s signal that the Strait of Hormuz in the Persian Gulf was open to commercial shipping. That sharply reduced fears of immediate worst-case disruption, but it did not erase the broader damage already done to supply. Reports still show that more than 500 million barrels of crude and condensate have been removed from the market during the war, with outages reaching roughly 12 million barrels per day since late March.
Fundamentally, WTI is now being pulled in two directions. On one side, diplomacy and improving shipping conditions are removing part of the war premium. On the other, the physical market remains tight because production damage, export bottlenecks, and refinery disruption across the region cannot be repaired quickly. This is why the latest drop in oil looks more like a repricing of near-term fear than a return to normal market conditions.
The demand side has clearly weaker. The IEA’s April 2026 Oil Market Report now expects global oil demand to contract by 80 kb/d in 2026, compared with expected growth of 730 kb/d in the previous month’s report. It also sees a 1.5 mb/d decline in second-quarter demand, the sharpest drop since the Covid shock. That is an important bearish shift because it suggests high prices and war disruption are already destroying demand, especially in the Middle East and Asia-Pacific.
Still, supply remains tighter than the demand story alone would imply. The IEA says global oil supply fell by 10.1 mb/d in March to 97 mb/d, while OPEC+ production dropped 9.4 mb/d month on month to 42.4 mb/d. In the U.S., crude inventories fell by 0.9 million barrels to 463.8 million, but remain about 1% above the five-year average, which helps cap upside in WTI relative to Brent.
My base case is range-bound to mildly bearish, but with an unstable floor. WTI still looks too high for a weak-demand world, yet too low for a fully unresolved supply-disruption world. That usually means a choppy market with sharp reversals rather than a clean trend.
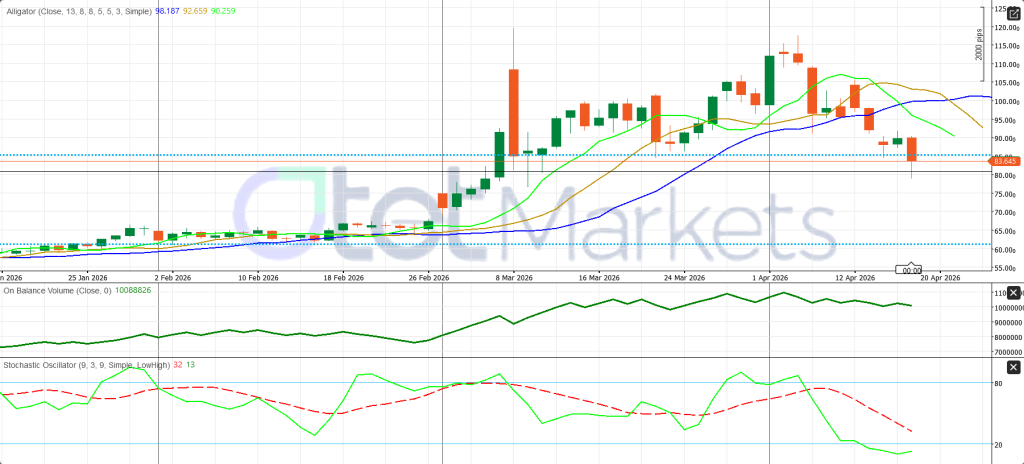
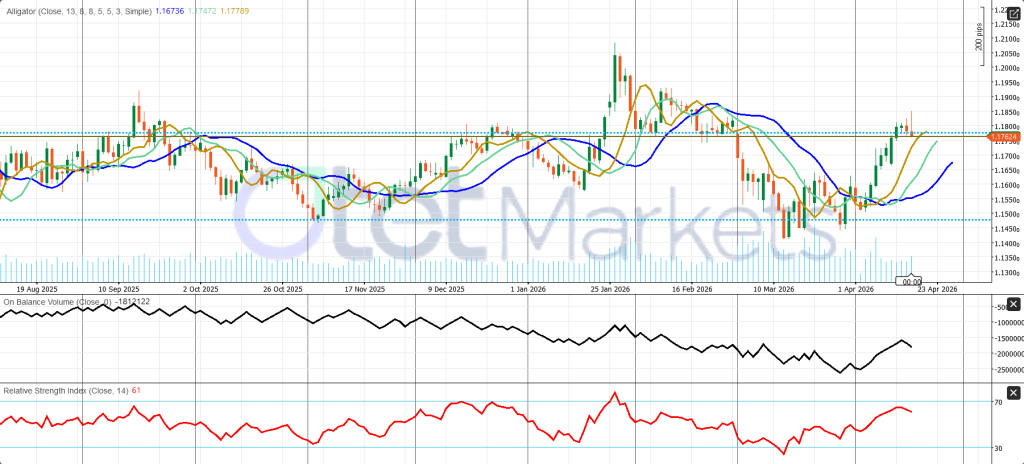
WTI’s daily chart remains clearly bearish after breaking sharply from its March-April highs. Price near 83.65 is trading below all key Alligator levels 90.26, 92.66, and 98.19, showing that the previous uptrend has decisively failed. The key near-term pivot is 83.60. Staying below it keeps pressure alive toward 80.00, with 75.00 as the next deeper target. On the upside, resistance stands at 90.25–92.65, and the broader bearish structure would only start to improve above that zone. Momentum still argues for caution: OBV has rolled over, and stochastic near 32/13 suggests oversold conditions, but not a confirmed bottom yet.
Crypto Market Conditions and BTC Weekly Outlook
Bitcoin enters the new week in a recovery phase, but this is still a market that depends heavily on the broader macro backdrop rather than purely crypto-native momentum. BTC is trading around $76,605, after moving in an intraday range of roughly $75,168 to $78,242, and the latest rebound has been helped by the same forces that lifted other risk assets: easing geopolitical stress, lower oil, softer dollar pressure, and improving appetite for growth assets. In other words, Bitcoin is still acting more like a high-beta macro trade than a defensive hedge.
What has changed in recent years is that Bitcoin no longer moves only on crypto headlines. It now reacts strongly to inflation, interest-rate expectations, liquidity conditions, and institutional flows. That creates a mixed setup. On one side, renewed inflation can make Bitcoin attractive because of its limited supply. On the other, higher rates for longer are a headwind for risky assets, including crypto. Right now, the market is balancing both forces at once. Fed expectations remain important because if investors keep believing the next big policy moves eventually toward easing, Bitcoin can stay supported. If oil rises again and the Fed turns more defensive, BTC could lose momentum quickly.
The strongest support under Bitcoin is still institutional demand. Spot Bitcoin ETFs now holds nearly $100 billion in assets, and major players such as BlackRock, Morgan Stanley, and Goldman Sachs continue building exposure and products around the asset class. Fund-flow data also improved sharply. CoinShares reported $1.1 billion of inflows into digital-asset products in the week of April 13, the strongest weekly total since early January, with Bitcoin alone attracting about $790 million. Year-to-date inflows into Bitcoin stand near $2.4 billion. That does not guarantee an immediate breakout, but it does show that large investors are still using weakness to build positions.
Regulation is also becoming more supportive, which matters for the medium-term picture. Clearer guidance from U.S. regulators and progress on digital-asset legislation are reducing some of the structural uncertainty that held the sector back in earlier cycles. Still, the market is not fully repaired. Ethereum and broader altcoin participation remain weaker, which suggests this is still a Bitcoin-led recovery, not yet a full crypto bull phase.
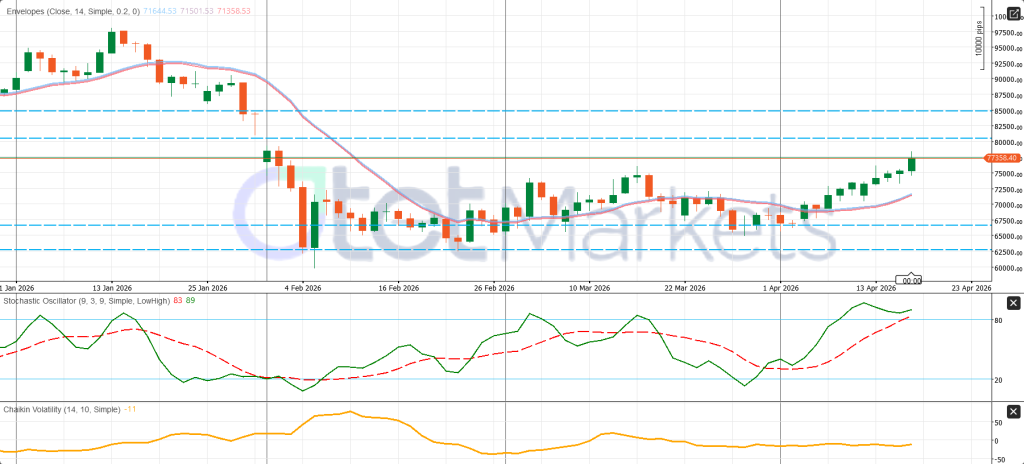
Technically, the daily chart looks constructive. BTC is trading around 77,358, well above the 71,358–71,645 envelope area, after rebounding from the 62,500–67,000 base. It has already reclaimed 67,000 and 70,000 and is now testing the key 77,350–80,000 resistance zone. A clean break above 80,000 would open room toward 85,000. Support sits near 71,500, then 67,000. The overall outlook is cautiously bullish, but with momentum stretched enough that confirmation matters more than chasing late upside.
Share
Hot topics

What is a Floating Spread in Forex?
Introduction If you’ve ever placed an order and noticed the price changes slightly as it’s executed, you’ve experienced spreads in forex trading. Many beginners find this confusing. They enter a...
Read more


Submit comment
Your email address will not be published. Required fields are marked *