
Weekly Global Economic Outlook, with GDP and Inflation Data in Focus!
Last week, the global economy presented a nuanced landscape. The IMF revised its 2025 global growth forecast down to 2.8%a decline of 2.8% from 3.3%, causing trade tensions and policy uncertainty. In the U.S., business activity rebounded, with the S&P Global Composite PMI rising to 52.1; however, inflationary pressures hit multi-year highs, and the labor market cooled, raising stagflation concerns. The U.K. led the G7 with 0.7% GDP growth in Q1, while the EU and euro area are projected to expand by 1.1% and 0.9%, respectively, in 2025. Trade frictions, notably U.S. tariffs, prompted firms to stockpile inventories—potentially driving up costs—and the U.S. dollar weakened by roughly 6% since January.
For the coming week, the focus will shift to inflation metrics and monetary policy decisions as central banks reassess rate trajectories. Trade measures—especially U.S. tariffs—will remain under scrutiny, influencing input costs and supply-chain dynamics. Policy discussions may center on fiscal stimulus needs amid slowdowns in both the U.S. and China. Key data releases, including GDP readings, inflation figures, and employment reports, will be critical, alongside ongoing efforts at global policy coordination.
US Economic Overview
Over the week ended May 24, the U.S. labor market remained robust: initial jobless claims fell to 227,000, underscoring continued resilience in employment. In housing, existing home sales dipped to a 4.00-million-unit annual pace in April, while new home sales jumped 10.9% to 743,000 units—reflecting tight resale inventories and aggressive builder incentives. Mortgage rates climbed to 6.86%, near a three-month high, maintaining pressure on affordability. Fiscal developments also took center stage: the House approved a $3.8 trillion budget reconciliation bill, driving 10-year Treasury yields above 4.5% amid deficit-concerns. Fed officials, led by Chicago Fed President Austan Goolsbee, reiterated a cautious stance, suggesting rates will likely remain on hold absent clearer trade and inflation signals.
Labor Market
- Initial claims for state unemployment benefits fell by 2,000 to a seasonally adjusted 227,000 for the week ended May 17, highlighting employers’ reluctance to cut staff despite economic uncertainties.
Housing Market
- Mortgage Rates: The average rate on a 30-year fixed mortgage rose to 6.86% as of May 22, up from 6.81% the previous week, keeping borrowing costs well above the pre-pandemic average near 4%.
- Existing Home Sales: April’s existing home sales slipped 0.5% to a 4.00-million-unit annual rate, the slowest April since 2009, with inventories up 9.0% to 1.45 million units and median prices hitting a record $414,000.
- New Home Sales & Inventory: New single-family home sales surged 10.9% in April to 743,000 units, the highest since February 2022—as builders cut prices and offered incentives. Available inventory edged down 0.6% to 504,000 units but remains near late-2007 high.
- Housing Starts: Privately owned single-family housing starts in April were at a 927,000-unit annual rate, down 2.1% from March, reflecting ongoing affordability headwinds even as multi-unit starts held steady.
Fiscal & Debt Markets
- On May 23, the U.S. House passed its FY 2025 budget reconciliation bill—a package the CBO projects will add roughly $3 trillion to deficits over the next decade—pushing the 10-year Treasury yield above 4.5% amid mounting concerns over long-term debt sustainability. Yields later eased slightly as equities stabilized but remained near four-month highs around 4.45%.
Federal Reserve & Outlook
- Chicago Fed President Austan Goolsbee emphasized that “everything is on the table” but set a higher bar for policy changes until clearer inflation and trade data emerge, indicating the Fed is likely to keep rates unchanged through the summer. With rate cuts now less certain, elevated borrowing costs—particularly in mortgages—are expected to persist, sustaining headwinds for the housing sector.
US Economic Outlook (May 26–31)
New orders for manufactured durable goods surged 7.5% in March, driven largely by a $23 billion (157%) spike in non-defense aircraft bookings—while orders for non-defense capital goods excluding aircraft rose only modestly and shipments were subdued. U.S. consumer confidence tumbled to 86.0 in April—the lowest reading since May 2020—as households’ expectations plunged and outlooks on employment and income turned negative. At the Fed’s May 6–7 meeting, the FOMC held its target range at 4.25–4.50%, flagged persistent inflation and trade-policy risks, and signaled a “wait-and-see” stance; the detailed minutes are due Wednesday. In March, real personal consumption rose 0.7%, led by a spike in motor vehicle purchases, while personal income increased 0.5% and the PCE deflator held flat, underscoring still-subdued underlying inflation pressures.
Key Data Releases and Events
The week of May 25–30, 2025, will feature several critical economic indicators and events that will shape the U.S. economic outlook:
Durable Goods Orders (Tuesday, May 27): Headline durable goods orders are expected to decline 7.8% in April, primarily due to a drop in transportation orders—particularly aircraft—following weak Boeing data. However, orders excluding transportation are forecast to rise 0.2%, suggesting some resilience in non-transport sectors. This follows March’s 7.5% surge, driven by that $23 billion jump in non-defense aircraft orders and a 0.3% gain in auto orders, though core capital goods orders fell 0.2% and shipments softened. The data will provide insight into business investment trends amid trade uncertainties and elevated borrowing costs.
Consumer Confidence (Tuesday, May 27): The Conference Board Consumer Confidence Index is projected to edge up to 87.3 in May, supported by a 90-day tariff pause with China, which offered temporary relief. However, confidence remains near historic lows—April’s index was 86.0 and the Expectations Index stood at 54.4—reflecting ongoing concerns about inflation, trade policy, and labor-market prospects. The survey’s cutoff preceded announcements of proposed tariff hikes on the EU and Apple, which may dampen any gains.
FOMC Minutes Release (Wednesday, May 28): The minutes are likely to highlight the FOMC’s concerns over persistent inflation (core PCE at 2.6%, above the 2% target) and trade-policy uncertainty—particularly tariffs’ impact on prices and growth. The committee probably discussed the 90-day tariff pause and its potential to ease short-term inflationary pressures but may have expressed caution regarding long-term trade risks. The minutes could also address labor-market resilience (unemployment at 4.2%) alongside signs of cooling, potentially raising stagflation concerns. Continued emphasis on patience may push rate-cut expectations beyond September 2025.
Personal Income and Spending (Friday, May 30): Personal income is forecast to rise 0.3% in April, with personal spending up 0.2%, following March’s gains of 0.5% income growth and 0.7% spending growth. Inflation is expected to stay subdued, with the headline PCE deflator up 0.1% (2.2% year-over-year) and the core PCE deflator up 0.1% (2.6% year-over-year). These readings suggest consumer resilience is holding, though spending may moderate slightly amid cautious sentiment.
Market Implications
The fundamental outlook for Wall Street in the week of May 25–30, 2025, suggests a volatile market influenced by the FOMC minutes, durable goods orders, consumer confidence, and personal income and spending data. The Fed is likely to maintain a cautious stance, with inflation and trade-policy uncertainties driving market sentiment. The S&P 500’s technical charts indicate a short-term bearish bias due to the trend-channel break, with key support at 5,780 and resistance at 5,960. Medium- to long-term, the outlook could remain bullish if the index holds above these critical levels—supported by steady income growth and potential Fed support—although short-term volatility is expected.
Technical Analysis of the S&P 500
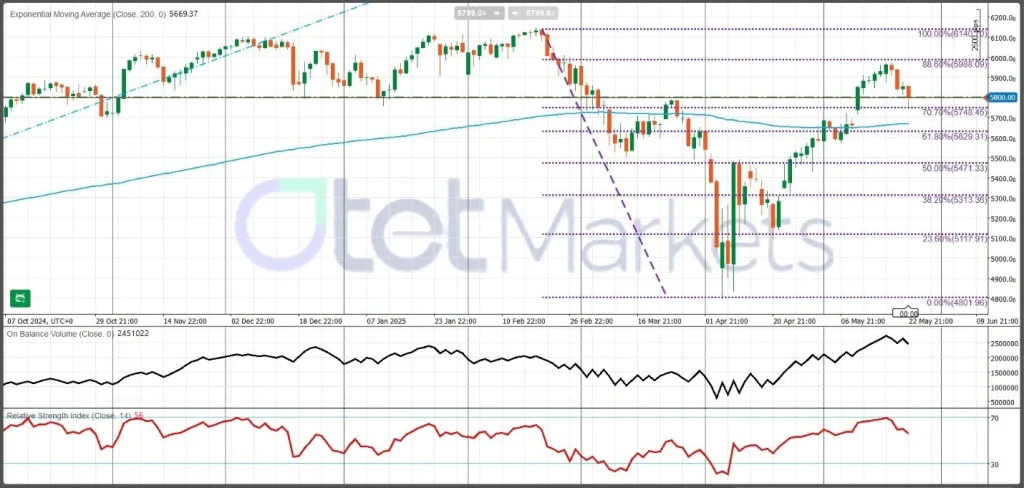
Recent technical analyses show the S&P 500 has broken below its short-term rising trend channel, signaling a weaker initial ascent and a bearish short-term bias. The next downside targets are 5,750 and then 5,630; if these levels are reached, we can look for support around 5,450. Conversely, a hold above 5,750 and subsequent recovery could test resistance at 5,988, with the potential to reach higher levels if bullish momentum returns.
US Dollar Index
Given the combination of fresh technical breakdowns and ongoing fiscal and trade concerns, DXY is likely to remain under pressure in the near term. A sustained move back above 100.00 is required to alleviate bearish momentum, but with the 50-day SMA acting as dynamic resistance near 101.20, such a reversal seems unlikely without a fundamental shift. From a technical standpoint, the index sits beneath all major simple and exponential moving averages on the daily timeframe. In particular, the 50-day EMA has turned downward and is reinforcing the prevailing downtrend.
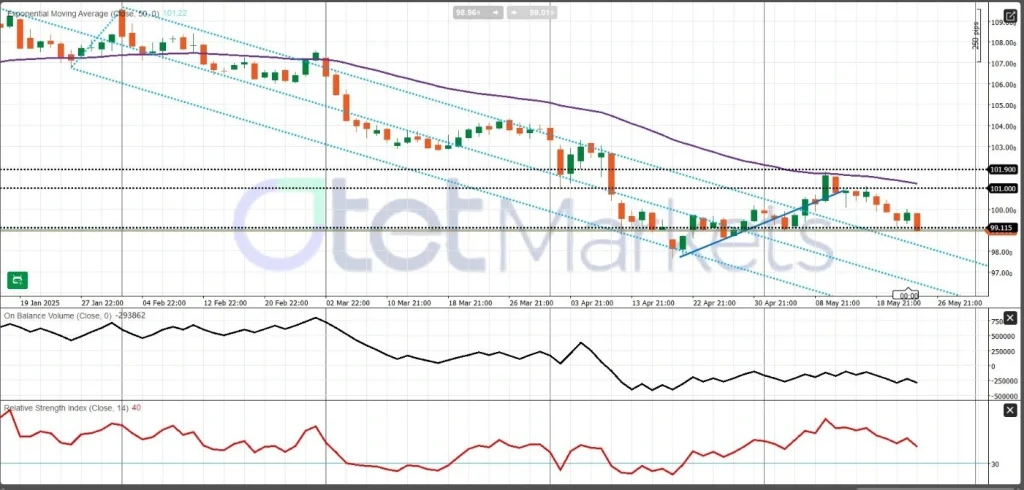
Momentum indicators also confirm the bearish bias: the daily RSI hovers just below its midline toward 40, indicating sellers retain control without extreme readings, while short-term charts show oversold conditions on the 14-period RSI, suggesting a potential corrective bounce before further depreciation. Immediate support lies at the recent two-week low near 99.00; a drop below this could see the index slide toward the 98.00 area, which previously held as a swing low. On the upside, the 100.00 psychological level is the first resistance hurdle, followed by the 101.20 region marked by the descending 50-day SMA.
The Reserve Bank of New Zealand (RBNZ) and Kiwi!
The Reserve Bank of New Zealand (RBNZ) meets on Wednesday, 28 May. As of the 9 April update, the Official Cash Rate (OCR) stands at 3.50 percent, and markets almost universally expect a 25 basis-point cut to 3.25 percent—marking the start of a gradual easing cycle amid still-elevated inflation expectations and a softer global outlook. Overnight index swap (OIS) curves imply virtually a 100 percent probability of a 25 bp cut, with only a minimal chance of a larger 50 bp move.
Despite headline inflation moderating, short-term pressures—including a recent uptick in Q1 CPI—may lead the RBNZ to signal that inflation could peak closer to 2.8–2.9 percent before gradually returning within the 1–3 percent target band.
Economists at Westpac IQ and other major banks likewise anticipate a 25 bp OCR cut to 3.25 percent, noting that “further but measured” easing will depend on incoming data.
Since a 25 bp reduction is widely expected and priced into markets, attention will turn to any shifts in the RBNZ’s forward guidance, especially regarding the pace of subsequent cuts—given the central bank’s caution over trade-policy risks and global growth headwinds.
Impact on NZD/USD
Markets have fully priced in this move, and NZD/USD is likely to face downward pressure, with key technical support around 0.5900 and resistance near 0.6000 guiding the pair’s near-term range. A lower OCR erodes the yield differential that underpins NZD carry trades, likely weighing on the currency against the USD—particularly if the U.S. Treasury yield curve remains relatively elevated. Seasonal factors also point to NZD underperformance into mid-year.
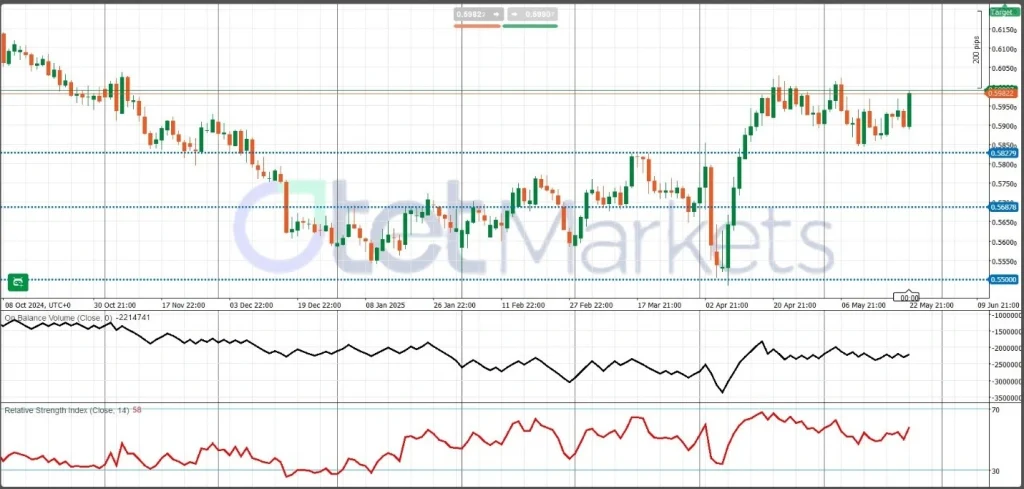
NZD/USD currently trades near 0.5990, having bounced off support around 0.5900. Immediate support lies at 0.5900–0.5920, while resistance resides at the 0.6000 psychological level and the April highs just above 0.6020.
Gold Fundamental and Technical Expectations for the Week Ahead
Gold is positioned for modest upside in Week 22 as safe-haven inflows from U.S. fiscal and trade uncertainties, coupled with solid central-bank demand, offset pressures from rising bond yields and Federal Reserve caution.
U.S. fiscal and trade tensions continue to underpin gold’s appeal, with investors seeking a haven amid uncertainty around the $3.8 trillion budget reconciliation bill and looming tariffs. Fresh trade threats from President Trump against the EU and major tech firms drove gold futures 2.2% higher, testing intraday peaks above $3,360 per ounce. The anticipated budget package, seen by analysts as adding to long-term deficits, further bolsters demand for non-yielding assets such as gold.
Central bank and institutional buying remain structural tailwinds. NS Ramaswamy of Ventura Securities highlights that central banks, pension and sovereign-wealth funds, and retail investors are accumulating gold in anticipation of supply constraints and defensive properties during volatile market conditions.
Escalating geopolitical risks are also providing support. Kitco reports that gold posted solid gains ahead of the U.S. long weekend, reflecting continued safe haven purchases as fiscal and geopolitical headwinds mount.
On the other hand, U.S. economic data and Fed policy will be critical drivers this week. With rate-cut expectations tempered, Treasury yields have stabilized, capping gold’s rally potential. Any dovish surprise in Fed guidance or weaker-than-expected U.S. growth and inflation figures could reignite buying interest.
Gold Technical Outlook
XAU/USD traded within a tight $3,300–$3,380 range last week, with bulls defending support at $3,300 and sellers capping gains near the descending trendline at $3,380. The 21-day simple moving average at $3,290 held as dynamic support for the third consecutive session, signaling short-term buyer commitment.
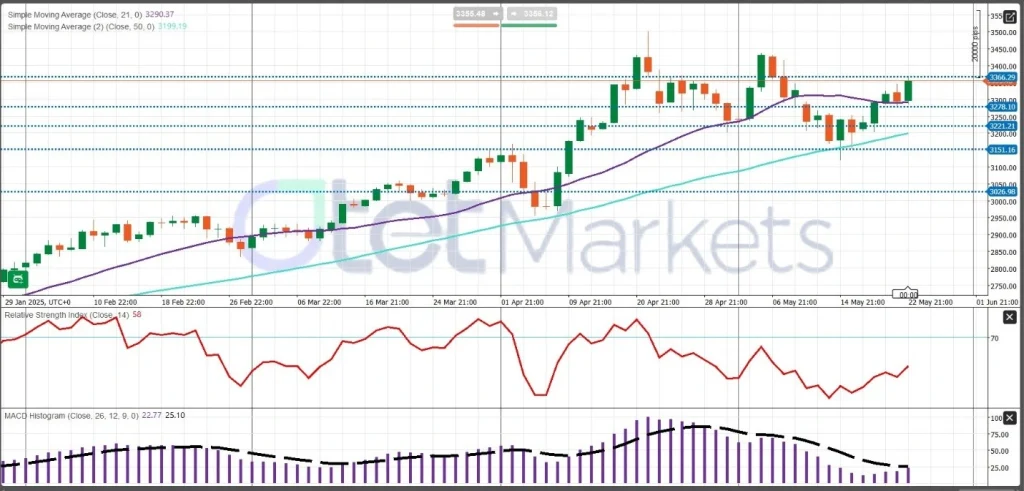
On the downside, a clear break below $3,300 could pave the way toward $3,200—the 50-day SMA—while a decisive break above $3,380 would expose $3,420 and the prior swing high near $3,450.
Momentum indicators are mixed: the RSI stands just above neutral at 58, indicating limited directional conviction, while the MACD histogram inches toward a bullish crossover, suggesting upside potential if resistance is overcome.
WTI fundamental and technical expectations for the week ahead
Given ample supply, modest demand growth, and ongoing OPEC+ easing, WTI is likely to trade within a $60–$64 range in the week ahead, with downside risks prevailing unless fundamentals shift or technical support near $60.50 holds convincingly.
WTI is trading near $62.00 after posting a weekly loss following two consecutive weekly gains, amid rising global inventories—which climbed to 7.7 billion barrels in March, outpacing demand growth of roughly 1 million barrels per day—and fueling bearish sentiment.
OPEC+ production increases of approximately 411 kb/d scheduled for June, coupled with a slight drop in U.S. rig counts to 566 rigs, further weigh on the outlook. The IEA has revised 2025 demand growth down to 730 kb/d, highlighting a modest consumption environment. The OPEC meeting on May 28 should shed light on their policy direction.
The IEA expects global oil supply to rise by about 1.6 mb/d on average in 2025 as non-OPEC+ producers add 1.3 mb/d and OPEC+ reverses voluntary cuts ahead of schedule, which could keep downward pressure on prices. The EIA’s Short-Term Energy Outlook likewise forecasts that U.S. production will continue to outpace annual demand growth, leading to inventory builds through 2026.
Conversely, despite a strong Q1 2025 consumption surge, demand growth has slowed—prompting the IEA to downgrade its 2025 global oil-demand forecast by 300 kb/d—citing trade-policy headwinds and economic uncertainty.
WTI Technical Analysis
WTI has slipped below its 20-day and 50-day moving averages on the daily chart after failing to sustain gains above $63.50, reflecting a bearish shift in momentum. $62.00 now acts as immediate resistance, while the 14-day RSI hovers near neutral, suggesting potential sideways trading around current levels.
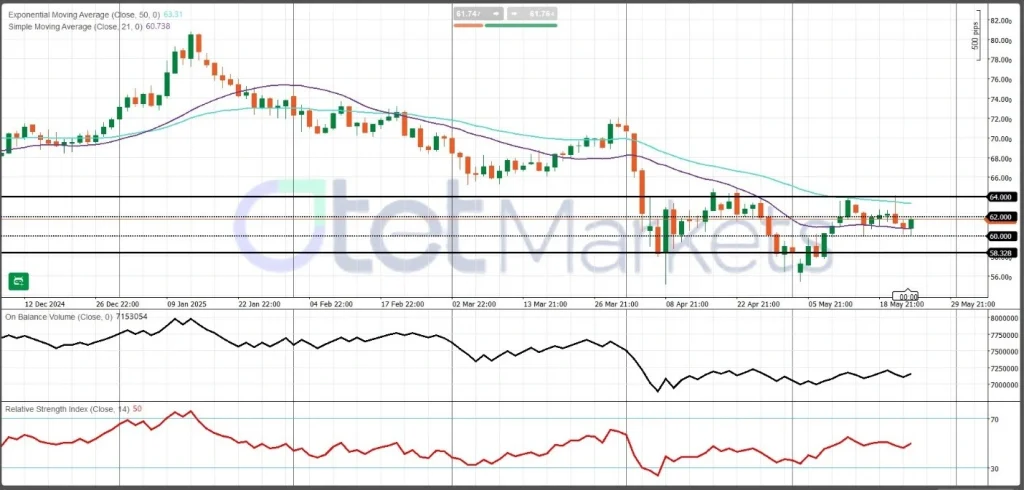
Immediate support lies at the recent low around $60.50; a break below this level could see the price slide toward $59.00. On the upside, resistance clusters at $63.50 (once above $62.00), followed by $64.70 as the next hurdle.
BTC after hitting a New Record!
Bitcoin is trading near $108,756 as of May 24, extending gains after surpassing highs above $111,000 last week on robust institutional demand and regulatory optimism. Spot Bitcoin ETFs attracted $2.75 billion in inflows this week, underscoring strong investor appetite. However, rising U.S. Treasury yields above 4.6 percent, and a firmer dollar could limit near-term upside.
Institutional interest remains elevated, with U.S. spot Bitcoin ETFs amassing over $3.5 billion in inflows over the past two weeks—led by BlackRock’s IBIT, which reported $855.4 million on May 22. Bitcoin reached a new all-time high near $112,000 on May 23, driven by favorable regulatory developments, including discussions of a federal Bitcoin reserve, and growing adoption among traditional finance firms.
Macro headwinds persist as 10-year U.S. Treasury yields climbed to 4.61 percent, dampening risk-asset demand and exerting downward pressure on cryptocurrencies. At the same time, concerns over fiscal and trade-policy uncertainty bolster Bitcoin’s appeal as a non-sovereign store of value amid potential inflationary pressures.
Looking ahead, some analysts forecast Bitcoin could reach $120,000 in Q2, citing shifting cross-asset correlations and long-term trend analogs from previous market cycles.
Bitcoin Technical Outlook
Bitcoin’s price momentum remains bullish, with BTC trading above its 20-day and 50-day simple moving averages, signaling sustained upward pressure. Immediate support sits at $107,160, the intraday low on May 24—and around $105,700, the recent breakout level expected to act as a floor for dips. On the upside, resistance lies near the record high of $112,345, with a secondary cap at $115,000 that could trigger profit-taking.
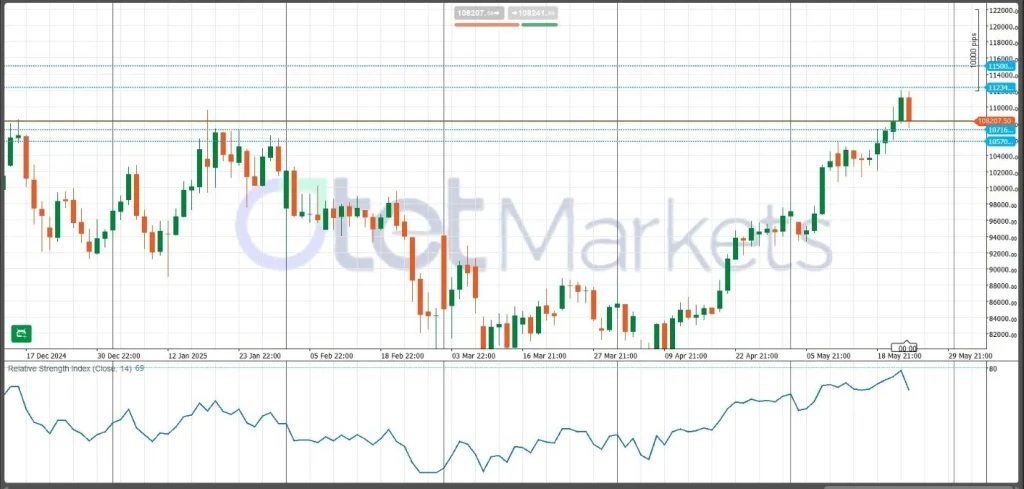
Momentum indicators such as the Relative Strength Index remain elevated but not extreme—hovering near 70—suggesting room for a corrective pullback from recent highs before the next rally. A decisive break above $112,345 could open the path toward $120,000, while a failure to hold $105,700 could see a slide toward the $100,000 zone.
Share
Hot topics
Federal Reserve’s Challenges to Trump’s New Policies
As the Federal Reserve Open Market Committee (FOMC) prepares for its upcoming meeting, all eyes are on how the Fed will respond to Donald Trump’s latest economic policies. With the...
Read more


Submit comment
Your email address will not be published. Required fields are marked *