
Time to Heed Central Banks’ Voices and Digest the Data
- Global Economic Overview
- US Economic Review
- Economic Data Highlights
- Inflation
- Retail Sales & Sentiment
- Industrial Production & Labor
- Manufacturing Surveys
- Housing
- Policy & Trade
- U.S. Economic Outlook
- Existing-Home Sales (Thursday)
- New-Home Sales (Friday)
- U.S. Dollar Outlook
- Technical Outlook: Dollar Index (DXY)
- Wall Street Outlook
- S&P 500 Technical Outlook
- Chinese Economic Outlook
- PBoC Measures & Trade Truce
- PBoC Interest‐Rate Decision and the Yuan
- Gold Weekly Outlook
- Additional Considerations
- Technical Outlook: May 19–25, 2025
- WTI and Global market demand!
- Technical Outlook: May 19–25, 2025
- Bitcoin is still holding above 100K
- Technical Outlook
Global Economic Overview
During the week of May 12–17, 2025, global markets were shaped by a landmark U.S.–China trade agreement announced on May 12, which cut tariffs by 115 percentage points for at least 90 days. While this deal injected a note of optimism—potentially tempering some bearish forecasts—mixed economic data and downward revisions to growth projections underscored ongoing challenges, with renewed recession risks particularly in the U.S. and U.K.
- United States: Headline inflation and producer prices eased, but retail spending and consumer sentiment softened.
- United Kingdom: April inflation was poised to jump sharply amid higher energy and water bills, prompting warnings of “greedflation.”
- Euro area: Consumer prices remained modestly stable.
- China: Exports beat expectations even as the services sector lost momentum.
- Japan: Q1 GDP unexpectedly contracted, even as Tokyo’s core inflation accelerated.
- Oceania: Markets are fully priced in an imminent Reserve Bank of Australia rate cut as core inflation moderates.
- Emerging markets: Faced with downgraded growth forecasts, fiscal strains in South Africa, and competitive pressures from inexpensive Chinese imports.
US Economic Review
Last week opened with a landmark 90-day U.S.–China tariff truce—slashing duties on Chinese imports from 145% to about 30%—which lifted market sentiment but came too late to fully shore up confidence. Small-business optimism slid for a fourth month (NFIB index down to 95.8), driven by weaker hiring, lower capex plans (only 18% expecting increases), and broad uncertainty despite slightly clearer trade policy. Inflation pressures showed tentative signs of easing: headline CPI rose just 0.22% in April, core CPI 0.24%, and year-over-year core at 2.8%, with three-month annualized at 2.1%. Goods inflation remained muted, while services inflation softened on cooler shelter costs. Food prices eased sharply, led by a 12.7% drop in egg prices. Together, these mixed signals support the Fed’s “wait-and-see” stance—with a first rate cut penciled in for September—though the drag of high tariffs leaves the path for inflation and growth still uncertain.
With the 90-day tariff reprieve in place, key indicators yielded mixed signals in April. Retail sales edged up just 0.1%, boosted by front-loaded buying but offset by weakness in core categories, while restaurant and bar spending remained strong. Industrial output was flat overall, but manufacturing slipped 0.4% even as utilities rebounded. Housing starts rose only 1.6% (versus a 3% forecast), and permits fell 4.7%, reflecting hesitation in big-ticket investment. Consumer sentiment plunged to 50.8, the second-lowest reading since 1978—and one-year inflation expectations jumped to 7.3%, underscoring the enduring drag of 30% tariffs and policy uncertainty on the outlook.
Economic Data Highlights
Inflation
The Consumer Price Index (CPI-U) rose 0.2 percent in April—its first monthly gain in two months, bringing annual inflation to 2.3 percent. Core CPI (ex-food and energy) also climbed 0.2 percent (2.8 percent YoY). Meanwhile, the Producer Price Index (PPI) fell 0.5 percent—the steepest drop since 2009, driven by lower services costs; core PPI dipped 0.1 percent, though it remains up roughly 2.9 percent year-over-year.
Retail Sales & Sentiment
Retail sales edged up just 0.1 percent in April (after +1.7 percent in March), while core retail (ex-autos, gas, materials, food services) fell 0.2 percent. Consumer sentiment plunged to 50.8—the weakest since 1980, and one-year inflation expectations jumped to 7.3 percent.
Industrial Production & Labor
Overall industrial output was flat: manufacturing (–0.4 percent) and mining (–0.3 percent) declines were offset by a 3.3 percent rise in utilities, leaving total IP 1.5 percent above last year. Initial jobless claims held at 229,000, underscoring labor-market resilience.
Manufacturing Surveys
The NY Fed’s Empire State index fell to –9.2 and the Philly Fed’s to –4.0. Both showed persistent factory-sector weakness, even as price-paid measures hit multi-year highs, and firms forecast roughly 3.8 percent price gains over the next year.
Housing
Single-family starts declined 2.1 percent to a 927,000 annual rate, and permits dropped 5.1 percent to 922,000 units, reflecting high financing costs and tariff-related material pressures.
Policy & Trade
On May 12, the U.S. and China agreed to a 90-day tariff truce—cutting U.S. duties to 30 percent and China’s to 10 percent—providing a short-term market boost amid lingering longer-term uncertainties.
U.S. Economic Outlook
This week’s U.S. economic calendar is light on headline macro releases but packed with Fed commentary, housing data, and corporate earnings. It kicks off Monday with the Conference Board’s Leading Economic Indicators report and speeches by several Fed officials. Later that day, retail heavyweights Walmart, Home Depot, Target, and Lowe’s will release quarterly results, shedding light on how tariffs are influencing consumer prices and demand. Midweek, a $16 billion, 20-year Treasury auction will take place alongside further Fed remarks. Thursday brings a full data slate—initial jobless claims, the Chicago Fed National Activity Index, S&P flash PMIs, existing-home sales, and a 10-year TIPS reopening. The week concludes with new-home sales figures, completing the U.S. housing market picture amid continuing trade-policy uncertainty.
Existing-Home Sales (Thursday)
In March, existing-home closings fell 5.9% to an annualized rate of 4.02 million, erasing February’s 4.4% gain. Elevated mortgage rates in early spring kept many buyers sidelined, but slower sales allowed inventories to rise—single-family listings jumped 6.5%, lifting total resale stock to 18.6% above year-ago levels. The added supply cooled price growth to 2.9% year-over-year, the softest pace in seven months. We expect April’s closings to rebound 2.7% to 4.13 million, although persistent trade-policy uncertainty and high borrowing costs are likely to keep activity subdued.
New-Home Sales (Friday)
New-home sales climbed 7.4% in March to 724,000 units, the strongest pace in six months—on the back of a brief dip in mortgage rates before they rose again following early-April tariff news. First-quarter closings averaged 684,000 units—up 1.6% from Q4 and 1.3% from a year earlier—driven primarily by the South, while other regions lagged. A decline in the median sale price suggests builders are increasingly relying on incentives. Looking ahead, we forecast April’s new home sales to ease 2.6% to 705,000 units, pressured by higher financing costs, softer buyer traffic, and ongoing policy uncertainty.
U.S. Dollar Outlook
During the week of May 19–25, 2025, three key releases should guide the dollar’s trajectory: the Advance Services Report for Q1 on May 22, April’s New Residential Sales on May 23, and Preliminary U.S. Steel Imports for Consumption (April) also on May 23. Strong sector growth or better‐than‐expected housing sales would likely underpin the dollar by signaling broader economic resilience. Conversely, disappointing reading could rekindle slowdown fears and weigh on the currency. In addition, remarks from Fed officials—Vice Chair Philip N. Jefferson on May 19, Governor Lisa D. Cook on May 20, and Governor Adriana D. Kugler on May 23—could move the dollar: hawkish tones tend to boost it, while dovish comments may exert downward pressure.
Technical Outlook: Dollar Index (DXY)
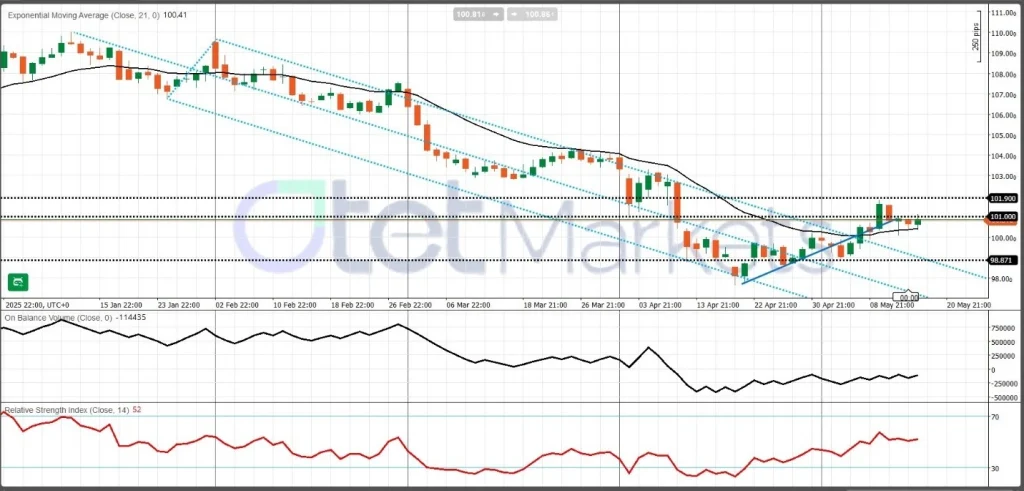
As markets enter the week, the DXY is poised to trade between roughly 99.00 and 101.00. Initial resistance lies at 101.90, with the 100.00 level serving as a key pivot; immediate support is around 99.00. A decisive break above 101.90 would open the door to a further upside, whereas a drop below 99.00 would signal a bearish shift and likely invite additional selling pressure. On the technical front, the Relative Strength Index (RSI) approached overbought levels near 68, warranting caution—though no confirmed reversal signal has yet emerged.
Wall Street Outlook
The 90-day U.S.–China tariff ceasefire has lifted equity markets, but stretched valuations and downward revisions to profit forecasts suggest upside may be limited in the near term. Average U.S. import levies remain elevated at roughly 14 percent (down from 24 percent), posing a headwind to both corporate margins and consumer purchasing power.
S&P 500 companies delivered year-over-year Q1 earnings growth of 13.6 percent, beating consensus estimates—yet Q2 profit forecasts have been trimmed to 4.8 percent, compared with nearly 14 percent projected at the start of the year. Meanwhile, economists now assign less than a 40 percent probability to a U.S. recession (down from 66 percent earlier in May), reflecting tempered but still significant downside risks.
S&P 500 Technical Outlook
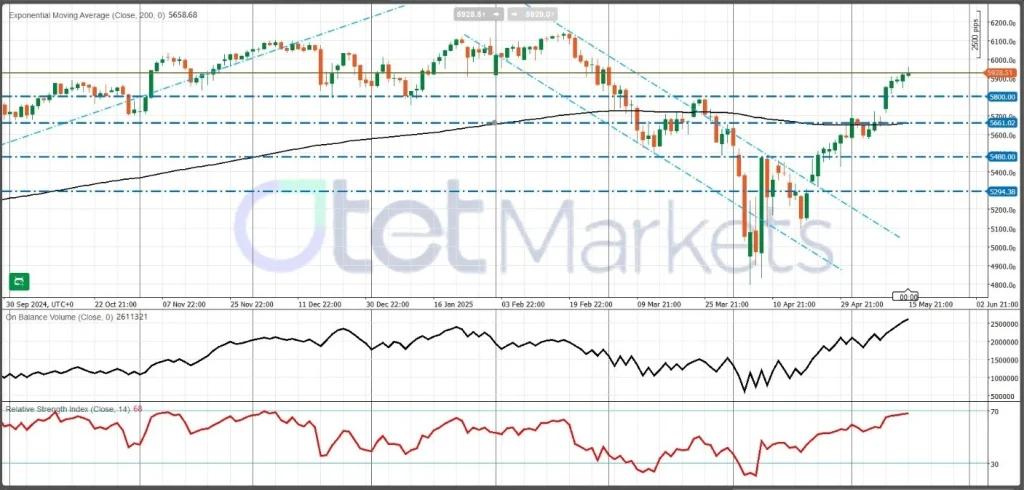
Since early April, the S&P 500 has rallied roughly 18 percent and is currently trading slightly under 6,000. Immediate resistance sits at the 5,800 key level, and then the 200-day moving average (around 5,660). The first resistance level (R1) lies at approximately 6,000, and above that, we can target 6,200. Momentum indicators, such as the RSI, are moving towards overbought territory, indicating that a clear break above resistance or below support will be required to confirm the next directional move.
Chinese Economic Outlook
A recent Reuters poll projects China’s GDP growth will slow to 4.5 percent in 2025, down from 4.8 percent in 2024, as elevated tariffs and weak global demand weigh on exports. The IMF’s October 2024 World Economic Outlook similarly cautioned that growth would decelerate to around 4.5 percent, below Beijing’s 5 percent target, amid structural headwinds and policy uncertainty.
April’s industrial output and retail‐sales figures are also expected to moderate sharply from the first quarter’s post–tariff surge. Consensus forecasts call for factory production to expand 5.7 percent year-on-year and retail sales to increase 6.0 percent. Much of the earlier strength reflected firms front-loading orders ahead of prospective U.S. duties—and a seasonal boost from the Spring Festival—so a pullback in April would signal a return to more normalized demand.
PBoC Measures & Trade Truce
In response to these headwinds, the People’s Bank of China (PBoC) recently cut its reserve requirement ratio and trimmed the seven-day reverse-repo rate to 1.40 percent, alongside other liquidity measures designed to bolster credit growth and maintain financial stability. The 90-day U.S.–China tariff truce has further eased trade-policy uncertainty, providing additional support to both manufacturing and consumption.
Despite these efforts, China’s export growth cooled to 8.1 percent year-on-year in April, while imports slipped 0.2 percent, narrowing the trade surplus but underscoring persistent weakness in overseas demand. In the property market, new‐home sales have diverged regionally, with the South outperforming, yet national transaction volumes remain below pre-pandemic highs. Housing starts and permits continue to lag, hampered by high financing costs and ongoing policy ambivalence.
PBoC Interest‐Rate Decision and the Yuan
On May 20, the PBoC will announce its monthly fix for the one-year and five-year loan prime rates (LPRs). In a Reuters survey, 87–88 percent of economists expect both to remain unchanged at 3.10 percent and 3.60 percent, respectively. These rates have been held steady since January 2025, reflecting the central bank’s cautious balancing act between supporting growth and managing currency stability.
Maintaining the LPRs would reinforce the PBoC’s view that targeted liquidity injections and reserve-requirement cuts are sufficient for now, potentially stabilizing short-term funding costs and underpinnings for the yuan. A surprise reduction in the LPRs, by contrast, would signal a stronger easing bias, likely putting downward pressure on the yuan and upward pressure on bond yields, while modestly boosting credit demand.
Gold Weekly Outlook
Research suggests that gold (XAU/USD) may face near-term headwinds from a firmer U.S. dollar and softer consumer demand in China and India, although geopolitical risks and renewed central-bank buying could provide support. Upcoming U.S. economic releases will further test gold’s appeal as a safe-haven asset.
This week, gold prices plunged over 4%—their steepest weekly drop since last November—after the 90-day U.S.–China tariff truce revived risk appetite and spurred profit-taking. By May 15, spot gold had rebounded 1.3% to $3,218.89 per ounce, buoyed by a softer dollar and weaker U.S. producer-price, retail-sales, and CPI reports.
April data showed U.S. producer prices unexpectedly fell 0.5%, retail-sales growth slowed, and headline CPI rose less than forecast. These softer readings reinforced market wagers on at least one Federal Reserve rate cut by September. The dollar index dipped 0.1%, making dollar-priced gold more attractive to foreign buyers. However, easing recession fears and buoyant equity markets have trimmed bullion’s safe-haven demand.
A recent Reuters poll pushed the average gold forecast above $3,000 per ounce for the first time, reflecting broad analyst confidence in sustained demand. Over the longer term, record U.S. budget deficits underpin gold’s role as a fiscal hedge—David Einhorn has noted that the rally reflects waning faith in fiscal and monetary policy as much as, if not more than, pure inflation hedging.
Additional Considerations
- Consumer Demand Weakness: China and India account for roughly 65% and 25% of global jewelry demand, respectively. A weaker yuan (near 7.22 CNH) and India’s currency devaluation have made gold less affordable, likely dampening demand ahead of the Chinese Spring Festival.
- Geopolitical & Policy Drivers: Persistent tensions in the Middle East and the Russia-Ukraine conflict continue to drive safe-haven flows. Progress—or setbacks—in U.S.–China trade talks could further sway gold’s appeal.
- Central-Bank Buying: After pulling back in 2024 when prices peaked, central banks may resume purchases if gold corrects in 2025, providing a price floor.
- Federal Reserve Speeches: Comments from Fed officials will be key. Hawkish rhetoric and hints at tighter policy could bolster the dollar and pressure gold, while dovish tones and growing rate-cut expectations would likely support bullion.
Technical Outlook: May 19–25, 2025
As of May 16, XAU/USD closed around $3,200, down about 1.0% on the day. After peaking at an all-time high of $3,499.88 on April 22, gold has entered a medium-term corrective phase.
- Moving Averages: Prices remain above the 20-day moving average (MA) at $3,260 and look set to test the 100-day SMA near $3,025 as the next support level.
- Resistance: Immediate resistance lies at the 21-day SMA around $3,308; a sustained move above this level would be required to signal a reversal of the recent downtrend.
- Momentum: The 14-day Relative Strength Index (RSI) sits near 47, below the neutral 50-line, indicating bearish pressure and leaving scope for further consolidation.
WTI and Global market demand!
WTI crude oil extended its weekly winning streak for a second consecutive week as signs of easing U.S.–China trade tensions supported prices, but upside remains limited by looming supply growth and a surprise build in U.S. inventories. OPEC+ and Iran are set to add roughly 810,000 barrels per day of new output between May and June, while the International Energy Agency (IEA) has raised its 2025 global supply-growth forecast, heightening surplus risks.
In the week to May 9, U.S. commercial crude stocks rose by 3.5 million barrels, lifting inventories back toward five-year averages despite robust refinery runs, while American Petroleum Institute data pointed to a further 4.3-million-barrel build.
On the production front, Goldman Sachs expects OPEC+ to boost output by about 410,000 bpd in June, three times the previously agreed pace, as member compliance remains uneven. A potential Iranian nuclear agreement could add another 400,000 bpd to global supplies, and OPEC has already increased production by approximately 411,000 bpd since April.
Despite resilient demand—U.S. motor gasoline deliveries averaged 9.0 mbpd over the past four weeks (up 3.8% year-on-year), and distillate fuel supplied 3.7 mbpd (up 1.4% YoY)—the EIA’s May Short-Term Energy Outlook warns that production growth may outstrip consumption. It projects global oil demand rising by 1.0 mbpd in both 2025 and 2026, but forecasts Brent averaging just $62 per barrel in H2 2025 as inventories swell.
China’s liquid-fuels consumption is expected to grow by only 0.2 mbpd in 2025, reflecting an economic slowdown and tariff pressures. Weak demand from China and other key markets continues to weigh on prices.
Geopolitical and policy developments could tighten supply and support crude: U.S.-Iran nuclear negotiations potentially unlocking 400,000 bpd, renewed sanctions on Russia and Venezuela, and ongoing Middle East tensions all carry upside risk for oil.
Analyst forecasts for 2025 remain mixed but generally bearish: the EIA pegs Brent at $59/bbl—implying WTI near $55–$57—while Fitch expects WTI at $65/bbl, citing rising U.S. production and OPEC+ output increases. Some forecasters argue that stronger demand could propel WTI above $66.50 and toward $68–$69 if conditions improve.
Technical Outlook: May 19–25, 2025
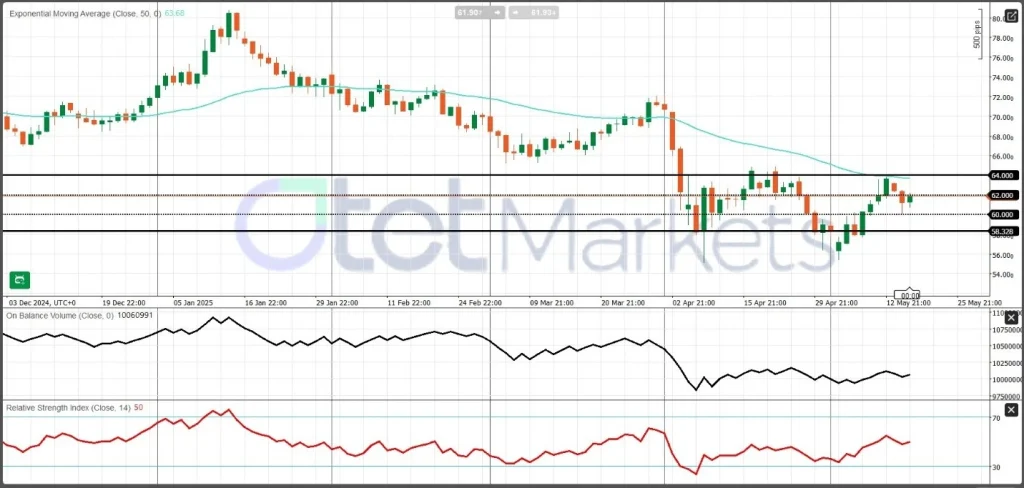
WTI closed at $61.90 bbl on May 16, up roughly 2% for the week, as optimism over the U.S.–China tariff truce supported prices. Despite rebounding from April 30’s low of $58.21, crude remains in a medium-term downtrend.
- Resistance
- Immediate: $62.80, then $64.00 (a key psychological level just above the 50-day SMA).
- Upside Target: A decisive break above $64.00 could propel WTI toward $66.50–$69.00, according to some analysts.
- Support
- First Tier: $60.00
- Secondary: $58.30
- Critical: $56.74 (April low)
- Moving Averages & Momentum
- Prices trade below the 50-day SMA ($64.00) and far below the 200-day SMA ($70.00), confirming bearish momentum.
- The 14-day RSI sits near 50, suggesting the potential for a short-term bounce but no clear reversal yet.
- Short-Term Pattern
- On the hourly chart, prices have formed a rising channel, and the Parabolic SAR is signaling buy entries—but overall momentum remains weak, echoing the broader downtrend on daily and weekly timeframes.
Bitcoin is still holding above 100K
Bitcoin closed near $103,600 on May 16, extending its weekly gains as optimism over the U.S.–China tariff truce bolstered risk appetite and spurred profit-taking across equities and crypto markets. Institutional investors actively reshuffled their spot Bitcoin ETF holdings: Millennium Management cut its iShares allocation by 41%, while new entrants such as Brown University deployed capital, underscoring both renewed interest and strategic caution in ETF-based exposure to BTC.
Softer U.S. inflation data—including a 0.5% decline in producer prices and a smaller-than-expected rise in the CPI—reinforced market expectations for Federal Reserve rate cuts later this year, enhancing Bitcoin’s appeal as both a risk asset and an inflation hedge. Standard Chartered projects that a strategic shift away from U.S. assets could drive Bitcoin toward $120,000 in Q2 2025, highlighting its sensitivity to broad capital flows and geopolitical developments.
Bitcoin’s outlook remains anchored by macroeconomic trends, institutional flows, and regulatory signals. U.S. regulatory filings show hedge funds and asset managers adjusting their spot BTC ETF positions amid recent volatility, while advisory firms steadily build allocations, signaling sustained, incremental ETF adoption despite short-term price swings. According to Reuters’ “Cryptoverse” report, shifting trade-war dynamics and growing skepticism about U.S. policy have prompted investors to seek non-correlated assets like Bitcoin, potentially fueling the next rally if risk-off flows intensify. Reduced exchange inflows point to long-term holder accumulation, even as high trading volumes indicate ample liquidity and volatility. Although China’s economic slowdown—forecast at 4.0%–4.5% GDP growth in 2025—may temper regional demand, global adoption trends remain robust. A supportive monetary policy backdrop, with Fed rate cuts potentially beginning in June 2025, could weaken the dollar and further benefit BTC; however, rising tariffs and inflationary pressures still pose risks.
Technical Outlook
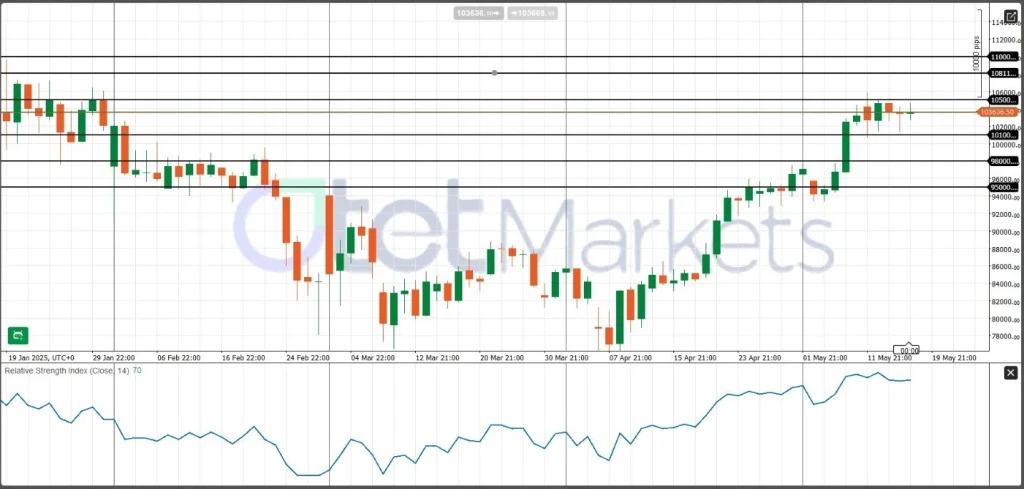
Weekly technical analysis highlights key support, resistance, and momentum dynamics for BTC/USD:
- Current Position: BTC closed last week near 103,600, trading within a rising bull channel. Moving averages maintain upward bias despite calls for a corrective pullback to test support around 95,000.
- Support Levels: 101,000 (first), 98,000 (secondary)—a break below 98,000 could expose 95,000.
- Resistance Levels: 105,000 and 108,000—sustained moves above these would confirm renewed bullish momentum and open targets above the all-time high near 110,000.
Share
Hot topics
Federal Reserve’s Challenges to Trump’s New Policies
As the Federal Reserve Open Market Committee (FOMC) prepares for its upcoming meeting, all eyes are on how the Fed will respond to Donald Trump’s latest economic policies. With the...
Read more


Submit comment
Your email address will not be published. Required fields are marked *