
Week 51 Global Economy Outlook: The Data-Driven Pivot Into Year-End
Global markets enter Week 51 (2025) with a clear late-year theme: policy easing has begun in parts of the developed world, but the path forward is still being set by inflation persistence, cooling labor markets, and uneven growth. Investors are shifting from debating “whether cuts start” to “how far and how fast,” while year-end liquidity and positioning amplify reactions to key data. The week ahead is likely to be defined by macro confirmation points—U.S. jobs and inflation signals, the tone from major central banks, and real-economy readings from Europe and the UK—against a backdrop of fragile consumer momentum and ongoing trade and geopolitical uncertainties.
US Economic Review
The U.S. macro picture over the past week can best be described as cooling, but not breaking. The main event was the December FOMC meeting, where the Fed delivered a widely expected 25 bp rate cut, taking the fed funds target range to 3.50%–3.75%. Chair Powell made it clear that January remains “live,” with policy decisions dependent on incoming data. While there were hawkish dissents and signs that several officials would have preferred to hold rates steady, the overall message is that the Fed still leans toward easing—just with growing uncertainty around the pace.
Recent labor indicators support the view that conditions are gradually softening. Compensation growth moderated, and the JOLTS data signaled a low-hiring environment, slightly higher layoffs, and fewer voluntary quits—evidence that job switching has become harder and the labor market is losing some flexibility. Weekly claims also moved in the same direction, with initial claims ticking higher, though continuing claims eased, suggesting the economy is not yet seeing a meaningful deterioration in unemployment duration.
Away from labor, activity signals were mixed. Consumer sentiment improved slightly, but the wholesale sector looked softer: inventories rose while sales declined, a combination that can become a drag if it persists. The external picture improved materially, with exports rising faster than imports and the trade deficit narrowing. However, part of that improvement was tied to surging non-monetary gold exports, which do not directly lift GDP, so the growth signal is less clean than the headline suggests.
Financial conditions sent a nuanced message. Treasury auctions showed short-end yields easing marginally, while the long end firmed—consistent with a higher term premium and lingering uncertainty about inflation’s endpoint. Liquidity conditions also improved modestly, with reserve balances rising and the Fed balance sheet inching higher.
Looking ahead, the baseline is for underlying inflation to hover around 3% into the first half of 2026, with tariffs potentially keeping goods prices firmer early next year. A softer labor market and solid productivity should help inflation drift closer to 2% later in 2026, but confirmation depends on the next key releases—particularly the combined October–November jobs report and November CPI.
US Economic Outlook!
Markets go into the week with a straightforward narrative: the Fed delivered its December rate cut, and now the data has to confirm whether additional easing is justified. The FOMC lowered the fed funds target range to 3.50%–3.75%, but the internal debate is clearly active, leaving investors focused on whether incoming inflation and labor prints are soft enough to keep the easing path intact—or firm enough to force a pause in January. The backdrop is unusually sensitive because the prolonged government shutdown disrupted parts of the U.S. data calendar, meaning each “clean” release carries more weight than normal.
What’s on the calendar and why it matters
The week begins with Empire State Manufacturing (Monday, Dec 15), an early read on factory activity and pricing pressure. The real market focus arrives on Tuesday, Dec 16, with two critical releases: the employment report and retail sales. Investors will also track other high-frequency indicators—PMI-style surveys and production data—to judge whether growth is stabilizing or cooling into year-end.
On Thursday, Dec 18, attention shifts to CPI for November, the headline inflation event. The Bureau of Labor Statistics has warned that missing October survey data may limit some standard month-to-month comparisons, so markets may emphasize the broader inflation direction over any single number. The same day also brings Q3 retail e-commerce sales, a helpful cross-check on consumer behavior and online spending. Friday’s releases—annual consumer expenditures and county employment and wages—are less likely to move markets immediately, but they can shape the longer-run narrative around household finances and labor-market structure.
What markets will be trading
The central trade is January expectations: strong jobs plus firm CPI would strengthen the case for a pause, while clear evidence of cooling inflation and softer labor conditions would keep easing expectations alive. Rates are likely to remain volatile, especially at the long end, where term premia and uncertainty about inflation’s endpoint can drive swings even after a Fed cut. The dollar and risk assets will key off payrolls and retail sales as “growth pulse” indicators, with CPI acting as the main “policy constraint,” making Tuesday and Thursday the likely volatility peaks.
The three big reports
The jobs release is complicated, likely covering both October and November. October will be partially incomplete, with establishment-survey-based indicators only. A working assumption is -60K payrolls in October due to a one-off drop in federal employment, while ex-federal payrolls may still show growth. November should be more complete, with an estimated +45K payroll gain and unemployment edging up to 4.5%, reinforcing gradual cooling rather than a sharp break.
Retail sales for October are delayed but important. After a soft September, headline sales are expected around +0.1%, with autos weighing and ex-autos closer to +0.2%. Holiday spending should help, but tighter household budgets skew risks toward the lower end of holiday sales expectations.
For inflation, with October CPI missing, the market will interpret November through a two-month lens. Estimates point to ~3.0% headline CPI y/y and ~2.9% core y/y, with goods easing and services moderating. Looking ahead, inflation is expected to hold near 3% into early 2026, then gradually drift toward 2% later in 2026 as labor softens and productivity helps offset tariff-related goods pressure.
USD Technical Review
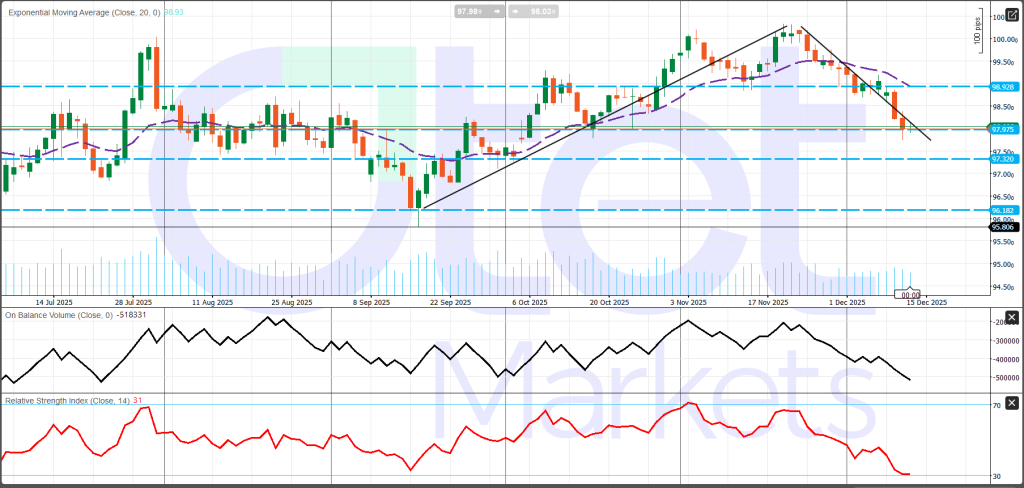
DXY has shifted into a clear bearish swing trend. The September–November rally has been fully reversed, and price is now printing lower highs and lower lows. The index has broken below the prior rising trendline and is tracking a downtrend line from the mid-November peak.
The 20-day EMA has rolled over and DXY is trading beneath it, suggesting rallies are more likely to stall and fade than extend. Momentum is weak: RSI near 31 signals bearish pressure and near-oversold conditions, which can allow a short-term bounce, but does not confirm a durable bottom. OBV continues to fall, pointing to distribution and limited demand.
Key resistance levels are 98.00, 98.93, and the 99.5–100.0 supply zone. Key supports are 97.32, then 96.18 and 95.81. The recent structure resembles a topping pattern, with 98.93 acting like a broken neckline that could be retested before any further downside.
EU Economy and ECB, review and the week ahead
This week’s EU data reinforced a familiar late-year mix: inflation is easing at the margin, but growth remains uneven and confidence is still fragile. Germany provided the brightest activity signal, while Italy’s weaker production and softer eurozone consumer sentiment kept the broader picture constrained. As a result, the overall narrative remains “disinflation with fragile growth,” rather than a decisive turn toward reacceleration.
On activity, Germany’s industrial sector improved meaningfully. Industrial production rose 1.8% m/m in October, beating expectations, and output turned slightly positive on an annual basis (+0.88% y/y). That supports the idea that Europe’s largest industrial base may be stabilizing, even if it is still too early to call a full recovery. In contrast, Italy’s industrial production deteriorated again, down 1.0% m/m and 0.3% y/y, highlighting that the manufacturing rebound is not broad-based. Italy did see a modest labor-market offset, with the unemployment rate easing to 6.1%, offering some support to domestic demand at the margin.
Inflation dynamics were mixed across countries. Germany’s headline CPI held at 2.3% y/y in November, while monthly CPI fell -0.2%, indicating cooler near-term pressure. Harmonized inflation in Germany was firmer at 2.6% y/y, though the monthly HICP decline (-0.5%) still points to softer momentum. France remained the low-inflation outlier, with headline CPI at 0.9% y/y and HICP at 0.8% y/y, both negative on the month. However, France’s core CPI stayed sticky at 2.6% y/y, suggesting underlying services and domestic price pressure has not fully eased. Spain continues to sit in the higher-inflation pocket, with CPI at 3.0% y/y and HICP at 3.2% y/y, flat on the month.
Externally, Germany’s trade flows softened: exports rose only slightly while imports fell, and both the trade balance and current account surplus narrowed. Sentiment remained cautious overall—Sentix improved but stayed negative, while eurozone consumer sentiment slipped, even though France and Italy improved modestly at the country level.
Rates were mostly steady across core bill auctions, but Italy stood out: the 3-year BTP yield rose to 2.58%, a reminder that funding conditions remain more sensitive where risk premia matter.
Eurozone Economic Outlook and ECB — Week Ahead
This is an ECB-led week, with markets focused less on the daily data noise and more on what the central bank signals about the next phase of policy. The December flash PMIs and Germany’s Ifo survey will shape expectations going into the meeting, but the main catalyst will be Thursday’s ECB decision, press conference, and updated staff projections. If activity indicators hold up and the ECB’s forecasts lean slightly more optimistic on growth—as recent remarks from President Lagarde have hinted—investors may shift from debating near-term easing to debating how long policy needs to stay restrictive.
The macro backdrop is finely balanced. Inflation is close to target—Eurostat’s flash estimate puts November HICP at 2.2% y/y—but the composition matters. Services inflation remains the key concern because it is typically stickier and more wage-sensitive. At the same time, improving growth projections would reinforce a “higher-for-longer” bias even if headline disinflation continues. In short, communication and forecasts matter as much as the data this week.
The calendar starts Monday with Eurostat releases on business registrations/bankruptcies and industrial production. Tuesday brings the flash Eurozone PMIs, one of the best real-time reads on growth momentum and pricing pressure, alongside routine ECB balance sheet and financial statement updates that can still influence flow narratives. Wednesday marks the start of meeting risk, with the Governing Council gathering (Day 1), an updated seasonally adjusted HICP dataset, and Germany’s Ifo Business Climate—a crucial confidence gauge for the region’s largest economy.
Thursday is the focal point: the ECB’s rate decision and projections will be judged on three things—how the Bank frames inflation persistence versus continued disinflation, whether it views growth as resilient or fragile, and what the new forecasts imply for the reaction function. Friday’s Wage Tracker and balance-of-payments data are secondary, but relevant for wage pass-through and euro flow stories.
Market implications are clear: front-end rates will follow the ECB’s guidance, the euro will be most sensitive around Thursday, and equities/credit will respond to any shift in the inflation-risk tone.
Our base case is for the ECB to hold the Deposit Rate at 2.00%, with policy likely staying steady well into 2026. The projections—especially on growth and services/wage inflation—are the key swing factor.
EURUSD (Daily) – Technical Outlook
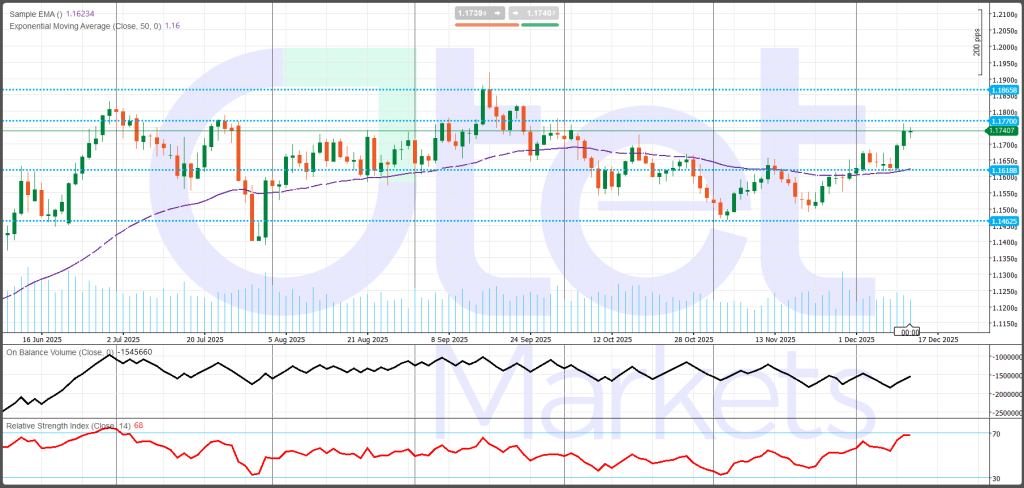
EURUSD remains in a bullish short-term trend. Since the early-November low, the pair has steadily posted higher lows and pushed back into the upper part of its late-2025 range. The latest move looks like a clean break above 1.1700, and holding that area through mid-December keeps the momentum constructive.
From a trend filter perspective, EURUSD is now trading above the 50-day EMA near 1.1600, which has stopped acting as resistance. The faster EMA around 1.1620 is also below price, reinforcing a shift from “sell rallies” to a more buy-the-dip tone as long as the pair stays above these averages.
Momentum is strong, with RSI near 68, meaning the uptrend can extend but pullbacks become more likely if price stalls near resistance. OBV has stabilized and is edging higher, supporting the breakout.
Key resistance sits at 1.1770, then 1.1856. Support levels to watch are 1.1700, then 1.1619; a deeper failure would put 1.1463 back in focus.
UK and BoE
The latest UK data flow reinforced a clear message: the economy is operating close to stall speed, with demand weakening and only patchy support coming from industry. The overall mix points to fragile growth and rising sensitivity to downside risks—exactly the kind of backdrop that keeps the Bank of England debate centered on when and how fast easing can proceed.
Growth momentum remains flat-to-negative. October GDP fell -0.1% m/m, missing expectations for a modest rebound, while annual growth held at 1.1% y/y, below forecasts. The broader trend softened as well, with 3M/3M GDP slipping to -0.1%. Forward-looking signals did not improve meaningfully: the NIESR monthly GDP tracker also edged down to -0.1% in November, suggesting momentum has not picked up heading into year-end.
The main drag remains services—the backbone of the UK economy. The Index of Services was flat, undershooting expectations and cooling from the prior month. With services representing the bulk of output and employment, this stagnation is a key reason headline growth continues to struggle.
Industry offered a brighter spot, but the recovery remains limited. Industrial production rose 1.1% m/m in October and manufacturing output increased 0.5%, signaling a rebound after a weak prior month. However, the annual picture is still negative, with both industrial and manufacturing production down 0.8% y/y. In other words, the sector is stabilizing at the margin, but not yet expanding in a durable way.
Construction deteriorated again, with output falling -0.6% m/m and annual growth slowing to 0.9% y/y, consistent with tight financing conditions and softer demand.
The external sector added another concern: the trade deficit widened sharply to -£22.54B, and the non-EU deficit expanded notably. This implies trade is not offsetting domestic weakness and may be adding to growth headwinds. Consumer sentiment improved slightly, but it has not yet translated into stronger activity.
Policy-wise, this backdrop supports the case for easing over time. A softer labour report and benign CPI would strengthen the argument for near-term cuts, but if wages and services inflation stay firm, the BoE is likely to signal a slower, more measured cutting path.
UK Economic Outlook — Week Ahead (Dec 15–20, 2025)
The UK heads into the week with a clear late-year setup: growth is cooling, and the Bank of England is moving closer to an easing phase—but the timing and pace will still be governed by wages and services inflation. Reuters polling has put a 25 bp cut at the December 18 meeting at the center of market expectations, but the decision alone is not the full story. Traders will care just as much about the vote split, the tone of the statement, and whether the BoE offers any meaningful guidance on how policy might evolve through 2026.
The macro backdrop has become less supportive. Recent ONS releases reinforced the “late-year slowdown” narrative: GDP slipped in October and the three-month growth rate also weakened. That softness has sharpened focus on whether policy is now becoming too restrictive for an economy struggling to generate momentum, even as the BoE continues to highlight uncertainty and lingering inflation risks.
In practice, the market will follow a simple chain reaction this week: labour market → inflation → BoE decision → retail demand. Tuesday’s labour-market report is the first key input, especially because wage trends are central to domestically generated inflation. Wednesday’s CPI print then arrives at exactly the wrong time for policymakers—one day before the MPC decision—making it an immediate driver of both the rate call and the guidance. Thursday’s BoE meeting is the main event risk for sterling and the UK front end, while Friday’s retail sales data will test how resilient consumers are into year-end, particularly after private surveys suggested spending stayed cautious through November.
Market pricing will hinge on whether data support “cut now and continue” or “cut cautiously and slow the pace.” A softer labour report combined with a benign CPI outcome would strengthen the case for near-term easing. If wages and services inflation remain sticky, the BoE is more likely to lean toward a measured, gradual cutting cycle.
Our base case is a 25 bp cut to 3.75%, followed by a quarterly easing path through mid-2026, taking Bank Rate toward 3.25%.
GBPUSD (Daily) — Technical Overview
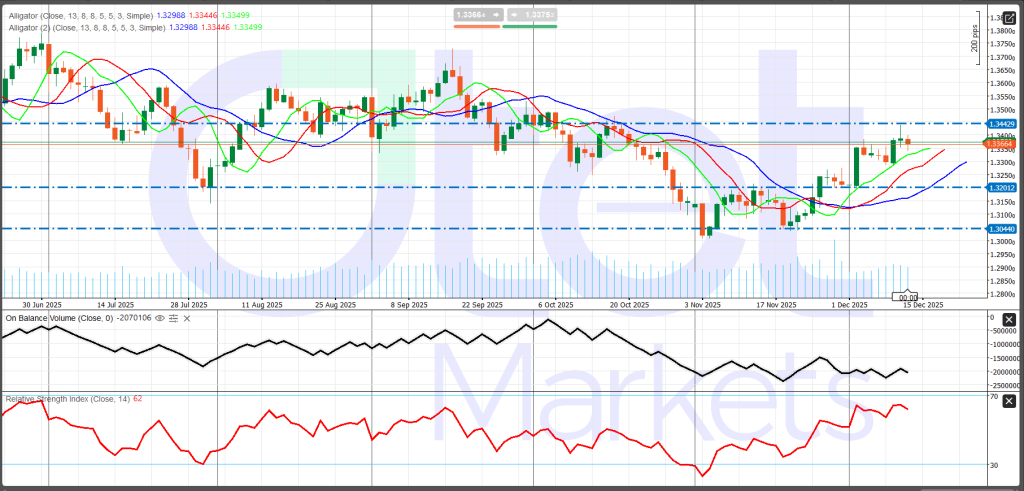
GBPUSD’s September–November downtrend has been interrupted by a sharp rebound, and the pair has been building a healthier structure since the November low with a run of higher lows. However, it still looks more like a recovery move inside a broader range than a clean long-term breakout, because price is now pushing into a clear overhead supply zone.
The Alligator indicator has turned supportive: the lines have re-aligned bullishly and are starting to fan out, which typically signals an uptrend attempt. As long as price holds above the faster lines, the bias remains buy-the-dip rather than sell-the-rally.
Momentum is constructive but not risk-free. RSI around 62 confirms bullish pressure, yet it’s high enough that pullbacks can appear quickly if price stalls into resistance. OBV has stabilized, suggesting selling pressure has eased and the rebound is being supported.
Key resistance is 1.3366–1.3400, followed by 1.3443—a daily close above 1.3443 would be the clearest breakout signal. Support sits at 1.3201, with 1.3044 as the major line in the sand.
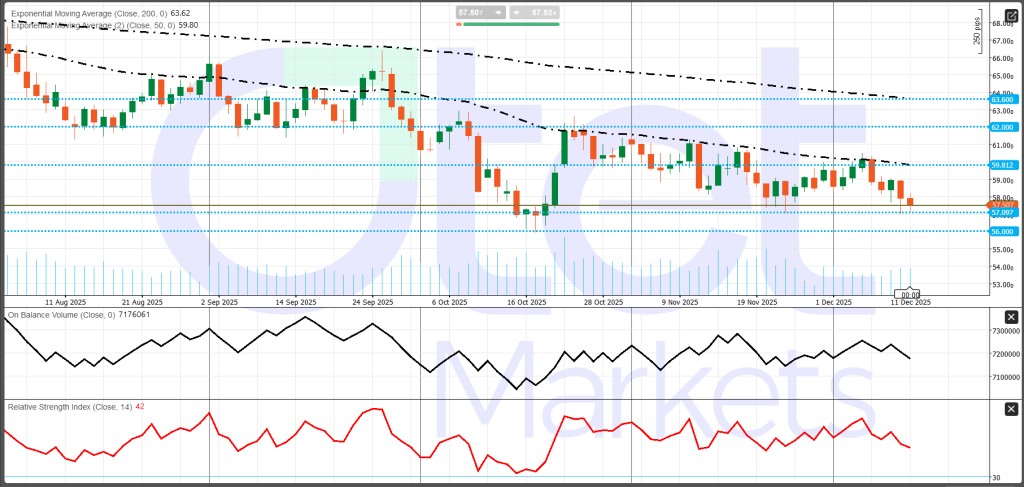
Gold Market Conditions and Weekly Outlook
Gold begins the week just below record highs, consolidating around $4,300/oz as the market shifts back into a strongly macro-driven regime. The Fed’s December cut to 3.50%–3.75%, combined with visible divisions inside the FOMC, has made gold increasingly sensitive to every major U.S. data point. The setup is constructive—dips are still being bought—but the risk of sharp pullbacks is real if inflation or labor releases force investors to question how quickly the Fed can ease again.
Our base case is range trading with a bullish bias. Downside moves should continue to attract buyers, supported by steady official-sector demand and supportive positioning. But a durable upside extension likely needs confirmation from the data: cooler inflation and/or a softer labor market would help push real yields and the dollar lower, creating room for gold to break higher.
The cross-asset backdrop is mixed. The dollar has firmed modestly, which can act as a headwind if it persists. Bonds remain volatile; any renewed selloff in duration that lifts yields could cap gold’s upside even in a broadly supportive macro environment. Silver’s sharp swings are also keeping the precious metals complex in focus and may amplify short-term volatility in gold.
Fundamentally, gold is still trading as a real-yield and USD hedge. While the Fed has started easing, internal disagreement increases two-way risk: stronger inflation or resilient labor data could revive “January pause” pricing, pushing yields higher and pressuring gold. At the same time, central bank buying remains a structural tailwind, with the World Gold Council reporting 53 tonnes of net purchases in October. Positioning also supports the trend—speculative net longs have risen to roughly 210,000 contracts—but that exposure can make corrections more violent if the macro tape turns against the trade.
This week’s risk is concentrated in the U.S. calendar, including Empire State manufacturing, payrolls, retail sales, CPI, existing home sales, and Michigan sentiment. If data drive yields higher, the $4,200 area becomes the first key level where dip-buying should be tested. If the data cool, a clean move through $4,300 could trigger momentum-driven follow-through, though volatility is likely to stay elevated.
Beyond the numbers, watch Fed messaging closely: references to “insufficient clean data” and ongoing dissent increase the odds of abrupt repricing in rate expectations, which will continue to be the main swing factor for gold.
Technical Map (High-Level)
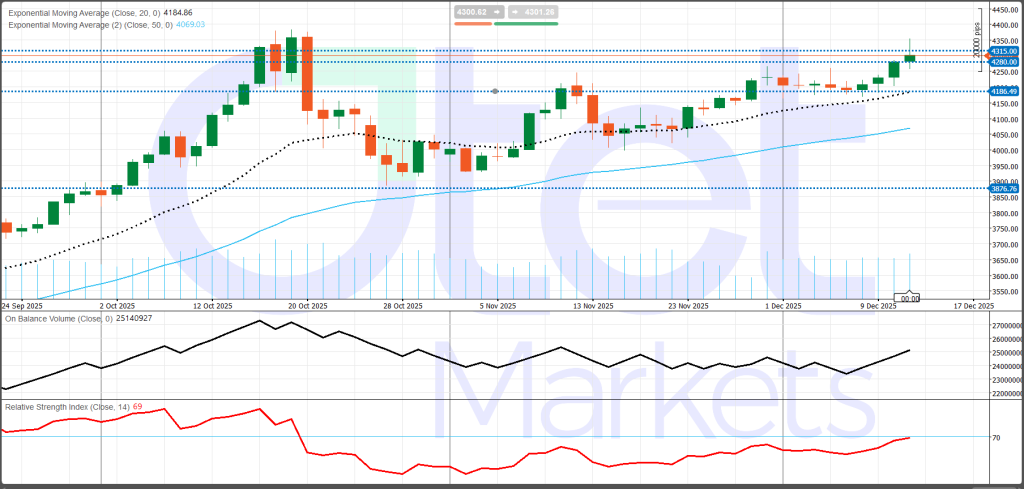
Given the scale of the 2025 rally, we focus on psychological and macro-validated zones rather than overly precise technical levels:
- Resistance: $4,280–$4,315 (post-FOMC highs and recent settlement area)
- Initial support: $4,220, followed by $4,185 (20-day moving average)
- Key pivot: $4,000 (major psychological level; a break would raise the risk of deeper deleveraging)
Energy Market & WTI Weekly Outlook
Crude starts the week on a softer tone as oversupply concerns move back to the center of the market narrative. Pricing is being pulled in two directions: many forecasts still imply a surplus-style balance, while geopolitical risk can still spark sharp, short-lived rallies. Recent price action suggests traders are prioritizing the supply-heavy view—Reuters noted that markets largely brushed aside Venezuela-related seizure risks and stayed focused on abundant supply. The IEA’s latest framing also leans bearish, pointing to global supply exceeding demand next year by roughly 3.84 mb/d.
The core debate remains supply versus demand, with a notable split in institutional outlooks. The IEA continues to emphasize a sizable surplus, while OPEC’s reporting implies a tighter balance into 2026. That divergence keeps volatility elevated around headlines and key data releases, even if the gap between the two narratives has narrowed somewhat in recent months.
In the U.S., upstream signals look steady rather than accelerating. Baker Hughes data showed oil rigs edging up to 414 from 413, while total rigs slipped to 548 from 549, reinforcing the message of stable activity rather than a new wave of supply pressure.
The latest EIA inventory snapshot delivered a mixed message. On the supportive side, crude inventories fell by 1.8 million barrels, a constructive near-term signal. However, the more important warning sign came from refined products: gasoline inventories surged by 6.4 million barrels and distillate stocks rose by 2.5 million barrels, suggesting end-demand is not absorbing refined supply cleanly. Refining metrics were also slightly softer overall—utilization rose only modestly, crude runs slipped, gasoline production fell, and distillate production increased. In plain terms, the crude draw helps, but the big product builds keep rallies contained until downstream balances tighten.
Natural gas remains volatile but has eased recently, with Henry Hub near $4.61/MMBtu. While gas is usually a secondary driver for crude, it can influence sentiment through winter weather expectations and broader energy-risk positioning.
Looking ahead, three forces matter most: (1) the surplus narrative remains dominant, so rallies need a real demand surprise or a disruption that meaningfully affects physical flows; (2) OPEC+ discipline is supportive, with output increases paused for early 2026 and cuts still in place, but it may not be enough without product tightening; and (3) geopolitics remains tradable “optionality,” not the base case.
For WTI, the week’s key question is whether inventories and products confirm tightening or reinforce oversupply. The EIA report on Wednesday (Dec 17) is the main catalyst. Technically, $60–$62 is the primary resistance zone, $56–$57 is key support, and $54 is the next downside shelf if product builds persist.
Cryptocurrency Market & BTC Weekly Outlook
Bitcoin enters the week holding near $90.5k after a volatile period that followed the Fed’s December cut and a noticeable increase in sensitivity to U.S. macro headlines. The best way to describe the current setup is event-driven consolidation: price is stabilizing, but conviction is still fragile, and the next directional move will likely be determined by the week’s two major catalysts—Tuesday’s employment report and Thursday’s CPI.
At this point, BTC is behaving less like a purely crypto-specific story and more like a high-beta macro asset. In practice, that means the same variables that drive broader risk appetite—rates expectations, liquidity conditions, and the dollar/real-yield channel—are increasingly setting the tone. The central question is simple. If U.S. data come in soft enough to validate easier financial conditions—through weaker inflation and/or a cooling labor market—BTC has room to push higher and test the upper resistance zone. If inflation surprises on the upside or the labor market looks firmer than expected, markets could quickly reprice toward a more restrictive outlook, putting the $90k level at risk and potentially reversing some of the recent stabilization.
Flows remain an important cushion beneath the market. Institutional demand has stayed constructive: CoinShares reported $716 million of weekly inflows into digital asset ETPs, lifting total assets under management to $180 billion, still below the prior peak. In a sideways, headline-sensitive market, that matters because flows often decide whether dips are bought quickly or whether prices drift lower as liquidity thins and traders de-risk.
Beyond the macro calendar, crypto-specific headlines add another layer of uncertainty. S&P Global’s downgrade of Tether (USDT) to the lowest tier on its stablecoin assessment scale has the potential to widen risk premia by raising questions about liquidity quality and counterparty comfort—even if it does not create immediate stress. Corporate and equity-related narratives also matter. BTC-linked equities continue to shape sentiment, with Strategy’s Nasdaq 100 inclusion and MSCI’s review of benchmark treatment for digital-asset-focused firms creating another channel for volatility through equity-led flows.
Finally, ETF/ETP flows remain the market’s best real-time “support gauge.” Continued inflows would reinforce dip-buying behavior; any meaningful deterioration in flows would increase the risk that consolidation resolves lower.
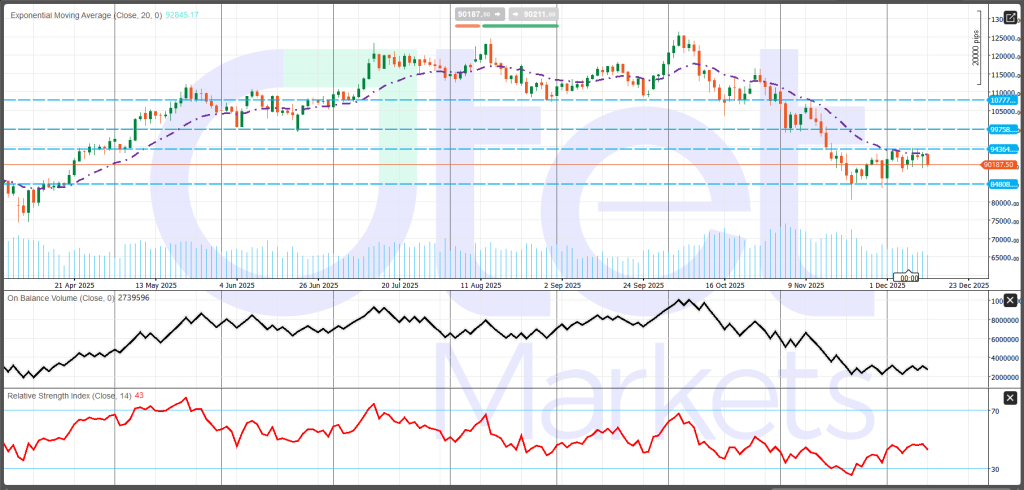
BTC (Daily) — Technical condition
BTC has been in a clear downtrend since the October peak near 125k, with the late-November selloff locking in lower highs and lower lows. Early December has looked more like base-building than a true reversal, because it’s still happening below prior breakdown levels.
Technically, the picture remains cautious. Price is sitting below the falling 20-day EMA (~92.8k), which means rallies are still likely to run into supply near that average. RSI around 43 shows momentum has improved from oversold conditions, but it’s still below 50—typical of consolidation in a bearish regime. OBV has flattened after dropping sharply in November, suggesting selling pressure has eased, but there’s not yet a clear accumulation signal. Volume also fits a repair phase: heavy on the decline, lighter on the rebound.
Key resistance levels are 92.8k, then 94,364, with bigger pivots at 99,758 and 107,777. Support starts at the $90k pivot, with 84,808 as the critical line in the sand.
Bottom line: this week is likely to be macro-driven, with jobs and CPI determining whether BTC can retest 92.8k–94.4k or risks breaking down below $90k.
Share
Hot topics

What is Balance in Forex? A Complete Guide for Traders
Introduction When you open a trading account for the first time, one of the first numbers you see on your screen is your balance. It looks simple. It looks clear....
Read more


Submit comment
Your email address will not be published. Required fields are marked *