
U.S. inflation data and the People’s Bank of China’s monetary policy meeting, Markets in the week ahead!
In the United States, the economy remains uneven. Consumer demand is resilient—August retail sales rose 0.6%, buoyed by e-commerce and auto purchases—but industrial production and housing continue to lag. Housing starts fell 8.5% in August and permits have declined for five consecutive months, underscoring structural weakness in construction. The Federal Reserve responded by cutting rates 25 bps to 4.00–4.25%, its first move since December 2024. Projections imply two more cuts this year to support labor demand, even as inflation remains above target. The Fed faces a delicate balance: easing policy enough to sustain growth while guarding against renewed price pressures.
Abroad, attention turns to the PBoC, which meets at the start of the week. China’s August data disappointed across retail sales, industrial output, and investment, signaling continued fragility and keeping markets alert for fresh stimulus. Investors will watch whether the PBoC follows global easing trends—after Canada, Norway, and Indonesia all cut rates—or holds steady as it did in mid-September. Together, U.S. inflation figures and Chinese policy direction will guide sentiment across equities, commodities, and currencies in the days ahead.
U.S. Weekly Economic Review — Mid-September 2025
The U.S. economy maintained stronger-than-expected momentum in mid-September. The Atlanta Fed’s GDPNow estimate for Q3 was revised up to 3.4%, underpinned by solid retail sales and surprising strength in the Philadelphia Fed manufacturing survey, even as the New York Empire State index highlighted ongoing regional weakness. Industrial production managed a small monthly gain, though year-over-year growth slowed, and capacity utilization held steady.
Consumers remain the backbone of growth. Retail sales in August outperformed across all measures, rising 0.6% month-over-month and 5% year-over-year, with strong contributions from core and control categories. However, housing continues to drag: builder sentiment fell to its lowest since the pandemic, housing starts dropped 8.5%, and permits fell for a fifth consecutive month, signaling deeper weakness ahead.
The labor market remains resilient, with jobless claims well below expectations and continuing claims edging down, reinforcing stability in employment. Inflation pressures were mixed—import prices showed little momentum, while export prices climbed, reflecting steady demand. Energy data pointed to softer natural gas prices from higher storage, while oil rig counts suggest stable output capacity.
Policy developments took center stage as the Federal Reserve cut rates by 25 bps to 4.25%, its first move of 2025. The updated dot plot suggested scope for as many as two more cuts this year, though robust spending and activity data may complicate the pace of easing. Market pricing shows a high probability of another cut in October. Meanwhile, liquidity remains tight, with bank reserves declining, even as foreign buying of Treasuries provided some relief.
Overall, the economy remains stronger than expected, driven by consumer spending and selective industrial strength, but housing weakness, tighter liquidity, and uneven capital flows highlight vulnerabilities. The Fed’s path forward will remain highly data dependent.
U.S. Weekly Economic Outlook
The week ahead brings a busy economic calendar, with housing data, S&P Global flash PMIs, durable goods orders, and the all-important Personal Income & Outlays report, including the Fed’s preferred inflation gauge, the PCE index. Together, these releases will provide investors with a clearer picture of September’s momentum, the resilience of consumer demand, and the outlook for Fed policy.
Housing and PMIs
The first focus will be on housing markets and the September flash PMIs (Tue–Wed). Housing remains weak: existing home sales rose 2.0% in July but remain nearly flat year over year, while new home sales slipped 0.6% in July and are down 8.2% from a year earlier. Builder incentives such as price cuts and mortgage rate buy-downs are losing effectiveness, while higher unemployment and lingering affordability constraints weigh on demand. Mortgage rates have eased to an 11-month low of 6.26%, but August sales are still expected to contract—forecasts point to a 0.6% drop in new home sales to a 648K pace, and a 1.5% fall in existing sales to 3.95M. PMIs will provide insight into whether August’s rebound in manufacturing and steady services activity carried into September, with markets watching new orders, employment, and price-paid indices.
Durable Goods and Investment
On Thursday, attention shifts to durable goods orders for August. Manufacturing remains under pressure, with growth concentrated in only a few sectors, while business sentiment stays soft. Headline durable orders are expected to rise 0.6%, led by transportation equipment, particularly aircraft and autos. Excluding transportation, orders likely fell 0.2%. After a sharp 3.3% jump in core shipments in July, some payback is anticipated, though underlying core non-defense capital goods shipments remain steady and should support a decent Q3 outcome for equipment investment.
Personal Spending, Income, and Inflation
Friday’s Personal Income & Outlays report will be the week’s marquee event. After July’s 0.3% real gain, consumer spending is expected to rise another 0.2% in August. Retail sales were stronger than expected, supported by auto sales (boosted by expiring EV tax credits) and resilient online spending. Still, households face headwinds: higher essential prices, tariff-related inflation fears, and a tighter labor market. Income growth has slowed to below pre-pandemic trends, with August projected at +0.3% nominal (~0% real). Inflation signals are expected to align with earlier CPI/PPI data, with PCE at +0.3% m/m and core PCE at +0.2%, leaving annual core inflation elevated at 2.9%.
Market Implications, Wall Street
Wall Street enters the week cautiously. Equities initially rallied after the Fed’s September rate cut but confusion around its forecasts and mixed economic signals led to choppy trading. This week’s data will set the tone: softer PCE alongside steady PMIs would reinforce the “slow cut” narrative and support risk appetite, while stronger inflation or weaker investment could tighten financial conditions.
Rate-sensitive sectors, especially housing and consumer discretionary, remain in focus as lower mortgage rates offer support but also raise GDP expectations, potentially slowing the Fed’s easing pace.
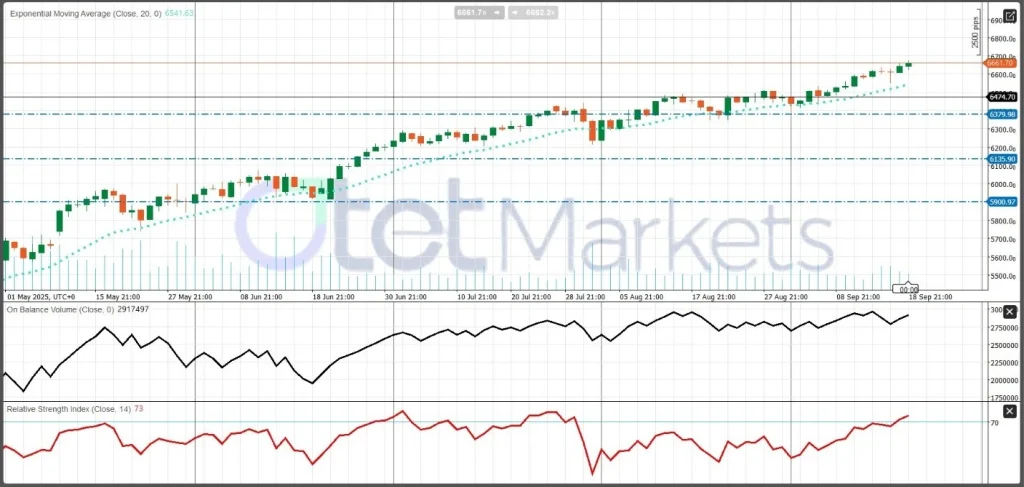
Technically, the trend remains bullish, with RSI in overbought territory and rising buy demand, though cautiously. Bulls could lose ground if prices fell below the 6,350 level, while holding this support would keep the door open for new higher highs.
U.S. Dollar Outlook
The dollar begins the week softer, near two-year lows, after initially sliding post-Fed before recovering on Powell’s comments and stronger data. Its near-term direction hinges on PCE and PMI price components. Softer inflation would likely extend USD weakness, while firmer data could stabilize or lift the greenback.
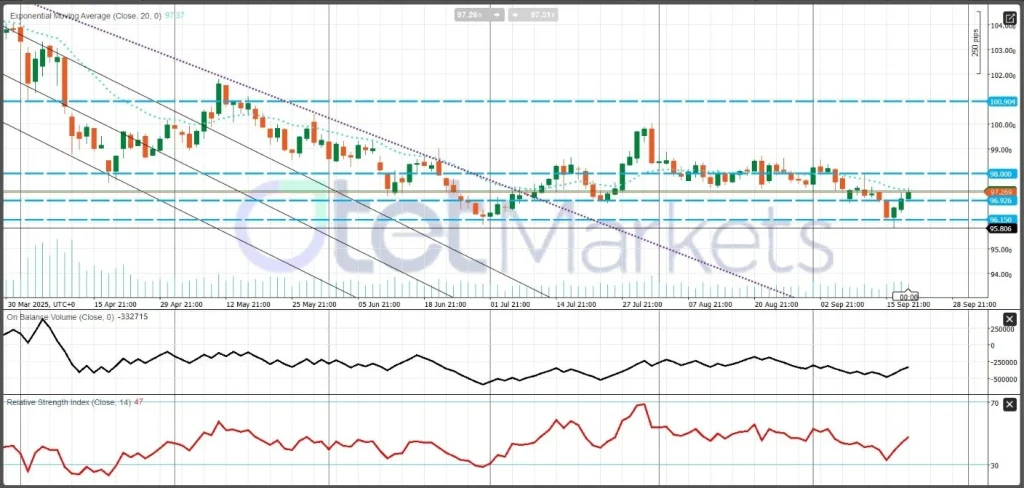
On the technical front, DXY continues to trade sideways as sectors push against each other without clear dominance. The 96–98 range marks the current band of consolidation, and a breakout on either side would set the next trend.
China’s Weekly Economic Outlook
China’s economy enters late September in a fragile stabilization phase. August data painted a mixed picture, with some indicators showing mild improvement but most falling short of expectations. Industrial output and exports managed to firm modestly, yet investment, consumption, and the property market continued to weaken. Together, these trends highlight an economy still struggling to find traction, with policy support expected to remain accommodative into Q4.
Growth & Activity
Industrial production rose 5.2% year over year in August, down from 5.7% previously and below expectations. Year-to-date growth slowed to 6.2%, underscoring only marginal gains. Fixed asset investment showed the sharpest deceleration, increasing just 0.5% versus 1.6% in July, reflecting weaker business confidence and subdued infrastructure spending. Retail sales also missed forecasts, climbing only 3.4% compared with 3.8% expected, while year-to-date sales slowed to 3.67%. Soft consumer activity highlights households’ cautious stance, driven by labor market uncertainty and declining property wealth.
Prices & Property
House prices fell 2.5% year over year in August, a slightly smaller decline than July’s 2.8% drop. Nonetheless, persistent property weakness remains a major drag on household wealth, private investment, and overall sentiment. With the sector deeply intertwined with local government finances and banking stability, its prolonged slump is among Beijing’s most pressing challenges.
Labor Market
The urban unemployment rate rose to 5.3% in August from 5.2%, suggesting renewed strain, particularly for younger workers. The combination of slower job creation and weaker consumption reinforces a cautious household outlook.
External Sector
Trade showed tentative stabilization but remains fragile. Exports fell 1.2% year over year, better than July’s 4.3% decline, yet still contracting. Imports dropped 4.1%, reversing the prior month’s gain and signaling weak domestic demand. The trade surplus narrowed to $6.5 billion, in line with forecasts but below July’s $9.1 billion. While external demand improved slightly, global trade frictions, especially with the U.S., continue to weigh on prospects.
Policy & Week Ahead
The People’s Bank of China (PBoC) meets this week under pressure to respond to softening data. It kept rates unchanged in mid-September, even as the U.S. cut, preferring fiscal and targeted measures. Markets expect any new announcements—whether fiscal spending, property support, or consumer incentives—to be closely scrutinized. Smaller signals, such as property developer activity, durable goods sales, or auto demand, will also be watched to gauge consumer sentiment.
Risks & Scenarios
The downside scenario is that stimulus proves too weak or slow, eroding confidence further, while sharper export declines or renewed trade restrictions could drag 2025 GDP growth below the government’s ~5% target. The upside rests on stronger services consumption, stabilization in Tier-1 housing markets, and more visible credit support, which could keep growth closer to target.
Yuan Outlook
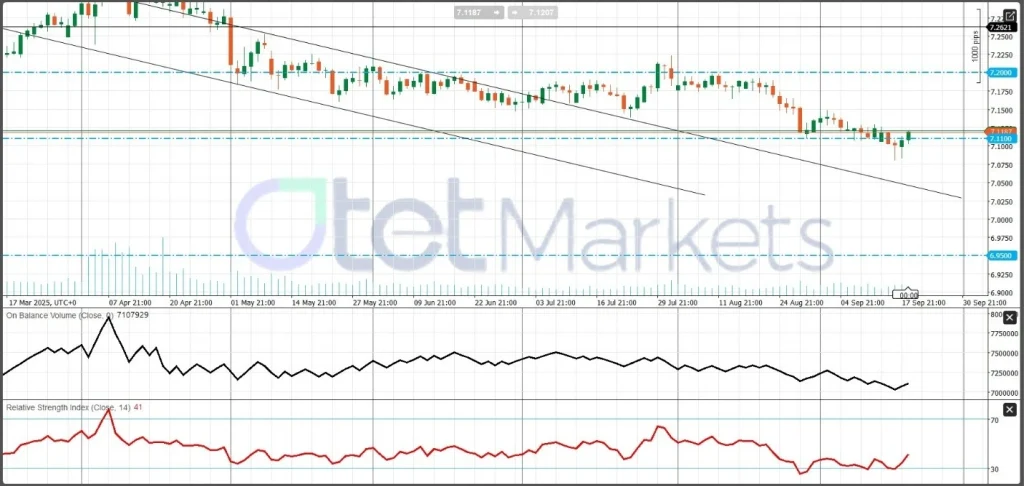
USD/CNH remains range bound. Support sits at 7.11 and 7.05, while resistance is seen between 7.13–7.17 and higher at 7.18–7.20. Current momentum is neutral to mildly bearish, with risks of testing below 7.11 unless policy support or macro surprises provide direction.
Bottom line: China’s economy is struggling to regain momentum. Without stronger stimulus or an external demand recovery, growth risks remain tilted to the downside heading into Q4.
Gold — Current Condition & Weekly Outlook
With policy easing underway, real yields edging lower, and macro uncertainty still elevated, dips remain favored for medium-term buyers.
Gold enters the week with strong macro tailwinds. The Fed’s September 25 bps cut reinforced expectations for further easing into year-end, while a softer dollar and ongoing geopolitical risks continue to attract dip-buyers. Recent headlines have highlighted how the combination of rate cuts and safe-haven demand has propelled bullion to record levels this year, with some banks projecting much higher long-run targets if the easing cycle continues. The key near-term catalyst is Friday’s PCE inflation report. A benign core reading would validate the “slow-cut” narrative and keep real yields drifting lower—typically bullish for non-yielding assets like gold.
Beyond the Fed, central bank purchases remain a structural driver of demand, while signs of slowing growth in China add a defensive bid as investors hedge downside risks. China’s August data—sluggish retail sales and weaker industrial output—kept expectations of additional policy support alive. If Beijing signals more stimulus, it could buoy commodities broadly while also weakening the dollar via the global-growth channel.
Key drivers in the week ahead:
- PCE (Fri): the primary volatility catalyst for real yields and the dollar.
- PMIs (Tue/Wed): critical for gauging growth and inflation trends through prices-paid components.
- ETF flows and central-bank purchases: any signs of renewed inflows would amplify upside momentum.
The risk skew remains tilted in gold’s favor unless data show a re-acceleration in inflation that pushes terminal-rate expectations higher. A stronger-than-expected PCE and rising real yields could put gold in a vulnerable spot, triggering a two-stage pullback: first to the breakout shelf, then toward the medium-term moving average cluster.
Technical Outlook
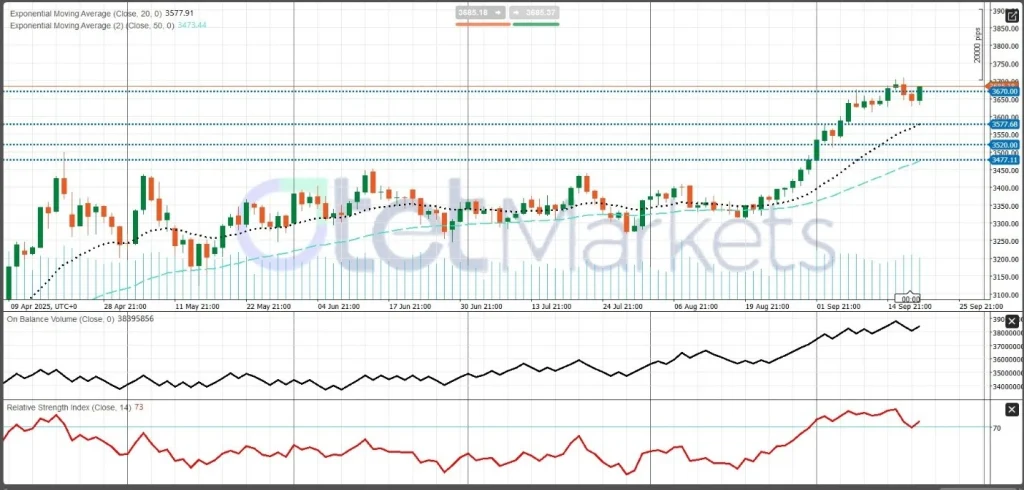
The technical picture remains constructive but stretched. Momentum gauges are elevated following the post-Fed surge, favoring a “buy dips, not breakouts” approach in the near term. The prior breakout zone serves as the first support, with the rising 20-day EMA at $3,577 as the critical line-in-the-sand. A daily close below this level would warn of a deeper pullback toward the 50-day trend line near $3,477, where trend-followers are likely to step back in.
On the upside, a sustained close above last week’s spike high would confirm that the path of least resistance remains higher. Traders should also monitor positioning signals: if prices make new highs without confirmation from RSI or MACD, it could point to short-term exhaustion and the risk of a corrective pause.
Crude Oil — Current Condition & Weekly Outlook
Oil enters the week caught between three forces: near-term inventory dynamics, supply signals from OPEC+ and U.S. shale, and the macro demand path heading into Q4.
The latest EIA Weekly Petroleum Status Report showed commercial petroleum inventories rising, with a notable build in distillates. While seasonally typical, it underscores how quickly balances can loosen in the shoulder season if demand softens. At the same time, U.S. drilling activity has increased for a third consecutive week: Baker Hughes reported the total rig count at 542, with oil rigs up two to 418—the highest since July—highlighting that U.S. supply capacity is far from static.
Structurally, the outlook remains divided. OPEC continues to emphasize strong demand into the second half of the year and beyond, even as it cautiously raises output to defend market share. Meanwhile, the IEA projects robust supply growth through 2025–26, implying that balances could loosen if demand falters. This divergence creates headline risk: any sign of weaker OPEC+ compliance or trimmed demand guidance could swing flat prices and forward curves sharply. For the coming days, inventory data (Wednesday), rig counts (Friday), and OPEC+/producer headlines are the main catalysts. In addition, global PMIs from both developed and emerging economies will help clarify activity levels and the likely trajectory for oil demand.
Fundamentals: The bull case rests on a risk-on macro backdrop: a softer U.S. PCE print and steady PMIs would lift cyclical demand expectations, especially if inventories tighten seasonally. The bear case echoes the IEA’s surplus narrative, reinforced by product builds and rising U.S. rigs—pressuring time spreads and capping rallies. Refining margins will be key for confirmation: softening cracks (diesel/gasoline) would validate a demand-led fade, while firm cracks alongside inventory draws would argue for a leaner setup heading into October. Overall, the stance remains tactically neutral with a slight downside bias unless EIA data flip decisively to sustained draws.
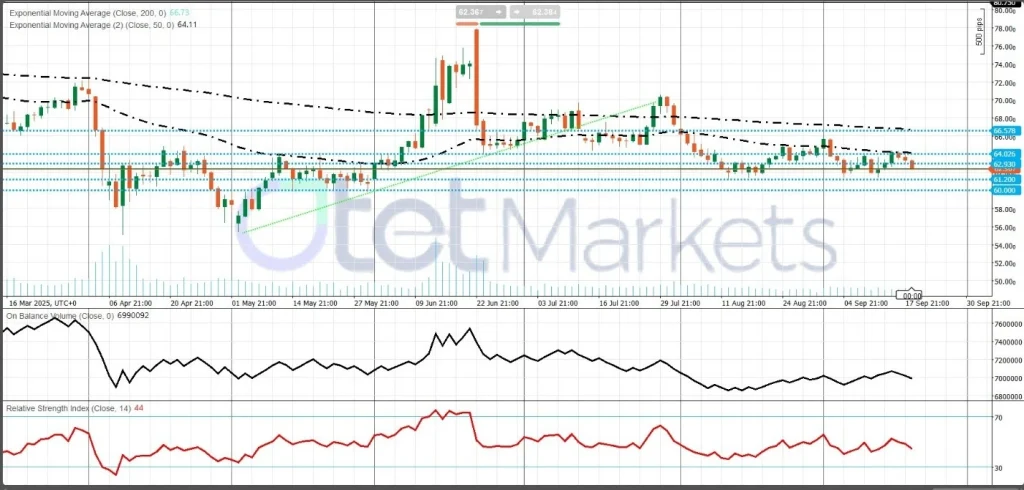
Technical: Crude continues to coil in the bigger picture, trading just under its 50-day moving average. For WTI, risk can be defined by two zones:
- Resistance: Immediate resistance sits at the 50-day moving average, while major resistance aligns with the 200-day at $66.57.
- Support: Key support lies at the multi-week band around $61.20, formed by repeated failures after headline-driven rallies.
A decisive break above resistance would likely require either a bullish EIA surprise (large draws in crude and products) or a credible supply disruption. Conversely, a clean break below $61 on rising volume would open the door to retesting prior quarterly lows.
Crypto & Bitcoin — Current Condition & Weekly Outlook
Crypto begins the week navigating a familiar macro cross-current. The Fed’s 25 bps rate cut was risk-positive, but forward guidance suggested fewer cuts ahead than markets had anticipated. That shift dented risk appetite and even flipped U.S. spot bitcoin ETF flows negative for a day. Flow sensitivity remains the clearest real-time gauge of institutional demand; after months of mainstream adoption, spot BTC and ETH ETFs now hold substantial assets, making daily creations and redemptions a key driver of intraday price action and market basis. Looking ahead to Friday’s PCE inflation data, a softer print would likely ease real yields and support crypto beta, while a hotter reading would favor consolidation or trigger a deeper pullback.
On the micro side, funding rates and perpetual swap basis have normalized from prior extremes, while on-chain activity has steadied at mid-cycle levels—neither overheated nor depressed. What has meaningfully shifted in 2025 is the participation mix: systematic allocations via model-driven mandates and retirement-linked ETF flows. These flows help dampen volatility on calm macro days but amplify swings when surprises hit. For this reason, Friday’s PCE report and PMI price components earlier in the week could matter for BTC as much as they do for tech equities, both trading like high-duration assets when real yields shift.
Technical Outlook
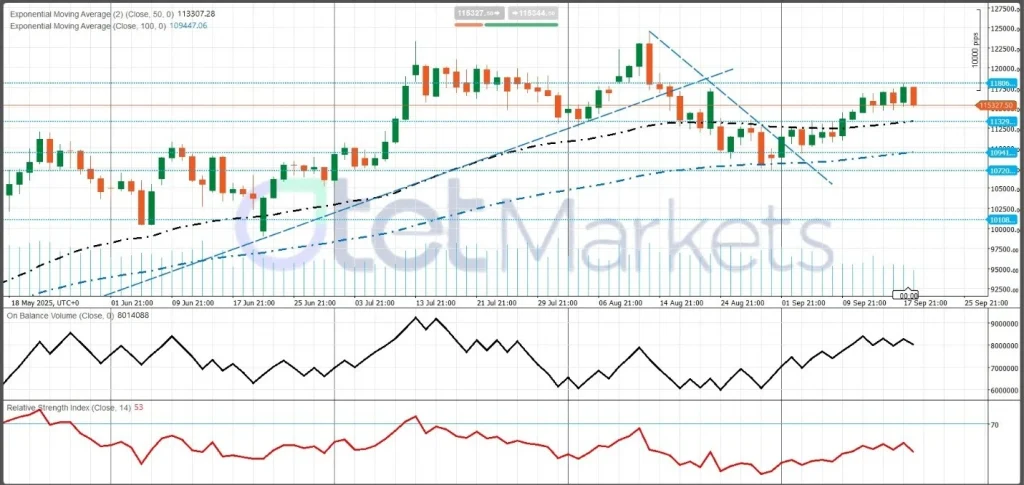
BTC remains in a broad uptrend channel extending from last year’s base, though near-term price action is choppy. The 50-day moving average at 113,300 acts as initial dynamic support, while the 100-day at 109,400 anchors primary trend support, keeping the broader bullish structure intact. However, repeated failures near the prior swing-high zone have created a supply shelf, highlighting the need for conviction to break higher.
- Bull case: A daily close above 118,000 on rising volume would clear resistance and set sights on the next psychological round number above.
- Bear case: A decisive close below the 50-day would expose the 100-day and the prior breakout shelf as downside targets.
Momentum signals should also be monitored: if prices push to new highs while RSI or MACD fail to confirm, it could warn of a short-term bull trap.
Share
Hot topics

Gold symbol in forex
Introduction If you have ever opened a trading platform and searched for gold, you probably noticed a specific code instead of the word “gold.” In the forex world, assets are...
Read more


Submit comment
Your email address will not be published. Required fields are marked *