Brace for Impact: US Inflation, Fed Speeches & Trade Tensions to Drive Markets This Week
What just happened last week?
During May 5–10, global markets edged higher as easing trade frictions and mixed earnings underpinned sentiment. In the U.S., the Dow rose 0.7% and the S&P 500 climbed 0.4% on May 7 after the Fed held its policy rate at 4.25–4.50%, while semiconductor stocks rallied on reports of looser AI chip export restrictions. Europe’s STOXX 600 added 0.4% on news of a U.S.–U.K. trade “breakthrough,” even as the U.K.’s FTSE 100 slipped 0.3% following a surprise 25-basis-point rate cut by the Bank of England.
In fixed income, the 10-year U.S. Treasury yield fell from about 4.32% to 4.27% as investors balanced solid payroll gains against tariff headwinds; German Bunds also eased after the ECB reiterated a meeting-by-meeting approach. The U.S. dollar strengthened—Dollar Index near 100.3—while EUR/USD hovered around 1.122 and GBP/USD traded near 1.324. USD/JPY remained between ¥143 and ¥146 amid Japan’s continued ultra-accommodative stance.
Economic releases were mixed: Eurozone inflation held at 2.2% year-on-year in April, with core at roughly 2.7%, and U.K. retail sales posted a surprising 0.4% monthly gain despite weakening consumer confidence. Central banks largely stayed on hold, signaling caution amid persistent inflation and growth risks. Geopolitically, President Trump’s May 8 U.S.–U.K. tariff agreement buoyed equities and pushed gold down about 1.7%, while markets now eye May 10–11 U.S.–China trade talks in Switzerland.
U.S. Review: Risks Have Risen (but Haven’t Materialized Yet)
Economic data were sparse last week and skewed by firms front-loading imports before tariffs kicked in—a pattern that should be reversed in coming months. Federal Reserve Chair Jerome Powell characterized the economy as “resilient and in good shape,” even while noting that higher unemployment and inflation risks have risen but “haven’t materialized yet.”
On trade, the U.S. and U.K. agreed to cut certain tariffs in exchange for fewer non-tariff barriers—an opening salvo ahead of broader negotiations. Treasury Secretary Bessent says deals with 17 countries (excluding China) are underway, with U.S.–China talks set for May 10–11 in Geneva. If successful, these agreements could moderate tariff headwinds and lessen the need for Fed easing later this year.
March trade data revealed record stockpiling of foreign computers, semiconductors, telecom equipment, and consumer goods, pushing the trade deficit to an all-time high. That surge weighed on first-quarter labor productivity (–0.8% annualized), though output per hour remains up 1.4% year-on-year, and unit labor costs are below 2%.
Outside these distortions, tariffs have yet to dent hard data, but input-price pressures in services are building: 17 of 18 ISM services industries paid more for inputs in April, even as overall services activity expanded. Trade-exposed sectors like agriculture and construction are already contracting, raising the risk of stagflation later in the year.
U.S. Economic Outlook: Week of May 12–18, 2025
This week brings a suite of April data. On Tuesday, May 13, the Consumer Price Index for April is due. Economists anticipate a 0.2 percent month-over-month rise in headline CPI—bringing year-over-year inflation down to roughly 2.3 percent, a four-year low. We wouldn’t be surprised by a 0.3 percent uptick if certain components rebound more than expected. Excluding food and energy, core CPI is forecast to climb 0.25 percent, leaving its annual rate steady at 2.8 percent. Markets will be looking closely for early signs of tariffs feeding into consumer prices.
On Thursday, May 15, several reports are scheduled: April Industrial Production, Advance Retail Sales, Producer Price Index, and weekly Initial Jobless Claims. Claims are expected to fall in the 230,000–250,000 range, testing the resilience of the labor market. Together, factory output and retail sales will offer insight into whether consumer demand and manufacturing are beginning to slow under tariff pressures—an early gauge for second-quarter GDP growth.
March’s strong retail figures were not driven solely by front-loading ahead of tariffs. While auto sales surged 5.3 percent, restaurant spending rose 1.8 percent, and the control group (which feeds into GDP) increased 0.4 percent. Although consumer sentiment has softened, spending remains firm. Some pull-forward in demand—and subsequent paybacks seem inevitable, particularly for autos. Nonetheless, we expect April’s overall retail sales to post a modest gain, with a solid 0.3 percent increase ex-autos, as tariff-related price hikes take time to materialize.
Other Releases
- Monday, May 12: Monthly Budget Statement
- Thursday, May 15: April Import/Export Price Index
Investors and policymakers will parse these numbers for clues on the impact of tariffs and the broader health of the U.S. economy heading into the summer.
Following last week’s FOMC meeting, Fed speeches and commentary will be under the microscope. On Wednesday, May 15th, the day after the April CPI release—Chair Jerome Powell and Vice Chair Philip Jefferson will both speak at policy conferences. Powell opens the discussion on the Fed’s monetary framework review at the Laubach Research Conference, while Jefferson delivers an “Economic Outlook” at a regional Fed event. Markets will dissect their remarks for any nuance, even though neither will announce policy changes. That same day, Governor Michael Barr offers opening remarks at a small-business symposium. Earlier in the week, Governor Adriana Kugler spoke on the economic outlook on Monday, May 12, and Governor Christopher Waller on Tuesday, May 14, in Rabat. Collectively, these officials are expected to emphasize that policy remains on hold while acknowledging balanced risks from tariffs and persistent inflation. Their outlook will test whether the Fed’s “stagflation conundrum”—rising risks of both inflation and unemployment—continues to warrant patience.
Investors enter the week cautiously. U.S. equities have recovered from mid-April lows but remain mixed: the S&P 500 is still down about 3–4% year-to-date, with defensive sectors outperforming until early May’s rebound saw leadership shift toward cyclical names in technology, industrials, and discretionary. Late-session rallies pushed the S&P up roughly 0.4% and the Nasdaq about 0.3% last week, though tariff headlines—such as a proposed 100% levy on film imports—have tempered gains.
Risk sentiment is therefore uneven. A downside surprise in inflation or other data could unsettle markets, while evidence of cooling might trigger a rally. In fixed income, the 10-year Treasury yield has firmed to the mid-4% range (around 4.30–4.35%), reflecting strong service-sector and labor data despite sluggish GDP. According to Nuveen, “U.S. Treasury yields rose last week” as upside surprises drove renewed volatility, with strategists expecting yields to trade in a wide band before modestly rallying on resilient growth and policy uncertainty.
The U.S. dollar remains resilient. The Dollar Index (DXY) sits near its recent highs, buoyed by optimism over U.S.–U.K. tariff agreements and forthcoming U.S.–China negotiations. As markets increasingly price in progress on trade, the dollar is poised for a third consecutive week of gains against major peers.
S&P 500 Technical Outlook
After a sharp pullback, the S&P 500 has begun to rebound and recently closed back above its 21-day moving average—a short-term bullish signal. Breadth indicators are mixed: the RSI fell below 30 in early April (deeply oversold) and has since recovered above 50 on the H4 chart, suggesting the worst of the selling may be over. Overall momentum is improving but remains moderate, implying any rally could be capped by key resistance levels.
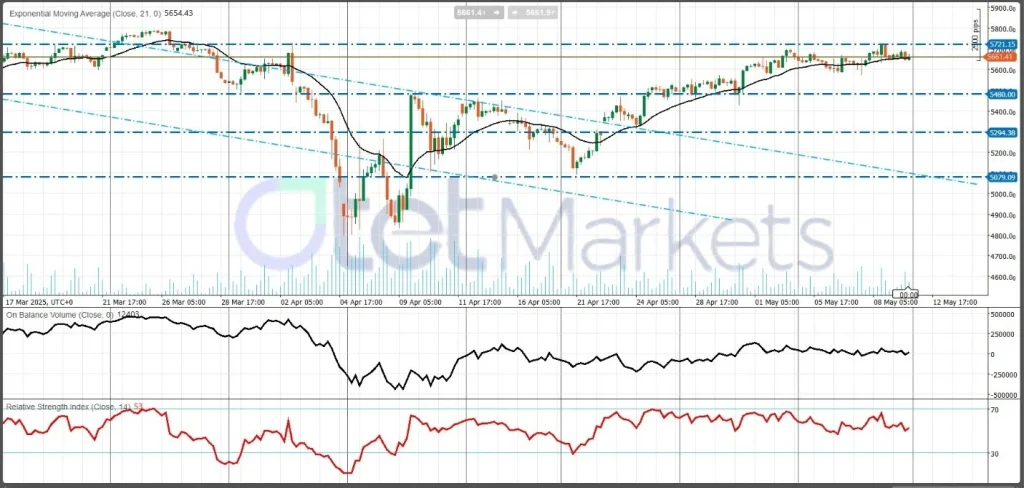
- Resistance: Immediate resistance lies around 5,700. A decisive break above 5,700 would target roughly 5,800–6,000, the range of February’s peak. In the very near term, the round numbers of 5,600 and 5,800 represent additional hurdles.
- Support: Initial support is in the 5,450–5,500 zone. More significant support resides near 4,800–5,000, the lows from mid-March/early April. A drop below 5,450 could exposure 5,300 and then 5,000 as floors. Breaching 5,000 may open the door to a deeper test of the 4,500–4,800 range if bearish momentum intensifies.
U.S. Dollar (DXY) Outlook
The U.S. Dollar Index (DXY) has firmed in recent sessions. Following the Fed’s May meeting, the index surged to local highs as investors pared risk and concluded that monetary policy will remain restrictive until disinflation is evident. Saxo Bank highlights that the dollar “strengthened on robust risk sentiment and optimism over trade agreements,” a somewhat counterintuitive response amid global equity gains.
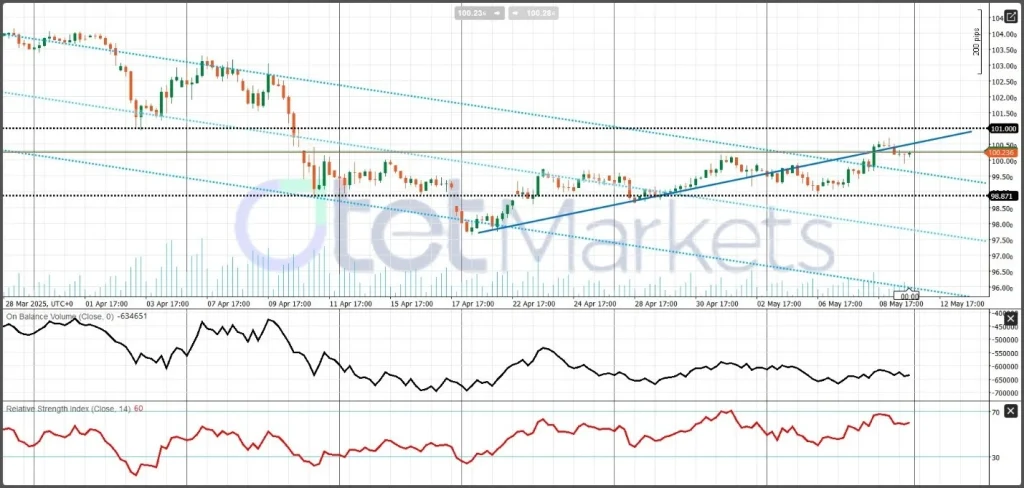
From a technical perspective, DXY has broken its downtrend but has yet to establish a clear uptrend. Immediate resistance sits at 100.50, while the more critical barrier lies near 101.00. A decisive close above that level would confirm upward momentum. In the absence of strong new catalysts, we anticipate the dollar trading sideways between 98.00 and 100.00 in the near term. Until drivers such as inflation data, Fed commentary, or trade developments deliver a pronounced directional signal, the DXY is likely to oscillate within this range.
Eurozone Outlook: May 12–18, 2025
On Tuesday, May 13, Germany publishes its May ZEW Economic Sentiment survey. A reading above April’s –12.4 would signal an improving outlook among institutional investors and economists, potentially bolstering the euro. Conversely, a deeper decline would underscore lingering pessimism about growth and could weigh on EUR/USD.
Mid-week brings critical price metrics. On Thursday, May 15, the Eurozone’s flash CPI is expected to be at +0.7% month-on-month (2.3% year-on-year), with core inflation near 2.6%. If consumer prices accelerate beyond forecasts, it would complicate the ECB’s “meeting-by-meeting” stance and lend support to the common currency. Germany’s Producer Price Index (May 14) is also eyed for signs of upstream cost pressures, with markets looking for a modest 0.1% m/m rise.
Fundamentally, the EU is preparing a retaliation package—reportedly near €100 billion of U.S. imports, including aircraft, autos, chemicals, and agricultural goods—should Washington proceed with proposed tariffs. Such a confrontation risks denting confidence in Europe’s export-reliant economy, increasing recession risks, and exerting downward pressure on the euro if enacted.
EUR/USD Weekly Technical Outlook
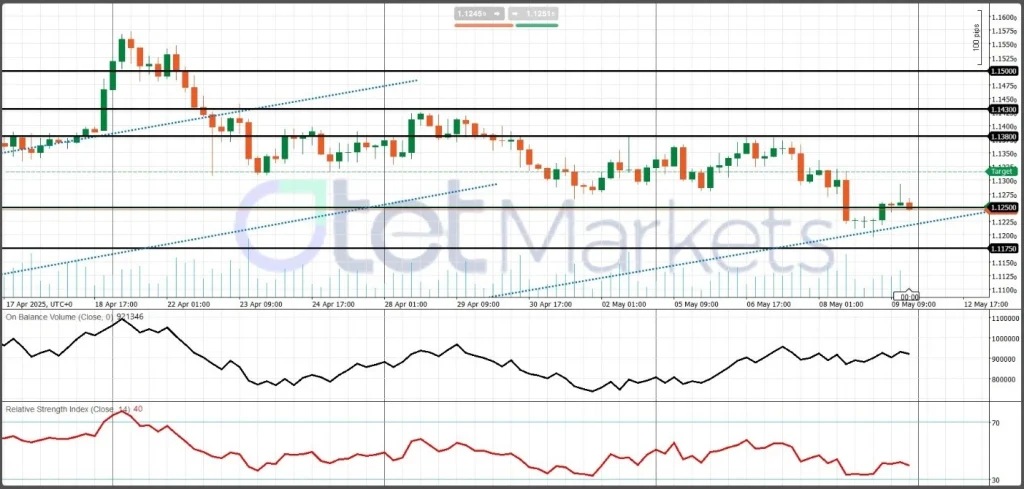
The EUR/USD remains range-bound with a slight bearish bias after stalling below 1.1400. The pair has broken its short-term uptrend, and the RSI hovers lower neutral, tilting lower. Federal Reserve commentary (Powell on May 15) and U.S.–China trade developments could trigger a decisive move.
Resistance: Key hurdles at 1.1380 (4-hour 100-SMA) and 1.1430. A daily close above 1.1380 would pave the way toward 1.1500.
Support: Initial floors at 1.1270 and 1.1175. A break below 1.1175 would target 1.1080 next.
Gold Outlook: Fundamentals and Technical
Gold continues its rally as investors flock to safe-haven assets amid heightened geopolitical tensions and tariff uncertainties. Leading asset managers—among them DoubleLine Capital and Goldman Sachs—have lifted their year-end price targets, citing robust central bank buying and elevated market volatility. Year-to-date, bullion has surged about 25%, underscoring gold’s enduring appeal as an inflation hedge and crisis hedge.
- Central Bank Demand: April saw $11 billion in inflows into physically backed gold ETFs, lifting total assets under management to $397 billion.
- Analyst Forecasts: Goldman Sachs projects gold reaching $3,700/oz by year-end, with a possible climb to $4,000/oz by mid-2026, driven by structural central bank purchases.
- Investor Sentiment: According to Bank of America, 58% of fund managers now rank gold as their top safe-haven in a trade-war scenario. JPMorgan’s metals team also expects continued momentum as shifting monetary policies and sanction risks keep gold front and center.
Weekly Market Catalysts
This week, traders should monitor several key events:
- U.S. CPI & PPI (May 13–15): A hotter-than-expected inflation print would reinforce gold’s role as an inflation hedge, potentially pushing XAU/USD above $3,500/oz.
- Fed Commentary (Powell on May 15): Dovish nuances could lift gold, while hawkish signals may trigger profit-taking.
- U.S.–China Trade Talks: Any signs of escalation could drive safe-haven demand.
Technical Outlook
Gold remains in an uptrend but is testing critical resistance. Momentum indicators suggest a cautiously bullish bias:
- Trend Structure: On the 4-hour chart, the 20-period moving average sits above the 50-period MA, confirming the overall uptrend, though price action has stalled below $3,430–$3,455.
- RSI (14): At 47, RSI is neutral—neither overbought nor oversold—indicating room for a renewed advance or a pullback if selling pressure intensifies.
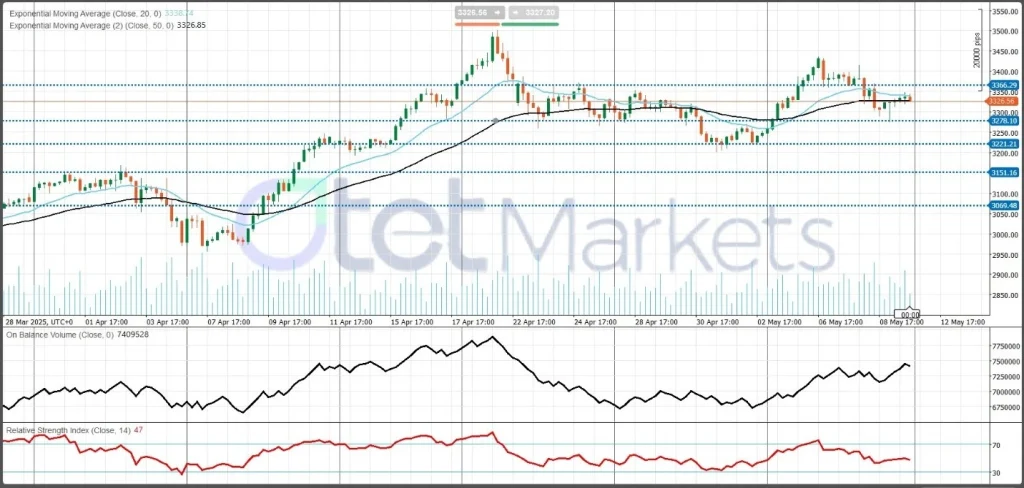
Key Levels:
Resistance:
- $3,430–$3,455: Critical zone; a daily close above here would target $3,500–$3,530.
- Psychological Cap: $3,600 in the event of sustained bullish momentum.
Support:
- $3,342–$3,318: Initial floors, aligning with pivot points.
- $3,280: Secondary support; a breach could open the door to $3,220.
Weekly WTI Outlook: May 12–18, 2025
West Texas Intermediate (WTI) is poised between rising OPEC+ output and tentative demand optimism from U.S.–China trade talks. OPEC+ plans to increase production by 411,000 barrels per day (bpd) in both May and June, raising the risk of oversupply that has already driven WTI toward four-year lows near $56 per barrel. Offsetting this, analysts expect an 800,000-barrel draw in U.S. commercial inventories, and hopes for progress in U.S.–China negotiations have helped push prices above $59.50 in early May. Recent data show U.S. crude stocks fell by 2.03 million barrels in the week ending May 2, leaving inventories roughly 7% below the five-year seasonal average. The EIA continues to forecast that global supply will outpace demand growth through 2026, keeping a lid on prices despite near-term volatility.
Between April and June, OPEC+ is unwinding 2024 production cuts—adding roughly 960,000 bpd to markets. Saudi Arabia and its allies are boosting output to regain market share, even at the expense of lower prices. Traders will closely monitor OPEC’s monthly report, due Wednesday, May 14, for clues on future cuts or extensions.
On May 7, the American Petroleum Institute reported a 4.49 million-barrel draw in crude stocks—exceeding expectations, reversing the prior week’s 3.76 million-barrel build. The EIA later confirmed a 2.03 million-barrel draw, larger than forecast but smaller than the week before. At Cushing, inventories fell by 0.74 million barrels after previously rising. Meanwhile, gasoline stocks rose by 0.19 million barrels, imports climbed by 0.67 million bpd, and production increased by 0.25 million bpd.
Trade Tensions & Market Sentiment
Market sentiment remains sensitive to trade developments. Reports of U.S.-China talks in Switzerland have supported prices, underscoring WTI’s responsiveness to geopolitical news.
Key Catalysts This Week
- May 13: U.S. CPI release
- May 14: EIA inventory report & OPEC monthly report
- Ongoing: U.S.-China trade negotiations
Technical Outlook
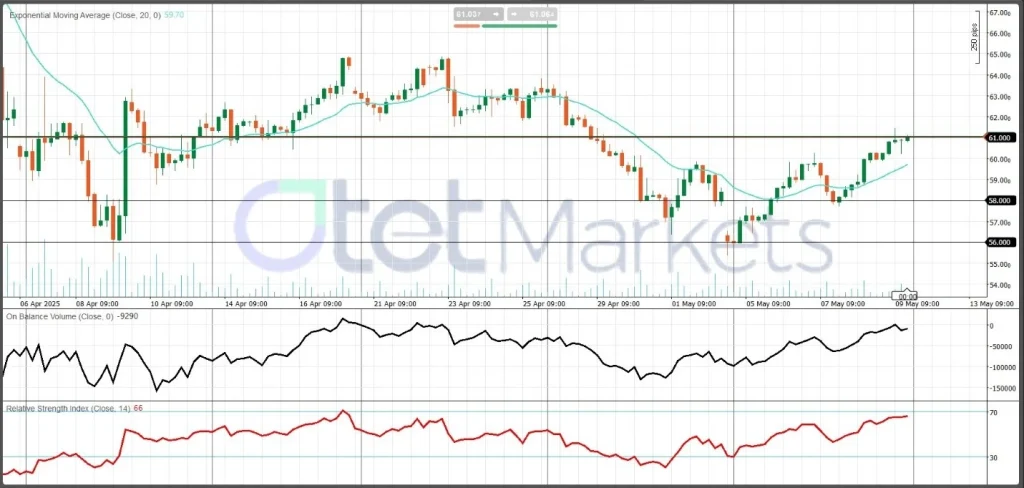
- Trend & Momentum: After briefly trading above $60, WTI has formed a base and is now testing resistance at $61.00. On the 4-hour chart, the 20-period moving average sits above the 50-period MA, and RSI is above 60, signaling modest bullish momentum.
- Resistance: $61.00 — a clean break and close above this level could open the door to $62.00–$64.00.
Support:
- $58.00: Initial floor, where buying has emerged in recent pullbacks.
- $56.00: Secondary support, aligned with April lows; a breach here could target $54.00 and lower.
Bitcoin Outlook: Week of May 12–18, 2025
Bitcoin has rebounded sharply from April’s lows, trading around $104,000 as investors hunt for alternatives amid U.S. tariff concerns and rising Treasury yields. The surge to $104,300 on May 10 triggered approximately $400 million in short-covering liquidations, underscoring renewed bullish momentum. Meanwhile, on-chain inflows have been robust, with $5.5 billion poured into crypto funds over the past three weeks—$1.8 billion of which went into Bitcoin products. Although strong, this rally has given way to a consolidation phase below all-time highs, suggesting a possible range-bound period before the next breakout.
Bitcoin’s recent advance coincided with substantial inflows into digital-asset funds, led by that same $1.8 billion into Bitcoin, and Block Scholes highlights an evolving inverse correlation between Bitcoin and Treasury yield-curve steepness as a key demand driver. Optimism over trade tensions—especially the U.S.–U.K. tariff framework—also helped push Bitcoin back above $100,000, with a midday peak of $101,330 on May 8 (+4.7%). In the week ahead, market attention will focus on U.S. CPI (May 13) and Fed Chair Powell’s remarks (May 15), both likely to influence risk sentiment and safe-haven flows into Bitcoin.
Technical Analysis
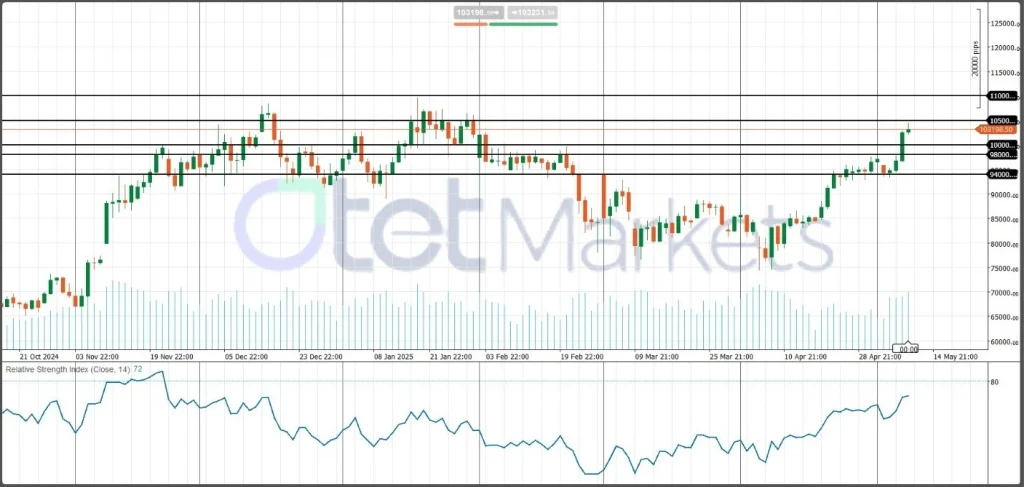
- Range: Bitcoin consolidates between $100,000 and $105,000 after reaching $104,300.
- Momentum: The daily RSI (14) sits at 72—in overbought territory—reflecting strong bullish momentum but also hinting at a potential pullback.
Key Levels
Resistance:
- $105,000 (psychological cap)
- $109,000–$110,000 (next all-time high zone)
Support:
- $100,000 (round number)
- $98,000 (April consolidation law)
- A break below $98,000 could target $94,000.
Share
Hot topics

Gold symbol in forex
Introduction If you have ever opened a trading platform and searched for gold, you probably noticed a specific code instead of the word “gold.” In the forex world, assets are...
Read more

Submit comment
Your email address will not be published. Required fields are marked *