
Global markets enter Week 52—the final trading week of 2025
cooling inflation signals alongside uneven growth, and central banks broadly cautious rather than catalytic. Market conditions are also structurally different this week because liquidity will be thinner around Christmas. U.S. equities are scheduled to close early on Dec. 24, and markets are closed on Dec. 25, which can magnify price moves on otherwise routine data and headlines. Trading is still expected to continue on Dec. 26 despite the U.S. federal office closure order, keeping risk pricing active into year-end positioning.
USA
Week 52 in the U.S. is not about a new macro story—it is about stress-testing the existing one in difficult conditions. Markets are heading into year-end with holiday-thinned liquidity and a data stream that is still normalizing after the government shutdown. That combination raises the value of “cross-confirmation”: investors will want the next batch of releases—GDP details, consumer confidence and housing demand, and durable goods—to tell a consistent story before leaning into either a “still-growing” view or a more defensive “cooling” posture.
Last week’s data dump delivered more information, but not more clarity. Headline inflation looked like it cooled sharply, the labor market appeared broadly steady but softening at the margins, and growth signals stayed mixed—services held up better than manufacturing. The problem is that some of the most market-moving figures still carry shutdown-related quality issues, limiting how aggressively policymakers or investors should revise their baseline.
Inflation was the main surprise. November CPI and core CPI printed well below expectations (2.7% and 2.6% year over year, respectively), which on its face supports the disinflation narrative. But the shutdown distorted the measurement: October prices were not collected, and November collection started halfway through the month, which likely understates the true run rate. Even so, inflation expectations moved lower in the Michigan survey, which is a constructive signal if it persists.
The labor market continues to cool mostly through weaker hiring rather than a surge in layoffs. Payrolls rose by 64K in November, while October job losses were heavily influenced by a large decline in federal employment tied to the deferred resignation program. Trend job growth is still soft, and unemployment ticked up to 4.6%, though the household survey was affected by shutdown disruptions. Weekly claims remain relatively low, supporting the view that hiring restraint—not layoffs—is the main issue.
On growth, services remain the stabilizer. Flash PMIs point to ongoing expansion led by services, but regional factory surveys weakened, highlighting uneven manufacturing momentum. Housing looks more stable than strong: home sales improved modestly, sentiment is slightly better, but mortgage applications remain soft with rates still elevated. Financial conditions eased at the very front end, while capital flow data weakened—something to monitor if rate expectations shift again.
Putting it together, the Fed’s near-term stance still reads as “hold and verify.” The direction of the data is helpful, but confidence in the signal—especially inflation—needs to improve before policy changes.
Last week of 2025 is a low-liquidity, high-signal week for U.S. markets.
Trading conditions thin materially into Christmas, yet investors still get a final cluster of important releases. The macro baseline remains “Fed on hold, hold-and-verify” because shutdown-related disruptions—especially around inflation collection—have reduced confidence in the data. Meanwhile, the labor story is best described as constrained demand for workers: hiring is weak, but layoffs are not surging. The practical question for markets is whether this week’s releases confirm a “slower-but-still-growing” economy or push the narrative toward more meaningful cooling.
The labor market is treading water. Payrolls from September to November show the economy down a net 41K, and the three-month average gain is only about 22K—far below early-year pace. October weakness was amplified by a one-off federal payroll drop tied to the deferred resignation program, but the softer tone extends beyond the public sector. Private hiring outside healthcare and social assistance has slowed noticeably. The unemployment rate at 4.6% is an attention-getter, but shutdown-era collection issues add noise. Bottom line: labor is not breaking, but it is no longer supplying a strong growth impulse.
This week’s main catalysts are tightly clustered. On Tuesday, the delayed Q3 GDP report will likely be treated as a “details matter” release. A strong headline does not automatically imply tightening risk if composition shows rate-sensitive drags persist; investors will focus on consumer strength, capex resilience, and housing/structures as a drag. Also on Tuesday, Conference Board consumer confidence and new home sales provide a read on the consumer and rate-sensitive demand. On Wednesday, durable goods is the cleanest capex temperature check and could move intermediate yields and cyclicals in a holiday-thinned session.
Policy-wise, the Fed is still biased to wait for cleaner confirmation into January. Market structure matters more than usual: thin liquidity can exaggerate moves, and Treasury auctions (2Y, 5Y, 7Y) may have outsized influence on rates and the dollar. Looking past year-end, Jan. 8 productivity and Jan. 9 employment should re-anchor the narrative as regular statistical methodology resumes.
US Dollar
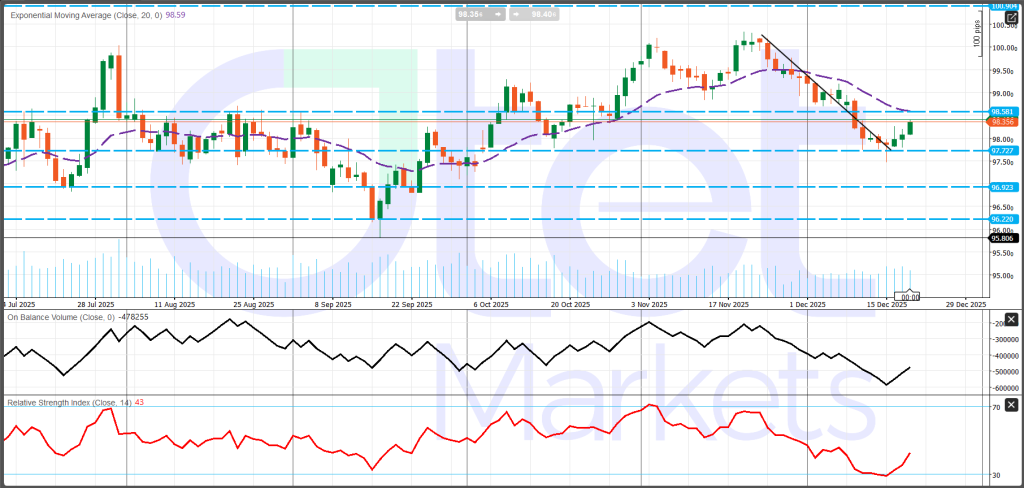
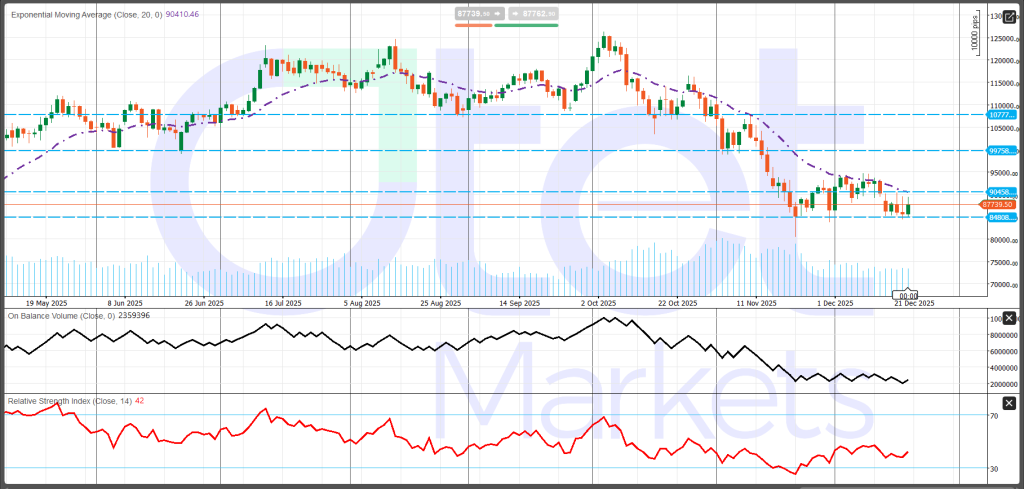
DXY is trading near 98.36, still below the 20-day EMA (~98.59) after a sharp mid-December selloff and a modest rebound. The chart shows early repair: price has broken above the short-term downtrend line and RSI is improving (around 43), but momentum remains below the 50 line and participation is only partially confirmed, with OBV still well off prior peaks. That keeps the bias neutral with a cautious bullish tilt, but only if the index can post a clean daily close above 98.6 and build follow-through toward 99.0–99.3. Until then, the move is best viewed as a corrective bounce rather than a confirmed trend reversal. On the downside, 97.73 is the key “must-hold” support; a break would shift focus to 96.92, then 96.22–95.81. Above 99.3, larger resistance sits near 100.0 and 100.9.
S&P 500
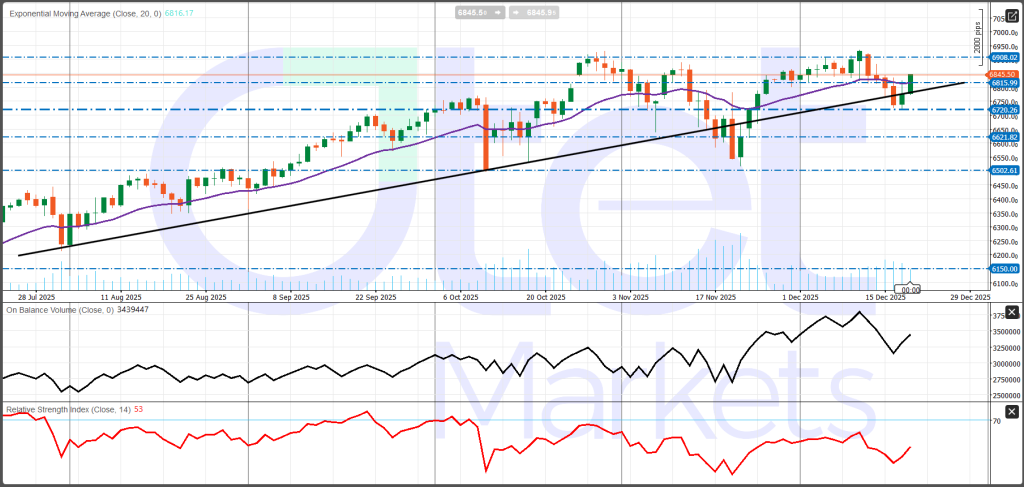
The S&P 500 is trading near 6845.5, back above the 20-day EMA (~6816.2) and holding close to a rising trendline, which keeps the broader structure constructive. After the mid-December pullback, momentum has improved: RSI is around 53, signaling a neutral-to-positive backdrop without looking overbought. Still, the index remains capped beneath a clear overhead supply zone, so the current setup is best described as a tightening consolidation—an “uptrend continuation vs. failed breakout” decision area.
The key near-term battleground is 6908. A decisive break and close above this level would favor a continuation move toward the 7000–7050 zone. Until that happens, price is effectively boxed in a range, and follow-through will likely depend on whether buyers can keep building higher lows into resistance.
On the downside, the most important line in the sand is the 6815–6820 area, where the 20-day EMA overlaps with horizontal support (6815.99). Losing that zone would weaken the setup and shift focus to 6720, then 6622, with deeper supports at 6502 and 6150 if risk-off accelerates.
China, Current Economic Condition and weekly Outlook
China closes 2025 with a familiar but increasingly binding set of constraints: domestic demand remains weak, property stress is still unresolved, and the economy is leaning on industry and external demand for support—yet even the production side is beginning to cool at the margin. Last week’s data reinforced that the recovery is not becoming self-sustaining. Instead, the economy is showing a demand-led softness that keeps growth dependent on policy support and vulnerable to negative surprises, especially if exports or the industrial cycle lose momentum.
The latest activity releases were uniformly underwhelming. Industrial production slowed to 4.8% y/y in November (below expectations), signaling softer momentum in the factory engine at a time when consumption is not providing a reliable offset. More concerning, retail sales decelerated to just 1.3% y/y, a sharp miss that highlights persistent household caution and weak confidence transmission from incremental policy support. This is consistent with continued softness in discretionary and big-ticket categories, suggesting that short-term measures have not meaningfully shifted consumer behavior.
Investment and housing remained a drag. Fixed asset investment contracted further to -2.6% y/y, and house prices stayed negative at -2.4% y/y, reinforcing the message that the property channel is still impaired and private-sector confidence remains fragile. The labor market looks stable on the surface—unemployment held at 5.1%—but the consumption slowdown implies households remain cautious and that any stabilization is not translating into stronger demand. Autos provided another weak signal: annual car sales fell 8.5%, indicating that the expected year-end demand impulse did not materialize. Even foreign confidence remains challenged: FDI was still down 7.5% y/y, despite a slower pace of contraction than previously, which matters for medium-term growth capacity and China’s industrial upgrading ambitions.
Policy is therefore the critical variable, but the policy challenge is not purely about liquidity. The data strengthen the case for a more accommodative mix, and the near-term logic supports easier monetary conditions in early 2026 to help revive domestic demand. However, the binding constraint remains confidence and balance-sheet repair, particularly through the property channel. Ongoing stress in parts of the developer complex—refinancing constraints and liquidity pressure—continues to weigh on sentiment and slows the transmission of support to household spending and private investment.
This leads directly into the market framing for the final trading days of 2025 (Week 52): it is set up as a policy-first, liquidity-sensitive period. The main scheduled policy event is Monday’s Loan Prime Rate (LPR) setting, where the base case is no change—1Y LPR at 3.0% and 5Y LPR at 3.5%—with banking profitability and already-compressed margins cited as key constraints on immediate benchmark cuts. For markets, the more important question is not simply whether the PBoC holds rates, but whether it can keep conditions supportive through liquidity operations, fixing behavior, and overall transmission tone. Holding the 5Y LPR also keeps the property stabilization narrative dependent on targeted measures and confidence repair rather than a rate-led impulse.
The decisive end-of-year macro checkpoint will be the December PMIs, which will be treated as the clearest pulse check on whether Q4 is stabilizing or slipping further. November PMI readings were already weak—manufacturing improved to 49.2 but remained below 50, while non-manufacturing fell to 49.5, the first sub-50 print of the year. Consensus expects December PMIs to remain below 50 (manufacturing 49.2, non-manufacturing 49.6). If that holds, it would reinforce the view that China is ending 2025 with subdued momentum, increasing the likelihood of more accommodative conditions in early 2026, especially if property stress and household confidence remain unresolved.
The key watchpoints are therefore clear: policy transmission, property headlines, and external demand/trade-policy risk. With domestic demand weak, markets remain highly sensitive to incremental China surprises, and the core risk is that the “industry/exports offset” may not be enough if consumption stays soft and industrial momentum cools further.
Gold, Market condition and Weekly Outlook
Precious metals ended the week with broad-based strength, supported by a macro backdrop that continues to favor defensive allocations. Gold held firm, while silver and platinum led the complex higher. Gold was last around $4,326.89/oz (slightly lower on the session but up about 0.4% on the week), with February futures near $4,354.70/oz. Silver rose to roughly $65.84/oz, gaining around 6% on the week and extending a multi-week advance. Platinum rallied to about $1,937.50/oz (+10.5% on the week), while palladium climbed to roughly $1,709.20/oz, tracking an approximate 14% weekly surge. The strong momentum is constructive, but the magnitude of the weekly move also increases near-term vulnerability to profit-taking—especially if real yields stabilize or the dollar firms.
In contrast, industrial metals were softer as growth sensitivity reasserted itself. LME copper traded near $11,581/ton, down in the cited session, highlighting how base metals remain high beta to China demand signals and global risk appetite.
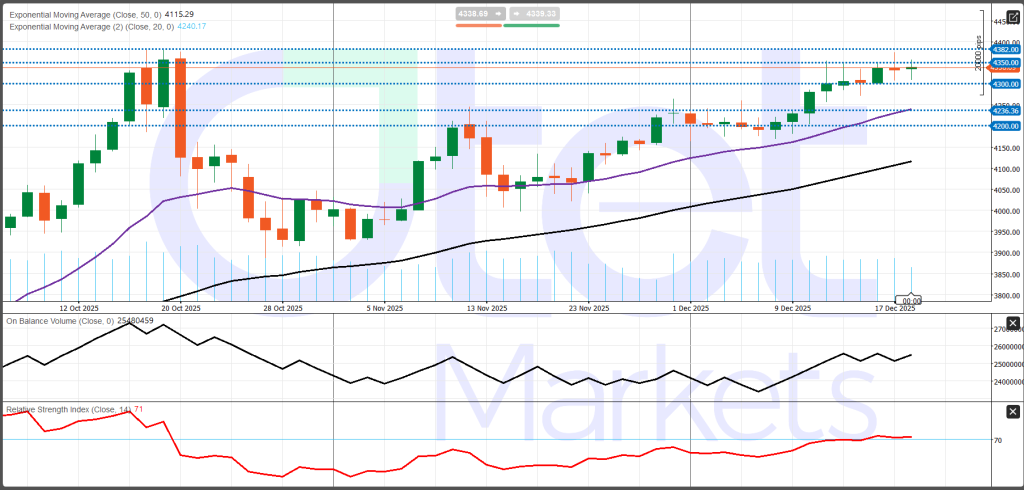
For gold specifically, the market tone remains consistent with bull-trend consolidation rather than reversal. Spot is holding near $4,339/oz into the week, clustered around the $4,300 handle after an exceptionally strong year (roughly +65% y/y on major price feeds). However, price has repeatedly struggled to extend cleanly through the $4,350–$4,380 zone, leaving gold in a well-defined consolidation band. Macro support continues to come from expectations that U.S. policy remains data-dependent and cautious, but shutdown-related distortions have lowered confidence in key inflation and labor signals, making rates and the USD more prone to sharp repricing. Positioning also matters into year-end, with COMEX open interest rising into week-end, consistent with fresh positioning.
Week 52 is structurally different due to holiday-thinned liquidity. That typically means choppier action, faster mean reversion, and bigger moves on smaller surprises. Bond markets also close early on Dec. 24 and are shut on Christmas Day, which can amplify rate-driven swings. The main catalysts are Tuesday’s U.S. releases—GDP, durable goods, and Conference Board consumer confidence—because they can shift yields and the dollar, which remain the primary transmission mechanism for gold.
Technically, $4,300 is the key support, while $4,350–$4,356 and $4,376–$4,382 define the main resistance band. A break below $4,300 risks a move toward $4,270 and potentially the mid-$4,200s; a sustained break above $4,380 would reopen the path to fresh highs.
Energy Market and WTI weekly Outlook
WTI enters the last trading week of 2025 in a headline-driven consolidation near $56–$57/bbl. The macro anchor remains a structural 2026 surplus narrative that keeps rallies contained, but near-term pricing is still vulnerable to sharp, short-lived risk premia from geopolitics—especially developments tied to Russia/Ukraine and Venezuela. This is also a structurally “different” week: with holiday-thinned liquidity and key reporting shifts, markets should expect less data clarity and greater sensitivity to headlines and positioning than normal.
The broader commodities backdrop remains split. Energy stayed volatile and rangebound, while precious metals remained bid as macro uncertainty and defensive positioning supported the complex. In crude, price action reflected this tug-of-war: Brent traded around $59–$60/bbl, and WTI held in the mid-$56s. Early in the week, prices softened on improved optimism around Russia–Ukraine talks, which raised expectations of potential sanctions relief and higher supply availability. That pressure was partly offset mid-week when geopolitical risk returned after the U.S. ordered interdiction actions involving sanctioned Venezuelan tankers, with market chatter flagging potential disruptions in the ~0.4–0.5 mb/d range. Meanwhile, weaker China activity readings continued to cap upside by reinforcing demand concerns.
U.S. supply signals were mildly constructive. The Baker Hughes oil rig count fell to 406 from 414, and total rigs dropped to 542 from 548, hinting at a slower supply response over time. In near-term balances, the API reported a -9.3M draw (week ended Dec. 13), providing some support. Natural gas was less constructive: storage declined -167 Bcf, smaller than expected (-176 Bcf), implying supply/demand is not tightening as quickly as priced and leaving the near-term tone mildly bearish for gas.
From a market-structure standpoint, WTI is being pulled between oversupply expectations for 2026 and headline-driven supply risks, which is keeping the contract rangebound and highly reactive. Positioning also reflects year-end caution: crude futures open interest fell on Dec. 19, consistent with risk trimming rather than aggressive new buying.
Week-ahead mechanics matter. The EIA’s weekly petroleum report is delayed, with the next release scheduled for Dec. 29, reducing official inventory visibility during the holiday week. In addition, the Baker Hughes rig count release shifts to Tuesday, Dec. 23, increasing the chance that a single supply datapoint carries disproportionate weight.
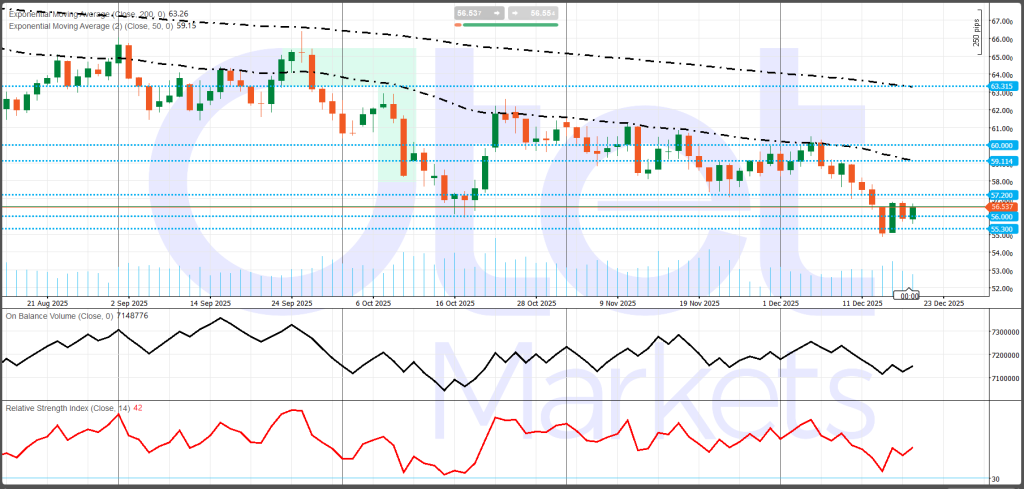
Technically, the past two weeks define a working band of roughly $54.9–$58.0. Resistance begins at $57.20–$57.75, with a larger ceiling at $58.80–$60.00. Support sits at $55.00–$55.30 as the key line in the sand, with $54.80–$55.00 as the downside trigger zone.
The base case is a choppy $55–$58 range amplified by thin liquidity. A bullish break would require a meaningful supply-risk repricing, while a bearish extension would likely come from renewed peace optimism and a reassertion of the surplus narrative into 2026.
Crypto Market and BTC weekly Outlook
BTC enters the final trading week of 2025 trading near $88k, after an intraday range of roughly $86.9k–$89.2k. The broader market still looks like post-peak digestion rather than a fresh trend: BTC remains well below its late-October high above ~$126k, which leaves meaningful overhead supply in place and keeps rallies vulnerable while the market tries to build a more durable base.
Week 52 is likely to be driven less by crypto-native narratives and more by macro and market structure. BTC is consolidating near $88k at a time when rates and the U.S. dollar can move sharply on incremental data surprises, and derivatives positioning is unusually important. Because traditional markets are operating with holiday-thinned liquidity (U.S. equities close early on Dec. 24; stock and bond markets are closed on Dec. 25; bonds are also recommended to close early on Dec. 24), the rates/USD channel can transmit volatility into BTC more easily even though crypto trades 24/7.
Derivatives add another layer of gravity. Bloomberg highlighted about $23B in BTC options expiring on Friday, Dec. 26 on Deribit. Large expiries like this can amplify price swings through hedging and gamma effects, particularly later in the week and during less liquid trading hours. CME’s growing crypto footprint also adds settlement-related event risk around Friday expiries, even if the main focus remains Deribit.
Spot ETF flows remain the cleanest “truth serum” for day-to-day direction. Flows have been two-way, consistent with year-end de-risking alongside opportunistic dip-buying. Farside data, for example, showed a strong +$457.3m net inflow day on Dec. 17, followed by net outflows later in the week (such as -$158.3m on Dec. 19). Persistent inflows tend to stabilize pullbacks; renewed outflows can accelerate downside, especially in thin liquidity.
The key macro catalyst window is Tuesday, Dec. 23, with delayed U.S. releases including Q3 GDP, durable goods, and Conference Board consumer confidence. With shutdown-related distortions still clouding data interpretation, markets may reprice quickly on any print that feels “cleaner” or more confirmatory.
Technically, BTC is trading a round-number range: $90k is the first major resistance, while the mid-to-high $80k zone remains the primary support. Base case is choppy consolidation with volatility spikes; bullish requires softer yields and improving ETF flows, while bearish risk rises if yields/USD firm and flows deteriorate into year-end.
Share
Hot topics

What is News Trading in Forex? A Complete Guide to Event-Driven Strategy
Introduction If you have ever watched the forex market during a major economic announcement, you know how dramatic it can be. Prices jump within seconds. Spreads widen. Volatility explodes. For...
Read more


Submit comment
Your email address will not be published. Required fields are marked *