
Inflation is the next Ket market Driver!
- Global Economic Review – Week Ending June 7, 2025
- U.S. Economic Review: Gradual Cooling Amid Trade Pressures
- U.S. Economic Outlook: Week of June 9–15, 2025
- Inflation Watch: CPI and PPI in Spotlight
- Labor Market: Caution Signals from Jobless Claims
- Policy Outlook: Fiscal Expansion, Fed Patience
- Wall Street Outlook for the Week Ahead
- Technical Perspective
- U.S. Dollar Outlook and Key Levels
- Technical View
- Eurozone Economic Outlook (Week of June 9–15, 2025)
- Trade and Industry Under Pressure
- Euro Currency and Financial Markets
- Gold Market Outlook (June 9–15, 2025)
- Outlook
- Technical Analysis
- Crude Oil Market Outlook: June 9–15, 2025
- Supply and Demand: Oversupply Looms
- Geopolitical and Macro Influences
- Technical View and Outlook
- Bitcoin Market Outlook: June 9–15, 2025
- On-Chain Metrics: Whales Accumulate, Supply Tightens
- Miners and Supply Dynamics
- Sentiment & Media Impact
- Outlook
- Technical Picture: Key Levels in Focus
Global Economic Review – Week Ending June 7, 2025
Global financial markets advanced over the past week as investor sentiment improved amid solid U.S. jobs data and signs of progress in trade diplomacy. The S&P 500 closed in on record highs, while European equities recorded a second straight week of gains. U.S. Treasury yields rose sharply, with the 10-year yield reaching 4.51%, as fears of recession eased. The U.S. dollar strengthened on robust economic data, pushing the euro to $1.14 and the yen to a six-month low. Commodities reflected renewed optimism, with Brent crude climbing nearly 3% on the week, while gold prices dipped over 1% as strong U.S. employment figures reduced expectations for near-term Federal Reserve rate cuts.
Central banks remained in focus. The Federal Reserve is expected to hold rates steady at its upcoming June meeting, despite political pressure for easing. Markets now anticipate no rate cuts before September and, at most, one cut this year. The European Central Bank delivered its eighth consecutive rate cut, lowering the deposit rate to 2.0%, but signaled a potential pause going forward as eurozone inflation stabilizes near target. In Japan, the Bank of Japan maintained its tightening stance and indicated further rate hikes remain possible, though growth forecasts have been revised lower due to trade concerns. Meanwhile, India’s central bank surprised markets with a larger-than-expected 50 basis point rate cut to support growth.
On the data front, U.S. nonfarm payrolls rose by 139,000 in May—below trend—while unemployment held at 4.2%. Wage growth stayed solid, indicating ongoing labor market resilience. Global inflation trends diverged, with the eurozone easing and U.S. pressures persisting. Trade developments were also significant as the U.S. and China agreed to resume high-level negotiations, while new tariffs strained economies like Germany and Canada. The OECD revised global GDP growth down to 2.9% for 2025–2026, citing trade tensions and rising protectionism as key risks to the outlook.
U.S. Economic Review: Gradual Cooling Amid Trade Pressures
The U.S. economy showed further signs of moderation this week. May’s nonfarm payrolls rose by 139,000—slightly above forecasts—but downward revisions to prior months and a narrow distribution of job growth (mostly in healthcare and hospitality) tempered optimism. The unemployment rate held at 4.2%, while labor market data from the JOLTS survey revealed a drop in quits and a rise in layoffs, indicating softening demand. Both ISM manufacturing and services surveys pointed to contraction, driven by weakening orders, rising costs, and ongoing trade-related disruptions. Construction spending fell for a third consecutive month, reflecting the drag from high interest rates and tariff-related cost pressures. Although April trade data showed a narrower deficit—supportive of Q2 GDP—the broader trend suggests the economy is slowing in a gradual, but potentially fragile, manner.
Financial markets responded with cautious optimism. The S&P 500 broke above the 6,000 level, aided by hopes of a soft landing. Major indexes closed higher, while midweek volatility saw Tesla’s stock tumble 14% following a public spat between Elon Musk and President Trump. Treasury yields climbed, with the 10-year period nearing 4.5%, as markets scaled back expectations for imminent Fed rate cuts. Oil prices edged higher (Brent ~$66), gold held near record highs ($3,400/oz), and the dollar remained soft.
The Federal Reserve is expected to hold rates steady at its June 17–18 meeting. Policymakers remain cautious amid mixed signal-resilient wage growth and elevated inflation pressures alongside slowing activity. Despite Trump’s call for a full percentage point cut, Chair Jerome Powell has emphasized data-dependence. Markets now expect two modest cuts later this year.
On the political front, a controversial tax-and-spending bill passed the House by one vote, extending Trump-era tax cuts while raising defense and border funding. The bill is estimated to add $3.8 trillion to the debt, drawing criticism from fiscal conservatives and Elon Musk, who labeled it a “disgusting abomination.” Senate revisions are expected.
Geopolitically, U.S.–China tensions resurfaced as both sides accused each other of violating a recent trade truce. The U.S. doubled tariffs on key metals, while China restricted rare earth exports. However, signs of diplomacy emerged with a Trump–Xi phone call and upcoming trade talks in London. Broader uncertainty continues to weigh on sentiment and global supply chains.
U.S. Economic Outlook: Week of June 9–15, 2025
Key Inflation Data, Jobless Claims, and Fiscal Debate in Focus
As the second week of June begins, market attention turns to several high-stakes U.S. economic indicators, including May’s inflation reports, labor market trends, and an evolving fiscal policy debate in Washington. These developments will offer critical insights into the strength of the U.S. economy, the impact of recent tariffs, and the Federal Reserve’s upcoming policy stance.
Inflation Watch: CPI and PPI in Spotlight
On Wednesday, the Consumer Price Index (CPI) for May will provide the clearest signal yet of whether tariff-induced cost pressures are beginning to filter through to consumers. Through April, inflation remained moderate, with headline CPI up just 0.2% month-over-month and annual inflation falling to 2.3%—its lowest level since early 2021. Core CPI, which excludes food and energy, also rose a modest 0.2%, held down by disinflation in services and declining vehicle prices.
May’s CPI will be closely watched for signs that price pressures are broadening. Categories like household goods, electronics, and recreational items could show the first wave of price pass-through from import duties. However, many businesses have so far chosen to hold prices steady while building inventories, cautious about weakening consumer demand.
Wells Fargo expects a 0.3% rise in core CPI and just a 0.15% gain in headline inflation, helped by stable food costs and lower gas prices. That would suggest inflation remains contained for now but may pick up pace in the second half of the year.
On Thursday, the Producer Price Index (PPI) will add another layer of insight. Headline PPI declined 0.5% in April, but core goods prices rose 0.4%, indicating cost pressures building beneath the surface. Trade services margins—wholesalers and retailers—fell sharply, hinting that firms are either absorbing input costs or facing weak pricing power. May PPI is expected to rebound modestly, with a 0.2% monthly increase and annual inflation ticking up to 2.6%.
Labor Market: Caution Signals from Jobless Claims
The labor market is beginning to show signs of strain. Initial jobless claims rose to 247,000 at the end of May, the highest in seven months. Notably, manufacturing-heavy states like Michigan and Tennessee saw sharper increases, likely reflecting layoffs tied to tariffs on imported components.
While some of the rises could be seasonal, Thursday’s claims report for the week ending June 7 will be closely watched. A reading above 240,000 would signal further labor market cooling. A drop closer to 230,000, on the other hand, would suggest ongoing resilience.
Policy Outlook: Fiscal Expansion, Fed Patience
On the policy front, the Senate will begin debate on a sweeping tax-and-spending bill estimated to add $3.8 trillion to the national debt. The bill has raised concerns in financial markets, where rising Treasury yields reflect fears of expanded government borrowing and its potential to push up interest rates.
Meanwhile, the Fed remains in a pre-meeting blackout period ahead of its June 18 FOMC decision. With inflation ticking higher and the labor market softening, policymakers face a complex mix of signals. Markets currently expect the Fed to keep rates unchanged at 4.375% but have priced in two cuts by year-end. This week’s data could shift that calculus—either reinforcing the case for rate cuts or delaying them if inflation surprises to the upside.
In short, the economic path remains uncertain, shaped by competing forces: tariff-related price pressures, fiscal stimulus, and softening job market dynamics. The coming week may offer pivotal clues on how the Fed and financial markets navigate this evolving landscape.
Wall Street Outlook for the Week Ahead
The S&P 500 has rebounded strongly from its sharp spring sell-off and is now back in positive territory for the year as of early June. U.S. equities enter the week trading near record highs, though with a cautious tone as investors await key economic data and further developments on trade. Stocks have rallied from their April lows amid easing tariff concerns and better-than-expected corporate earnings, pushing the S&P 500 back to the 6,000 level for the first time since February.
Major indexes have posted two consecutive weeks of gains—last week, the S&P 500 and Nasdaq rose approximately 1.5% and 2.2%, respectively—reflecting improved market sentiment and confidence that the economy remains on relatively solid ground. However, that optimism is being tested. Ongoing trade tensions, driven by President Trump’s tariff actions, have added volatility to markets throughout the spring. Investors increasingly recognize that for stocks to break decisively higher, the “hard data needs to beat expectations”—particularly on inflation and consumer spending.
At the same time, rising interest rates are beginning to act as a headwind for equities. Treasury yields have climbed amid concerns over inflation and ballooning federal deficits, with the 10-year yield hovering around 4.5%, a recent two-week high. These elevated yields have pressured stock valuations, especially in rate-sensitive sectors like real estate and utilities.
Overall, the near-term equity outlook is one of cautious optimism. Momentum may persist if this week’s CPI and retail sales data confirm moderate inflation and steady consumption. However, any downside surprises—such as a hotter-than-expected CPI, weak retail numbers, or deteriorating trade talks—could trigger renewed volatility and profit-taking.
Technical Perspective
From a technical standpoint, the 6,000 level on the S&P 500 is significant, it aligns with the 88.6% Fibonacci retracement from the previous correction and recovery, serving as a key resistance. If the index can decisively hold above 6,000, the next upside target is around 6,140. A sustained breakout could open the door to even higher levels, though that scenario currently appears less likely.
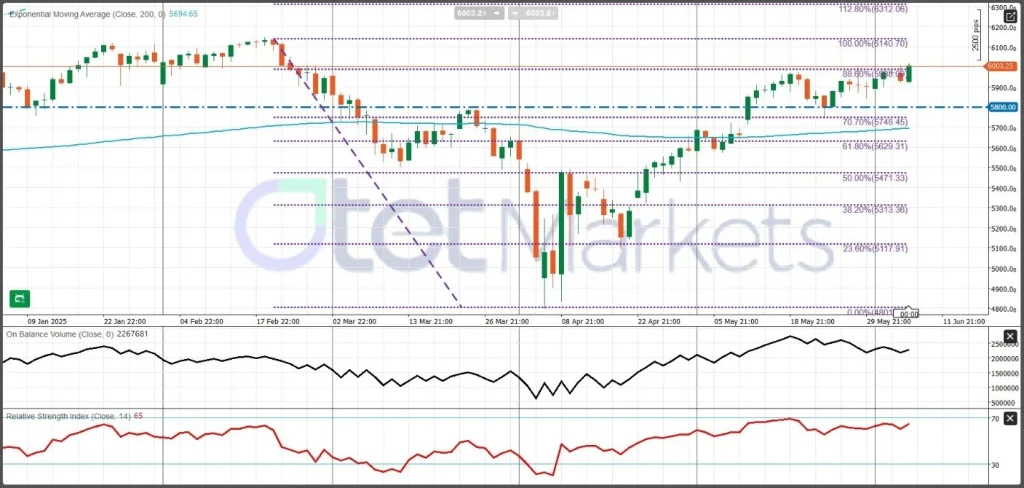
Conversely, a drop below 5,750 would be a bearish signal, potentially exposing the index to deeper declines toward the 5,500 zone or lower.
U.S. Dollar Outlook and Key Levels
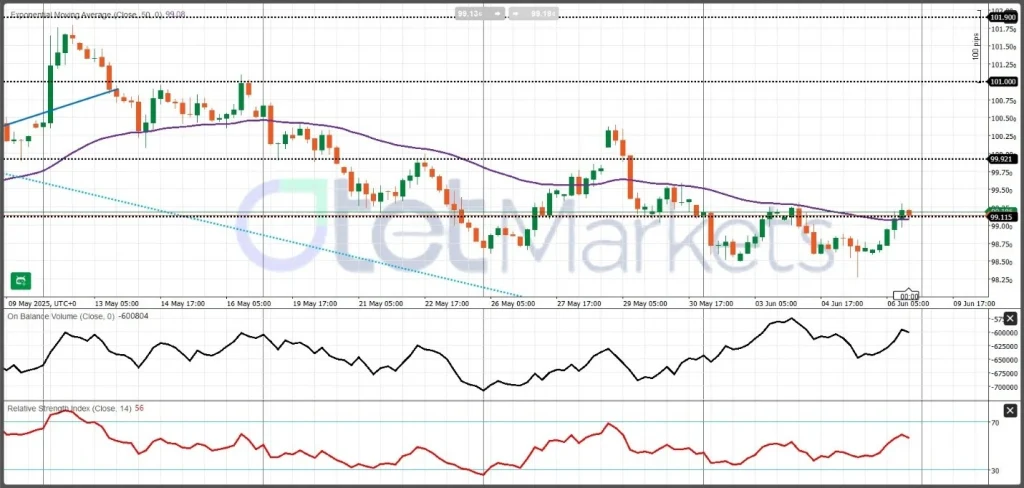
The U.S. dollar has been volatile, caught between shifting economic data and trade-related risk sentiment. Last week, a stronger-than-expected jobs report boosted the dollar, with the U.S. Dollar Index (DXY) climbing over 0.5% toward the 99.3 level. Supportive factors included higher U.S. Treasury yields and optimism about continued economic resilience. However, the Greenback’s strength remains fragile, particularly in response to tariff-related headlines.
Earlier this month, the dollar weakened broadly after President Trump threatened new import tariffs, sparking fears of slowed economic growth and rising costs. Escalating trade tensions tend to drive investors toward a “sell America” reaction—reducing exposure to both the dollar and U.S. equities. This pattern could reemerge if upcoming inflation data surprises to the upside (which may boost Fed tightening bets) or if risk-off flows favor the dollar as a safe haven. Conversely, if trade disputes intensify or domestic data disappoints—strengthening expectations for Fed rate cuts—the dollar could decline further against major currencies.
This week, the dollar’s direction will likely hinge on whether investors prioritize interest rate differentials (currently favoring the dollar) or growing trade-related growth risks, which are beginning to undermine the currency’s broader appeal. Global developments, such as economic surprises from the Eurozone or China, may also influence price action, but U.S. inflation and trade policy headlines are expected to be the primary drivers.
Technical View
From a technical standpoint, downward pressure appears to be easing, with price action moving above the 50-period Moving Average on the 4-hour chart. The Relative Strength Index (RSI) is trending upward toward 60, suggesting improving bullish momentum. Immediate resistance is seen at 99.90, with a broader expected trading range between 99.00 and 101.00. A confirmed breakout above 99.90 could set the stage for a retest of the psychological 101 level, while failure to hold above 99.00 may renew bearish pressure.
Eurozone Economic Outlook (Week of June 9–15, 2025)
Eurozone inflation has finally dipped below the European Central Bank’s (ECB) 2% target, paving the way for policy easing. Annual inflation fell to 1.9% in May, down from 2.2% in April, undershooting market expectations and signaling a sustained disinflationary trend. Core inflation also softened to 2.3%, led by a notable decline in services prices. In Germany, inflation held steady at 2.1%, the lowest since late 2024.
This benign inflation backdrop reflects a combination of muted wage growth, cheaper energy, and a strong euro, all of which are helping to cool price pressures. In response, the ECB cut its deposit rate by 25 basis points to 2.0% last week, the latest step in a gradual easing cycle that began in late 2024. However, ECB President Christine Lagarde adopted a cautious tone, providing no clear guidance on future cuts and emphasizing a “meeting-by-meeting” approach amid global trade and growth uncertainty.
Markets now expect the ECB to pause in July, unless economic conditions deteriorate further. With inflation at target and underlying disinflationary trends in place, analysts expect limited easing going forward. Some even warn inflation could stay below 2% well into 2026, echoing pre-pandemic concerns over persistent undershooting of inflation targets.
Trade and Industry Under Pressure
This week’s key data focus includes April’s Eurozone trade balance and industrial production. Early indicators from Germany, the region’s largest economy, suggest weakness. German exports dropped 1.7% month-over-month, while industrial output fell 1.4%. Germany’s trade surplus shrank to €14.6 billion, its lowest since October 2024, driven by collapsing exports to the U.S. (–10.5%), China, and the UK.
These trends imply the Eurozone trade surplus will narrow, as external demand softens and new tariffs weigh on exports. Meanwhile, imports remain relatively strong—Germany’s imports rose in April—suggesting resilient domestic demand and potential stockpiling ahead of trade shifts.
Eurozone industrial production likely declined modestly in April, reversing March’s surge (+2.6% m/m). With both Germany and France posting weak factory output and May PMIs pointing to falling export orders, the outlook for Q2 growth has dimmed. Together, these figures support the ECB’s cautious tone and signal the need for ongoing—but measured—policy support.
Euro Currency and Financial Markets
The euro faces a mixed near-term outlook amid softening inflation and cautious central bank signals. The currency weakened in early June after eurozone inflation dropped below expectations, prompting markets to price in further European Central Bank (ECB) rate cuts. Weak German data and ECB President Christine Lagarde’s cautious remarks added pressure, reflecting investor sensitivity to growth risks and interest rate differentials.
While easing inflation and a dovish ECB typically weigh on the euro, some offsetting support may emerge from signs of economic resilience or a potential shift in U.S. Federal Reserve policy. For now, EUR/USD is expected to stay range-bound with a slight downward bias.
In bond markets, German Bund yields have fallen amid disinflation, boosting interest-sensitive sectors. Equity markets have responded with cautious optimism—major indexes like the STOXX 600 rose modestly last week, supported by upward GDP revisions and strong U.S. labor data.
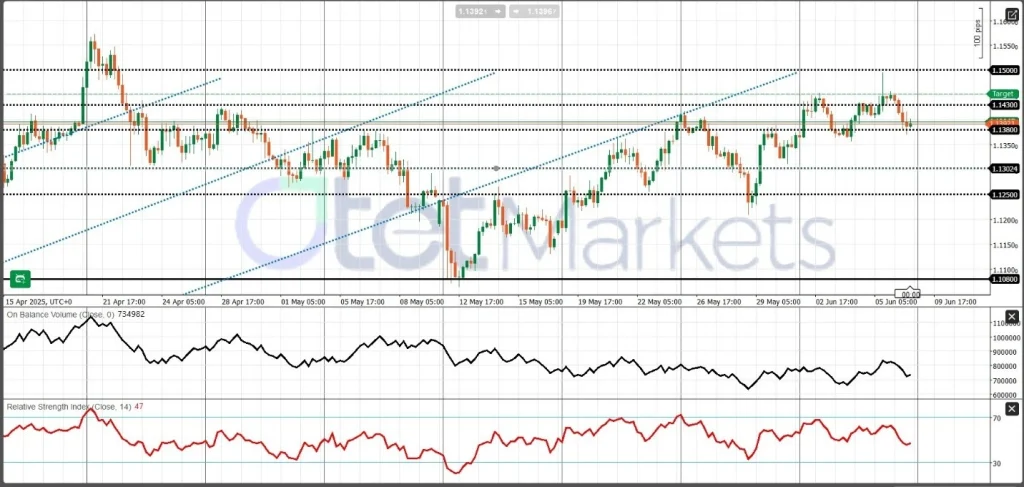
Technically, EUR/USD faces resistance near 1.1500, with support at 1.1350 and 1.1300. A drop below 1.1300 could trigger a move toward 1.1200, increasing bearish momentum if macro sentiment worsens.
Overall, European markets will likely continue to balance easing policy benefits with ongoing trade and growth uncertainties. Volatility may rise with incoming data or geopolitical shifts.
Gold Market Outlook (June 9–15, 2025)
Consolidation Continues Amid Mixed Sentiment
Gold prices have retreated from their record highs near $3,500, entering a consolidation phase as risk sentiment shifts. After a sharp run-up in April driven by geopolitical and trade tensions, recent market developments—including a temporary easing in U.S.–China trade frictions—have led to reduced haven demand. This was reflected in the latest ETF data, which showed a weekly outflow of over $1.8 billion, primarily from North American funds. Despite this pullback, year-to-date inflows remain net positive at approximately +322 tonnes, highlighting sustained longer-term interest.
Speculative positioning remains moderately bullish. According to CFTC data as of June 6, managed money held a net-long COMEX gold position of 187.9K contracts, up from 174.2K the previous week. Though well below peak levels seen in late 2024, the rise indicates that traders are gradually rebuilding positions as gold stabilizes above key technical support zones.
Geopolitical uncertainty and economic concerns continue to underpin safe-haven interest. Ongoing instability in Eastern Europe and the Middle East, lingering trade risks, and growing stagflation concerns have all contributed to a cautious but constructive longer-term view on gold. In early May, fears over tariff escalation and global growth triggered strong inflows, but optimism around ceasefire talks and trade negotiations in mid-May prompted a partial rotation out of gold and into equities.
Outlook
Heading into the week of June 9–15, gold’s outlook remains cautiously constructive. While near-term movement may be influenced by inflation data, central bank rhetoric, and geopolitical headlines, the broader macro environment supports gold as a hedge against uncertainty and inflation. Key levels to watch lie between $3,270 and $3,380, with a breakout likely determining gold’s next trend direction.
Technical Analysis
Gold is currently consolidating within a symmetrical triangle pattern, with price action showing lower highs and higher lows. The market is trading in the mid-$3,300s, finding key support at $3,290–$3,300, near the 20-day moving average and 23.6% Fibonacci retracement. Deeper support lies at $3,270 and $3,200, both of which held firm during May’s correction.
Resistance begins at $3,350, with further upside barriers at $3,370–$3,380. A breakout above $3,380 could reignite bullish momentum, targeting a retest of April’s highs near $3,500.
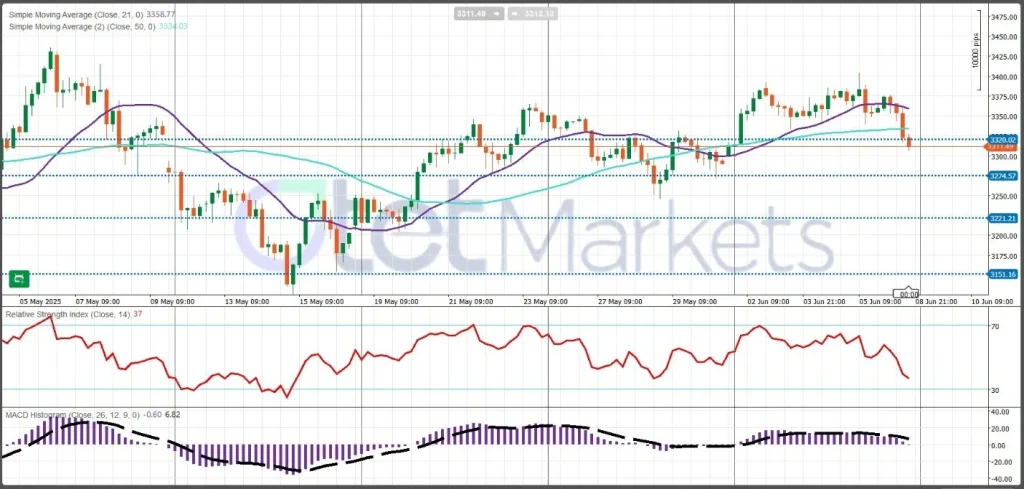
Technically, momentum has softened. The RSI has slipped to around 37, and the MACD histogram is narrowing, suggesting reduced buying pressure. Still, gold remains above its 100- and 200-day moving averages, keeping the broader uptrend intact.
Crude Oil Market Outlook: June 9–15, 2025
Range-Bound as Oversupply Battles Seasonal Demand
Crude oil prices continue to trade in a cautious range as markets enter the second week of June. Brent is holding steady in the mid-$60s per barrel, while West Texas Intermediate (WTI) lags slightly behind. The current landscape reflects a tug-of-war between oversupply concerns, soft demand, and offsetting support from geopolitical risks and seasonal consumption trends. Investors are closely watching for key developments from economic data releases, U.S. inventory reports, and potential shifts in OPEC+ policy.
Supply and Demand: Oversupply Looms
The global oil balance in 2025 remains tilted toward oversupply. The International Energy Agency (IEA) projects that production will outpace demand by roughly 700,000 barrels per day (bpd) this year. OPEC+ nations have increased output significantly, while global demand growth has cooled amid economic uncertainty. In the U.S., gasoline inventories rose by more than 5 million barrels last week—an unusual build for the start of the summer driving season—pointing to softer-than-expected consumption.
However, global crude inventories remain below the five-year average, and upcoming travel-related demand could help narrow the current imbalance.
OPEC+ Policy and U.S. Shale Restraint
OPEC+ is gradually unwinding its production cuts. Since April, output has increased by nearly 1 million bpd, with an additional 411,000 bpd scheduled for July. Saudi Arabia appears comfortable with slightly lower prices in exchange for higher market share and influence.
Conversely, U.S. shale producers continue to show capital discipline. The active rig count fell to 442, the lowest since 2021, even as production hovers around 13.4 million bpd. With prices under $70 and investors focus on profitability, further expansion appears unlikely.
Geopolitical and Macro Influences
Geopolitical uncertainty remains a key support pillar. Disruptions from Canadian wildfires, ongoing tensions in Ukraine, and unresolved U.S.–Iran talks are keeping a lid on supply. Meanwhile, last week’s strong U.S. jobs data helped ease recession fears and sparked optimism over energy demand.
Technical View and Outlook
WTI broke above its recent $60–$64 range, now stabilizing with bullish momentum. The RSI sits at 71, signaling near-term strength, but On-Balance Volume (OBV) divergence hints at a possible pause.
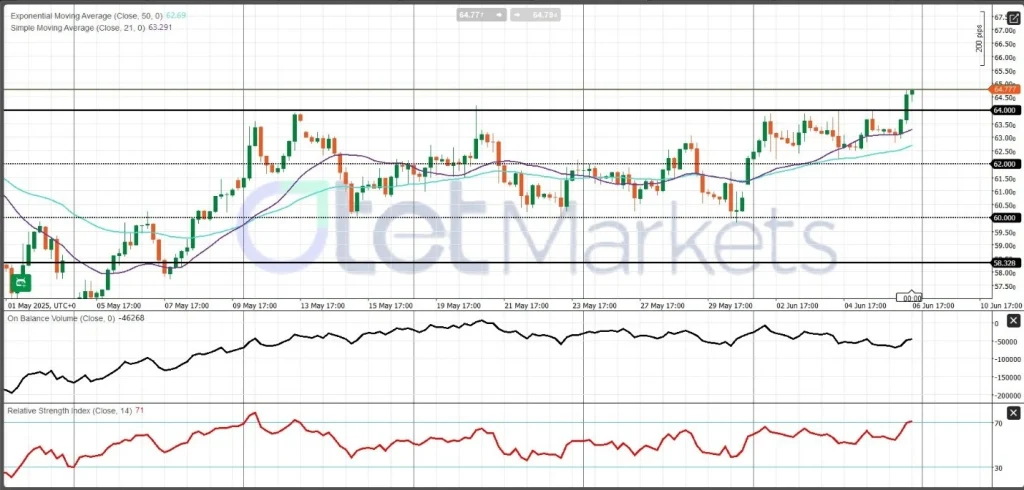
Bottom line: Crude oil remains range-bound, with upside capped by oversupply and downsides cushioned by geopolitical risks and seasonal demand. The next breakout will likely depend on macroeconomic surprises or a shift in supply dynamics.
Bitcoin Market Outlook: June 9–15, 2025
Consolidation or Correction? BTC at a Technical Crossroads
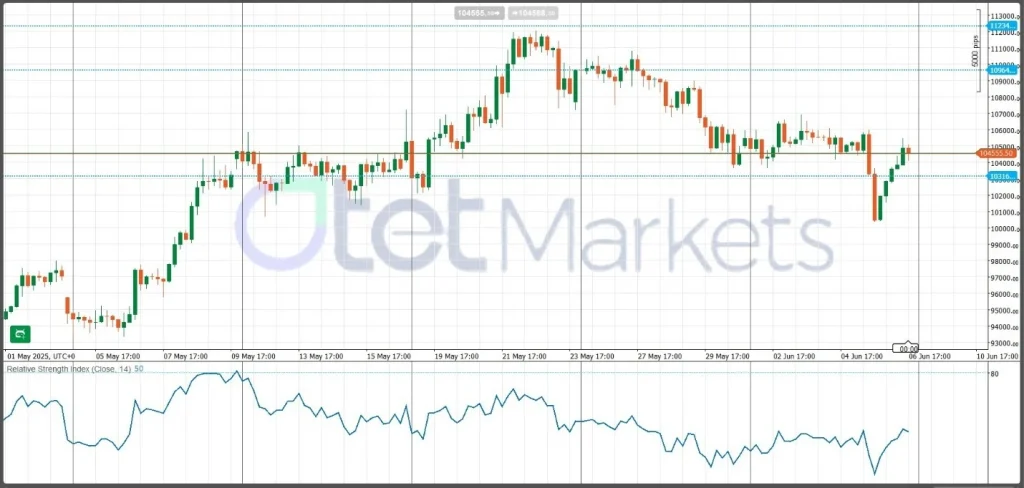
Bitcoin enters the week trading between $104,000 and $108,000, showing signs of consolidation after peaking above $111,000 in May. On-chain data and technical patterns suggest a market pausing for direction, with bullish long-term signals but short-term caution.
On-Chain Metrics: Whales Accumulate, Supply Tightens
Large Bitcoin holders—commonly referred to as “whales”—are increasing their exposure. Wallets holding over 1,000 BTC have added over 600,000 BTC since March, totaling more than 5.6% of total supply, signaling ongoing institutional accumulation. At the same time, BTC balances on centralized exchanges have fallen to below 11%, a five-year low, pointing to reduced selling pressure.
However, some whale addresses have sent large BTC volumes to exchanges, indicating profit-taking near recent highs. Retail wallets holding less than 1 BTC have also been aggressively accumulating—typically a contrarian signal in overheated markets.
Miners and Supply Dynamics
Miners are signaling confidence. The Hash Ribbons indicator has flashed a buy signal, suggesting miner capitulation is over. BTC miner reserves remain stable around 1.8 million BTC, while the Bitcoin hash rate continues to climb to new highs. This suggests miners are holding coins and anticipating higher prices.
Sentiment & Media Impact
Sentiment has been volatile. A recent social media clash between Elon Musk and Donald Trump triggered a 3% BTC dip and liquidations exceeding $300 million. Yet Bitcoin recovered quickly, showing resilience. Media coverage is split—some warn of profit-taking by long-term holders, while others highlight strengthening fundamentals and declining sell-side liquidity.
Retail optimism, especially among small wallets, has surged—a sign of emotional buying that often precedes corrections.
Outlook
BTC is at a turning point. If it breaks above $108K with strong volume, bullish momentum could resume. But if $104K fails, a drop toward $95,000–96,000 is likely. Traders should watch ETF flows, exchange
Technical Picture: Key Levels in Focus
Bitcoin remains technically bound. Support sits near $104,000, with strong buying interest seen around $104.8K. Resistance lies near $108,000, and a breakout above this could confirm a cup-and-handle pattern, with upside-distance targets near $114,800.
Technical indicators like RSI and MACD are neutral, and volume has been low, reinforcing a consolidation scenario.
Share
Hot topics

What is News Trading in Forex? A Complete Guide to Event-Driven Strategy
Introduction If you have ever watched the forex market during a major economic announcement, you know how dramatic it can be. Prices jump within seconds. Spreads widen. Volatility explodes. For...
Read more


Submit comment
Your email address will not be published. Required fields are marked *