Inflation: From China to the U.S.!
After weakening labor data in the U.S., inflation numbers will take center stage in the week ahead. However, geopolitical tensions remain the primary market mover. The trade war and ongoing conflict in Ukraine continue to affect the market. In Asia, China’s inflation data and plans for additional stimulus measures aimed to support its economy will be at the center of stages.
United States
In February, the U.S. economy added 151K jobs, while the unemployment rate rose to 4.1% and the labor force participation rate declined to 62.4%. Amid an ongoing trade war, economic developments reflected heightened uncertainty around trade policy, leading to a surge in imports, industry concerns, and reports of rising input prices in the short term. A closer look at labor data suggests some effects of the new administration, with increased hiring in the manufacturing sector and reduced hiring in the government sector.
Additionally, weakening consumer confidence weighed on economic activity, with retail sales and manufacturing slowing in February. The Trump administration’s new 25% tariffs on Mexico and Canada, along with an additional 10% tariff on Chinese products—matched by retaliatory tariffs from China—are exacerbating concerns. In the short term, the trade war could lead to higher inflation and slower growth, negatively impacting both consumers and businesses. However, its mid- and long-term effects remain uncertain. These trade and geopolitical tensions have driven investors toward safer assets, as reflected in the increased demand for U.S. Treasuries. The upcoming U.S. inflation and job reports will be closely watched for further insights into the economy’s trajectory.
In response to the latest data, particularly developments in the labor market, the 10-year Treasury yield initially dropped sharply to 4.21% before rebounding above 4.30%. The yield on the 10-year note began 2025 at around 4.6%, peaking at 4.8% in mid-January. Meanwhile, the U.S. dollar remained flat, and Wall Street reacted negatively to the data.
Looking ahead, key reports to watch this week include JOLTS (Tuesday), CPI (Wednesday), and the Federal Budget (Wednesday).
Labor demand showed signs of stabilizing at the end of 2024 despite a sharp drop in December job openings. The final quarter saw the first quarterly increase in openings over two and a half years. Job turnover rates remain historically low, but recent stability in hiring and quit rates suggests a potential turning point. In January, job openings are expected to remain steady, with minimal impact from the federal hiring freeze. However, economic policy uncertainty could further dampen job turnover as both jobseekers and employers take a cautious approach.
Inflation started strong in 2025, much like last year, but January’s price growth was concentrated in a few specific categories, such as prescription drugs and used cars. February’s CPI is expected to moderate, with a 0.3% increase compared to January’s 0.5%. Food prices remain a key driver, while energy costs may help slow overall inflation. Core CPI is also projected to rise by 0.3%, keeping the annual rate within the 3.2%-3.3% range for the ninth consecutive month. While some core goods may see price relief, the newly implemented 10% tariff on Chinese imports could sustain inflationary pressures.
Both the U.S. Dollar Index and Wall Street are likely to remain sensitive to ongoing economic data releases and geopolitical developments in the week ahead, with the potential for continued volatility as investors assess the evolving landscape.
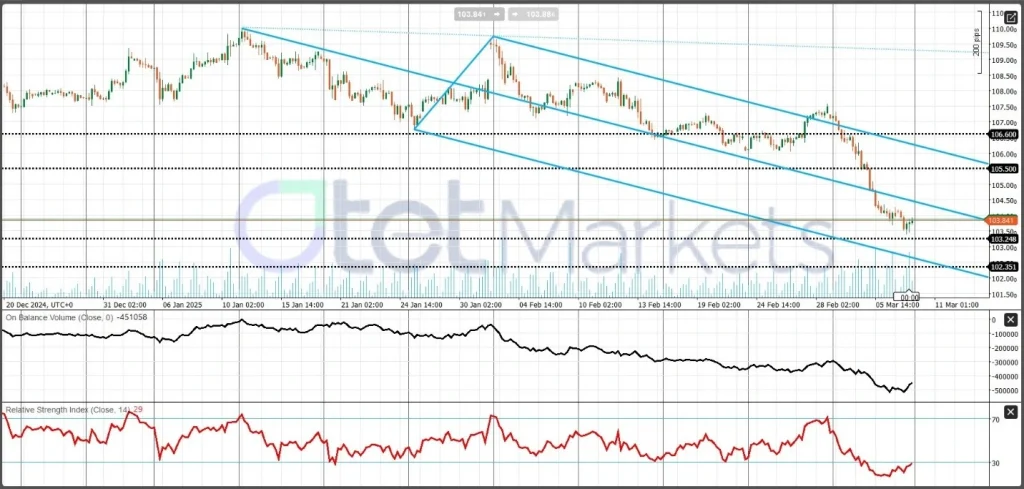
U.S. Dollar Index (DXY):
Weaker-than-expected figures could lead investors to anticipate a more cautious approach from the Federal Reserve regarding interest rate adjustments, potentially weakening the dollar. On the other hand, uncertainties stemming from Trump’s tariff policies could contribute to dollar volatility. While fundamental data does not strongly support the U.S. dollar, from a technical perspective, the USD Index tends to decline, with strong support at 103.25 and then 102.35. However, a recovery above the 104-mark could shift the market direction.
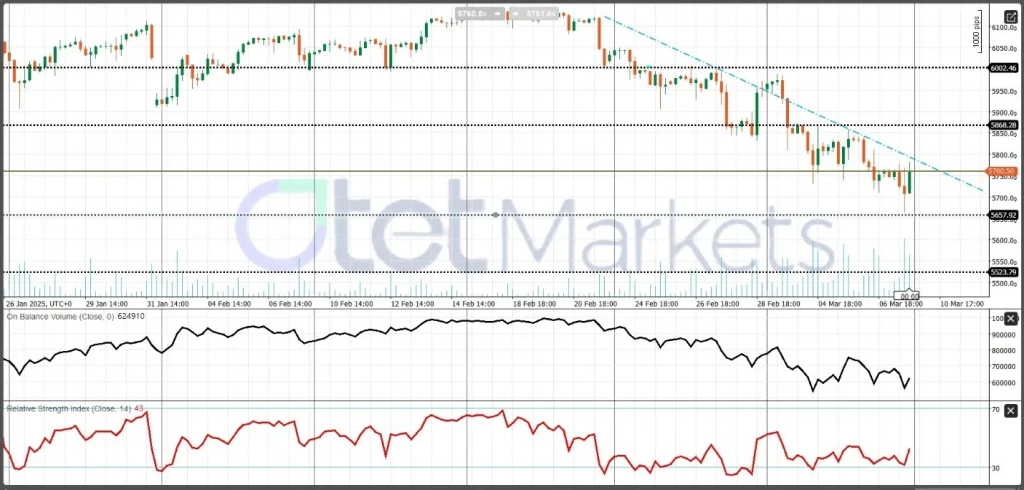
Wall Street:
On Wall Street, major U.S. stock indexes have recently experienced volatility and downward pressure, with the S&P 500 recording a 3.1% decline over the past week—the largest since September. Concerns about the economic implications of new tariffs, combined with a weaker economic outlook and declining consumer sentiment, are playing a significant role. Investors remain cautious about potential disruptions to global trade and economic growth resulting from these policies. As Fed Chair Jerome Powell recently commented, the “wait-and-see” approach to interest rate decisions remain the primary FOMC policy, which may provide some reassurance to markets but also reflects underlying uncertainties.
From a technical perspective, the S&P 500 remains in a clear downtrend, with key resistance at 6,000. The next downside targets are 5,650, followed by 5,520.
Loonie and BoC
The Bank of Canada (BoC) is scheduled to announce its interest rate decision on March 12, 2025. In December 2024, the BoC reduced its benchmark interest rate by 50 basis points to 3.25%, marking the fifth consecutive rate cut. This decision was influenced by slowing economic growth and inflation aligning with the BoC’s 2% target.
Recent economic indicators present a mixed picture of Canada’s economic health, which will likely influence the BoC’s upcoming decision. While the market initially expected a pause in the rate cut cycle, the overall weakness in economic activity and the risks posed by tariffs have shifted the consensus toward another rate cut. However, if the BoC does not cut rates in March, it is expected to deliver 25 bps rate cuts in both the April and June meetings. This would bring the Bank of Canada’s terminal rate to 2.75% by mid-2025.
Canada’s unemployment rate remained steady at 6.6% in February, with a modest addition of 1,100 jobs. This marks a significant slowdown compared to the 76,000 jobs added in January and the cumulative 211,000 jobs from November to January. Additionally, while the average hourly wage for permanent employees increased by 4.0% year-over-year in February, inflation remains a concern. Canada’s January CPI report showed persistent inflationary pressures, with average core inflation over the past six months rising at an annualized pace of 3.1%—still well above the central bank’s 2% target. Inflation, coupled with the impact of trade tensions, remains a key issue.
The outlook for Canada’s economy is highly dependent on tariffs. According to the latest updates, tariffs on most Canadian products have been delayed. However, the tariffs that have been imposed could contribute to slower growth and higher inflation.
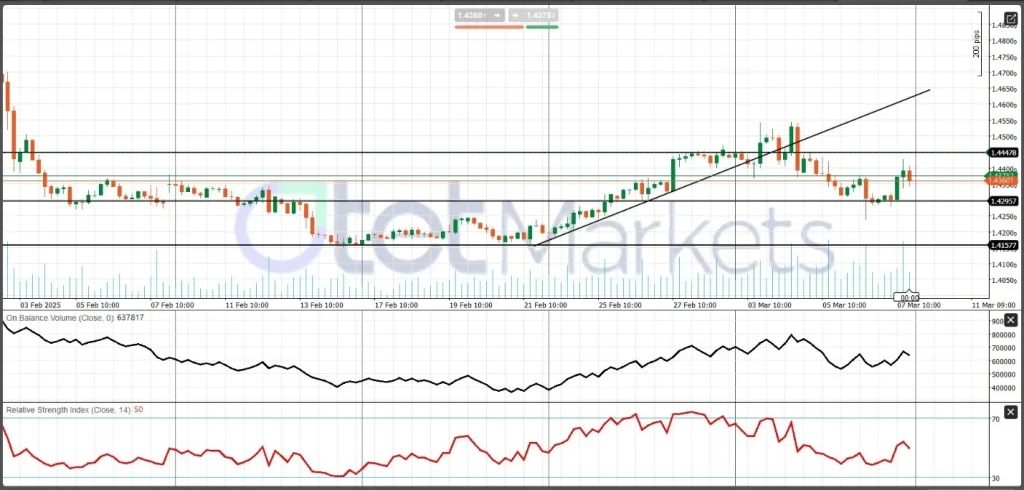
Given the current economic outlook and expected policy decisions, the Loonie appears to be losing steam against its counterparts. From a technical perspective, USD/CAD has shown bullish signals following its recent sideways movement. Initial support and resistance levels are at 1.43 and 1.45, respectively.
Gold
Gold prices have experienced significant movements recently. After reaching an all-time high of $2,956 three weeks ago, gold underwent a brief correction, dipping to $2,832. However, it has since rebounded swiftly, with current prices around $2,910, suggesting that the pullback may already be over and the yellow metal is ready to continue its overall bull run towards $3,000. Increased demand from central banks, along with investors seeking safe-haven assets amid geopolitical tensions and inflation fears, are the main market drivers.
With Friday’s closing price around $2,911.00 per ounce, the yellow metal gained 1.7% for the week. A weaker-than-expected jobs report led to concerns about economic growth and potential growth concerns amid higher inflation, which could pressure gold prices in the coming days. Generally, weaker job growth could support gold as a safe-haven asset.
Gold prices are inversely related to the U.S. dollar and Treasury yields. As U.S. Treasury yields have been moving lower recently, which also supports a weaker dollar, this makes gold more attractive to foreign investors, potentially boosting prices. On the flip side, rising yields increase the opportunity cost of holding non-yielding assets like gold, potentially weighing on its price.
The geopolitical tensions and new trade policies that increase market uncertainties have supported gold prices this year, leading to multiple record highs. Investors often turn to gold as a safe-haven asset during geopolitical tensions and economic uncertainties.
From a technical point of view, XAU/USD has returned to a bullish trend above the 61.8% Fibonacci level at $2,910. Immediate resistance is at $2,927. A breakout here could push gold towards the next resistance at $2,942 and then $2,956.
Immediate support is $2,895, a key psychological level. A breach below this could signal a further downside, with the next support around $2,880.
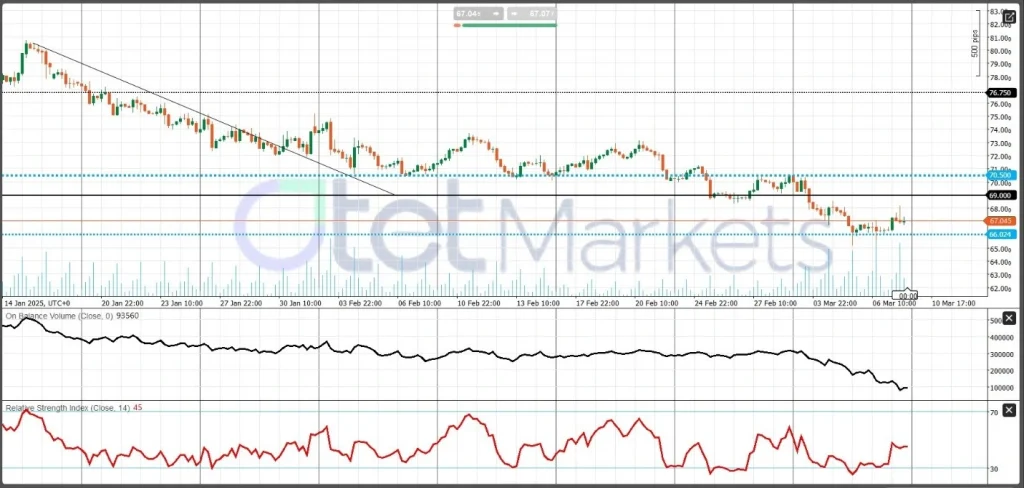
Oil
Oil markets have been volatile, influenced by geopolitical developments and supply considerations. In the coming days, West Texas Intermediate (WTI) crude oil prices are expected to experience further volatility, driven by recent inventory data, OPEC+ decisions, and forecasts from major energy agencies such as the EIA and IEA monthly energy reports. Additionally, the U.S. government’s intention to purchase $20 billion in oil to refill its strategic petroleum reserve has contributed to price increases. However, concerns about a potential oil glut, as well as the impact of U.S. economic health and trade tariffs, continue to loom over the market.
While OPEC+ has confirmed plans to incrementally increase oil production starting in April, ending previous cuts, the U.S. Energy Information Administration (EIA) reported a significant increase in crude oil inventories, with a rise of 3.614 million barrels. This substantial build-up in inventories has raised concerns about a supply glut and its potential downward pressure on WTI prices. Recent comments by Russia’s deputy prime minister have raised hopes that OPEC+ might reverse its decision to increase oil production, leading to a rebound in oil prices.
Given these developments, WTI prices are likely to remain under pressure in the short term. From a technical perspective, WTI remains bearish with immediate resistance at $69 and strong support around $66.
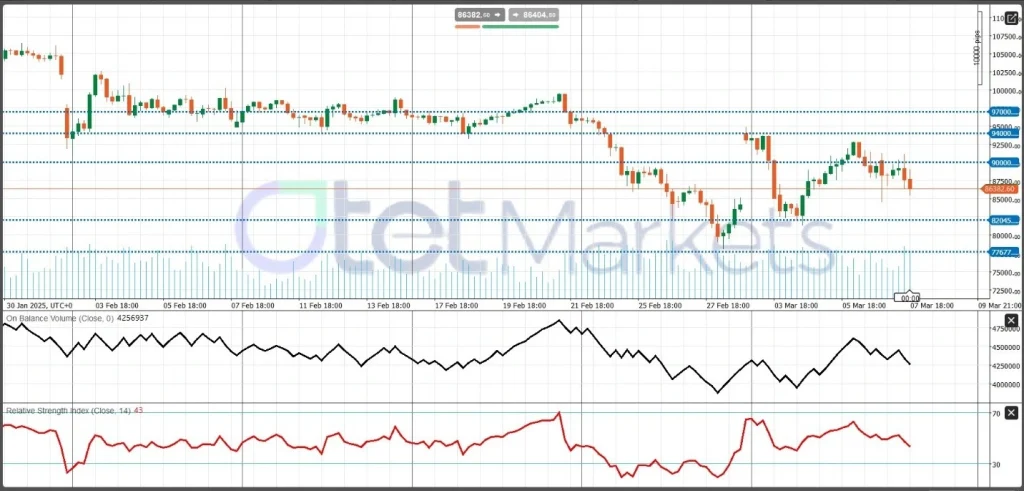
BTC
The cryptocurrency market in 2025, especially Bitcoin (BTC), has been marked by extreme volatility. This uncertainty is causing many investors to stay on the sidelines, a trend visible in the Bitcoin ETF space.
U.S. President Donald Trump hosted a summit at the White House focused on his plans to create a government-owned digital asset stockpile, including Bitcoin. The summit welcomed key industry figures such as MicroStrategy CEO Michael Saylor, Coinbase CEO Brian Armstrong, and the Winklevoss twins, along with top administration officials. The central goal was to establish a strategic reserve of digital assets, particularly Bitcoin, through an executive order signed by Trump. The reserve would be funded by Bitcoin forfeited in criminal or civil asset forfeiture cases, with no taxpayer funds involved. Trump emphasized that the initiative would have no cost to taxpayers, and safeguards for consumers would be in place.
Recent data from Lookonchain shows that Bitcoin ETFs have seen another round of outflows, with $137.62 million (1,537 BTC) leaving these investment products in the last 24 hours. Last week, over $2.9 billion in outflows were recorded, and the trend has yet to reverse. BlackRock’s Bitcoin ETF, IBIT, saw the largest outflows, losing 689 BTC (approximately $61.7 million) in a single day as investors sold off their holdings. Despite the outflows, BlackRock still holds 571,970 BTC, valued at $51.23 billion. The total BTC held by all Bitcoin ETF issuers stands at 1,127,831 BTC, worth around $101 billion.
The lack of buying pressure, both from institutional and retail investors, is hindering price gains. Technically, BTC remains bearish, and trading volume has decreased. The Bitcoin price is facing difficulty breaking through the $90,000 resistance level. Technical indicators show resistance at the 50-day and 100-day EMAs, and without a significant influx of capital, Bitcoin may consolidate or pull back toward lower support levels. A breakout above $90,000 with high volume could reignite bullish sentiment and bring the $100,000 target back into play, but current market conditions suggest uncertainty. Currently, $82,000 and then $78,000 seem more likely to be touched.
Share
Hot topics
Top 10 forex indicators
Top 10 forex indicators Every Trader Should Know Introduction Many forex traders become overwhelmed by looking at price charts. The candles are always moving, and it can seem crazy because...
Read more


Submit comment
Your email address will not be published. Required fields are marked *