
Global Weekly Macro Review: War-Driven Risk Premium Meets a Growth Scare
This week, the global macro narrative shifted from slow expansion and disinflation to a more fragile risk-premium environment, driven mainly by the widening Middle East conflict and the resulting energy shock. Oil surged, lifting inflation risks, tightening financial conditions, and raising concerns for energy-importing economies, especially in Europe and parts of Asia. Although OPEC+ announced a modest output increase, markets focused more on supply and shipping disruption risks.
In the United States, growth signals were mixed. The biggest shock came from a weak labor-market report, with negative payrolls and a higher unemployment rate, but underlying demand was not collapsing consumer spending and services activity stayed relatively firm. This points to a harder mix of slower growth and sticky cost pressures.
In Europe, the picture was similarly conflicting. Growth softened, inflation surprised to the upside, and labor markets remained resilient. PMIs showed some improvement in manufacturing, but France lagged while Germany and Italy looked firmer. Europe also remains highly exposed to higher energy prices.
China leaned more heavily into a tech-led policy strategy, while activity data remained uneven. Japan looked steadier, supported by expansionary PMIs and stronger capex. Across emerging markets, risk sentiment, USD strength, and energy exposure dominated.
U.S. Weekly Macro Review: Growth Holds, Labor Cracks, and Inflation Signals Stay Noisy
The U.S. macro picture this week became notably more fragile. The economy is still expanding, but the balance of evidence no longer supports a clean narrative of steady growth and smooth disinflation. Consumer demand remains positive, services activity is still strong, and business surveys continue to signal expansion. However, the labor market delivered a major downside surprise, while inflation and cost signals remained mixed enough to keep the Federal Reserve cautious.
Growth has slowed at the margin. The Atlanta Fed’s GDPNow estimate for first-quarter growth was cut to 2.1% from 3.0%, pointing to a meaningful downshift rather than recession. Inventory data offered some support, with retail inventories excluding autos rising 0.4% and business inventories up 0.1%, but these figures also raise concern that goods may be accumulating because final demand is softening.
Consumer spending reflected that same mixed tone. January retail sales fell 0.2% month over month, and core sales were flat, suggesting softer momentum. Still, the details were better than the headline: the retail control group rose modestly, sales excluding gasoline and autos increased, and year-over-year retail sales growth accelerated to 3.16%. The consumer appears to be cooling, not collapsing, with some weakness likely influenced by weather, delayed data, and temporary seasonal distortions.
The labor market was the biggest concern. Nonfarm payrolls fell by 92,000 in February, far below expectations, while private payrolls dropped 86,000. Previous months were revised lower, leaving the three-month average payroll gain at only 6,000. Job losses were broad across sectors, and the unemployment rate rose to 4.4%, while participation slipped. However, not all labor indicators confirmed a full breakdown: initial jobless claims remained low, ADP payrolls rose, and Challenger job cuts fell. Continuing claims increased, though, suggesting it is taking longer for unemployed workers to find work. Wage growth stayed firm at 0.4% month over month and 3.8% year over year.
Inflation signals remained noisy. Import prices stayed subdued, but domestic cost pressures were less comforting. Unit labor costs rebounded, manufacturing and services price gauges stayed elevated, and tariff-related metals costs added pressure. Energy risks linked to the Iran conflict also increased uncertainty.
Overall, the U.S. economy is still growing, supported by services and resilient spending, but weakening labor momentum has become the central macro risk. With wage growth still firm and inflation signals not fully benign, the Fed faces a much harder balancing act.
U.S. Economic Outlook for the Week Ahead: March 9–13, 2026
The coming week is a pivotal one for U.S. macro markets ahead of the March 17–18 FOMC meeting, with the focus shifting away from broad activity indicators and toward inflation, labor demand, Fed expectations, and Treasury supply. The key releases are Wednesday’s February CPI, Friday’s January PCE inflation and personal spending report, Friday’s Q4 GDP second estimate, and a heavy slate of Treasury auctions across the 3-year, 10-year, and 30-year maturities.
The backdrop is already complicated. The Fed held rates at 3.50%–3.75% in January and described the economy as expanding solidly, with inflation still somewhat elevated. Since then, incoming data have become more mixed. February payrolls fell by 92,000, unemployment rose to 4.4%, and wage growth stayed firm at 0.4% month over month and 3.8% year over year. Retail sales slipped 0.2% in January, though they still rose 3.2% from a year earlier, while Atlanta Fed GDPNow stood at 2.1% for Q1 as of March 6.
Geopolitics add another layer of uncertainty. The recent oil spike linked to the Middle East conflict means this week’s CPI and PCE data may already look somewhat backward-looking, since they were compiled before the latest energy shock. Markets may therefore use them as only a partial guide to near-term inflation.
The most important driver is inflation. CPI on Wednesday and PCE on Friday give markets two major inflation checks in the same week, and these releases carry extra weight because some supporting data, such as PPI and import/export prices, have been delayed. Expectations are for headline and core CPI to rise around 2.4% year over year, suggesting disinflation progress may be stalling. PCE and income/spending data are expected to show that consumers remain resilient, but with household finances under more pressure.
The Fed will likely interpret the week through a broader lens: whether inflation is easing enough to offset softer labor data, or whether the economy is drifting into a more difficult mix of weaker employment and sticky prices. Treasury auctions will also matter, because weak demand could intensify any bond-market selloff if inflation surprises higher or oil continues climbing.
Market outlook
The week ahead is likely to trade primarily as a Fed-pricing week, not a pure growth week. Markets already absorbed a weak payrolls report, so the real focus now shifts to whether upcoming inflation data—especially Wednesday’s CPI and Friday’s PCE—can justify a more dovish policy path into the March 17–18 FOMC meeting. If both inflation readings come in softer and jobless claims remain contained, front-end Treasury yields would likely fall and markets could rebuild confidence in Fed easing. But if CPI and PCE remain firm, especially with oil prices rising in the background, the Fed is more likely to stay cautious, leaving short-end yields sticky even if labor indicators continue to soften.
That setup makes equities highly sensitive to rates and duration, rather than to company-specific earnings stories. Growth and long-duration stocks would benefit most from softer inflation because lower yields would support valuations. Financials and cyclicals are likely to react more to the combined message from inflation data and Treasury auctions. The U.S. dollar should follow the same logic: softer inflation plus weaker labor would typically weigh on the dollar, while sticky inflation, strong auction demand, or elevated geopolitical risk would tend to keep it supported.
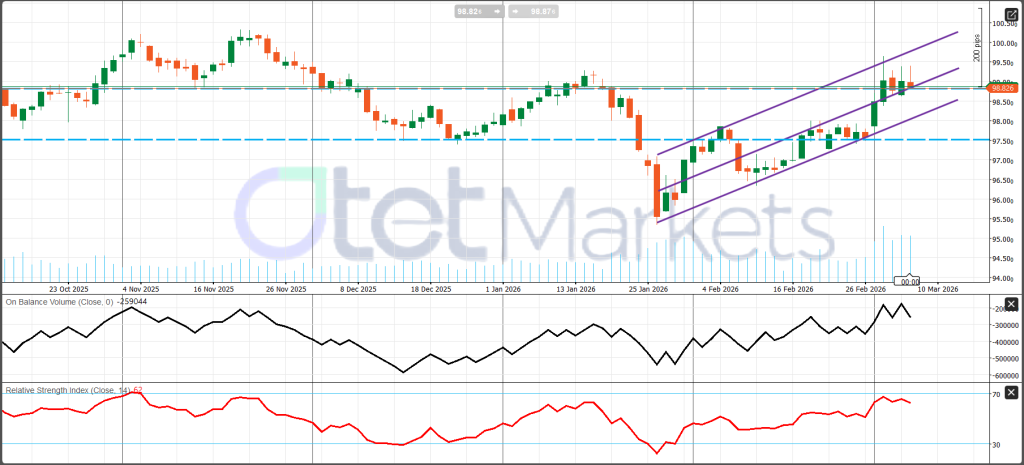
Over the past week, the USD maintained a strong bias for most of the period, helped by haven demand and inflation concerns tied to oil and conflict risk. It eased slightly by Friday, but not enough to break the broader constructive tone. Technically, the Dollar Index has shifted into a short-term bullish recovery, with higher highs and higher lows inside an ascending channel. It is now testing an important resistance zone around 98.80–99.00. A breakout above that area would strengthen the bullish case, while rejection there would suggest the move is still only a corrective rebound. Momentum indicators remain supportive, with RSI showing bullish but not overbought conditions and OBV confirming genuine buying interest.
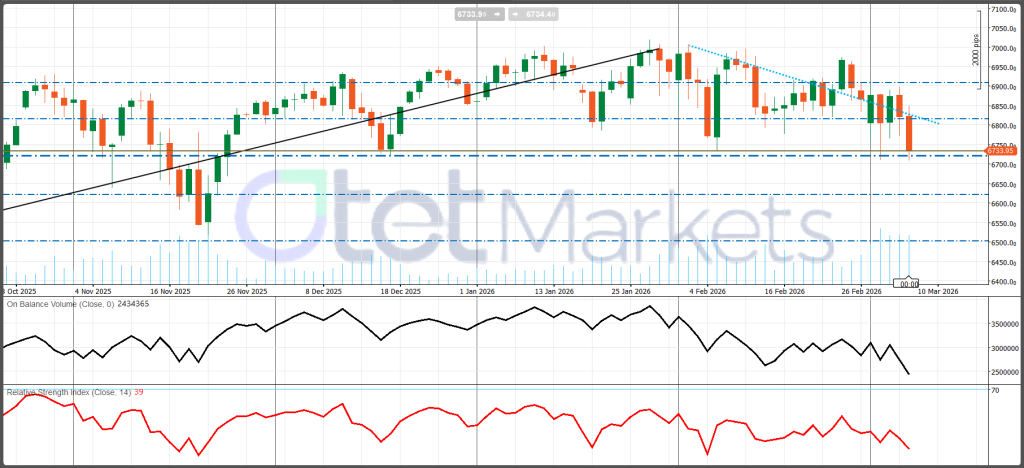
In Wall Street, trading was choppy and increasingly fragile. Equities rebounded at times from war-driven weakness, but those recoveries lacked staying power. By Friday, the tone had clearly shifted to risk-off, with the Dow down 0.91%, the S&P 500 down 1.33%, and the Nasdaq down 1.60%. Tech underperformed, signaling pressure on long-duration growth as macro uncertainty rose. Technically, the S&P 500 has entered a short-term bearish correction. The earlier uptrend has broken, rallies are being capped by a descending trendline, and price is now testing major support around 6730–6720. If that zone fails, the correction could deepen further.
Eurozone Economic Review: What Happened Last Week
Last week’s euro-area data showed an economy that is still expanding, but only slowly and with a more difficult inflation backdrop for the ECB. The overall picture was mixed: growth softened, inflation surprised to the upside, and producer prices rebounded on a monthly basis, while the labor market stayed resilient and business surveys hinted at stabilization in parts of the private sector, especially manufacturing. The result is a fragile, uneven eurozone recovery that remains highly data-dependent.
Growth data confirmed that momentum weakened into the end of 2025. Eurozone GDP rose just 0.2% quarter on quarter in the fourth quarter, below expectations, while annual growth slowed to 1.2% from 1.4%. That is not recessionary, but it does show that the euro area entered 2026 in a low-speed expansion, without enough strength to absorb shocks comfortably.
Inflation was the main disappointment from the ECB’s perspective. Preliminary February data showed headline inflation rising to 1.9% year on year from 1.7%, while core inflation accelerated to 2.4% from 2.2%. Monthly gains were also firm, reversing the prior month’s declines. This matters because it interrupts the disinflation narrative and reduces the case for a fast easing cycle. Producer prices added to that concern: although annual PPI remained negative, the monthly increase of 0.7% was much stronger than expected, showing that pipeline price pressures can return quickly.
The labor market remained a key source of resilience. Unemployment fell to 6.1%, employment continued to rise, and total employment reached about 172.6 million. A firm labor market helps support consumption and reduces the risk of a sharper slowdown, but it also means domestic inflation pressures cannot be fully dismissed.
Business surveys were somewhat more encouraging. Manufacturing PMI moved back above 50, signaling renewed expansion, while services and composite PMIs remained modestly positive. Still, the recovery is uneven across countries. Germany and Italy looked firmer, while France remained the main weak spot, with services and composite readings still slightly below 50. Construction also stayed weak across the bloc, especially in Germany and France, highlighting the ongoing drag from higher financing costs.
Consumer and industrial data reinforced the mixed tone. Retail sales were soft, Germany’s consumer sector remained inconsistent, and France showed some improvement in industrial output. Southern Europe, especially Italy and Spain, appeared relatively firmer in some areas.
Overall, the eurozone is not in immediate trouble, but it does have a slightly more stagflation Ary feel. Growth is weak, inflation is noisier, and the recovery remains uneven. For the ECB, the message is clear: the economy is not weak enough to force urgent support, but inflation is still too uncertain for easy confidence.
EU Economic Outlook for the Week Ahead
The EU and euro-area economy start the week in a slow but still positive growth phase, with the key issue being whether this gradual expansion can continue without inflation becoming a bigger problem. Eurostat’s latest figures showed that both the euro area and the wider EU grew by 0.2% quarter on quarter in Q4 2025, supported mainly by household consumption, government spending, and fixed investment, while trade made a negative contribution. That suggests domestic demand is still keeping the economy moving, even though external demand remains weak.
At the same time, the inflation picture has become less comfortable. February euro-area CPI rose to 1.9% year on year, up from 1.7% in January. That increase matters because it came despite weak overall demand, raising concerns that Europe may be drifting toward a more stagflationary mix of soft growth and firmer prices. If policymakers fail to address that tension, the region could face more difficult macro conditions in the coming months.
The labor market remains one of Europe’s main stabilizers. Employment in the euro area rose 0.2% quarter on quarter, and the unemployment rate fell to 6.1% in January from 6.2% in December. Even though Germany saw a small decline in employment, the broader labor backdrop is still supportive enough to prevent a sharper downturn in consumption.
This week is mainly a pre-ECB positioning week, not a decision week. The ECB left rates unchanged on 5 February, and the next policy meeting is scheduled for 18–19 March. That means the coming data and policy headlines will shape expectations for that meeting rather than trigger an immediate policy move.
The main market driver will be Germany, given its importance to euro-area manufacturing. Monday brings German factory orders, turnover, production, and truck toll data, while Tuesday adds trade figures. If these numbers hold up, markets may gain confidence that the euro area is still grinding forward. If they disappoint, worries about fragile industrial momentum will deepen.
Thursday’s euro-area industrial production release will be the week’s main bloc-wide hard-data event, offering the clearest read on whether industry is stabilizing or slipping again. Meanwhile, Eurogroup and ECOFIN meetings will keep fiscal and policy themes in focus.
Overall, the week is likely to be driven by German macro, euro-area industrial momentum, ECB repricing into March, and financing conditions. Growth remains positive, but still too weak and uneven to generate much confidence.
EUR/USD Technical Analysis – Daily chart
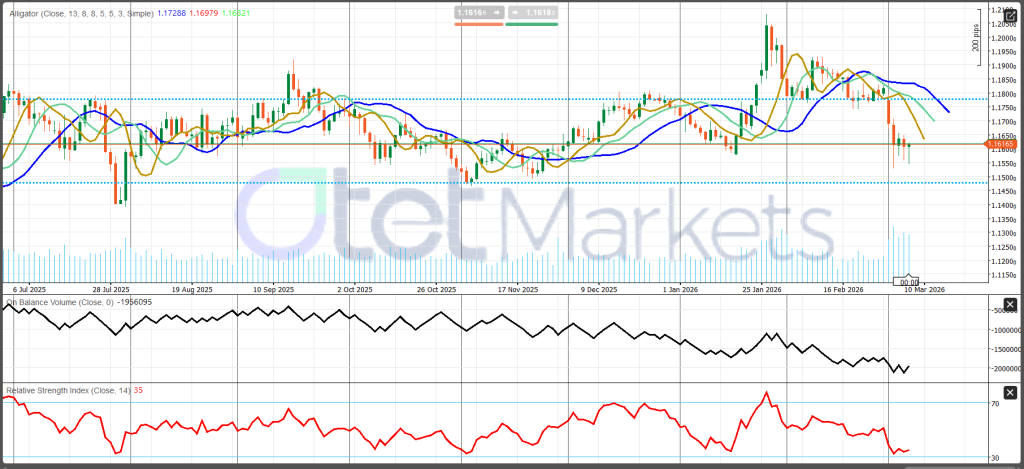
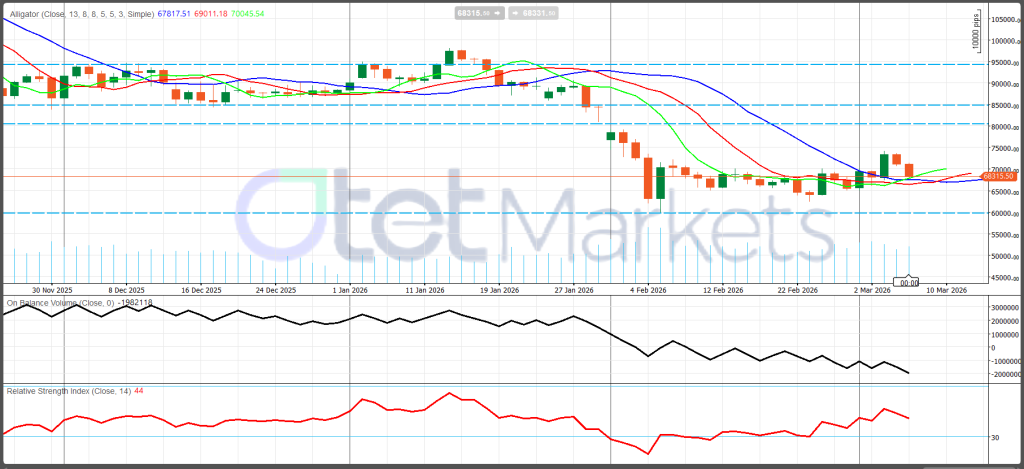
EUR/USD has shifted from a choppy range into a clear bearish phase after failing near 1.20–1.21 and falling back to the key 1.1615 pivot zone. This level is now the main battleground: if it holds, the pair could stage a technical bounce, but a decisive daily break would likely open a deeper drop toward 1.1450. Short-term signals favor the downside. The Alligator indicator has turned bearish, with the fast line moving below the others and the slower blue line also rolling over, suggesting momentum is weakening and the market is transitioning from consolidation into a downtrend. RSI near 35 shows bearish momentum is dominant and close to oversold, but not yet fully exhausted, leaving room for further downside. OBV is also declining, confirming real selling pressure rather than a weak move. On the upside, resistance stands at 1.1780, then 1.1850–1.1900, while 1.2050–1.2100 remains the major recovery barrier for bulls ahead.
Gold: current market condition and weekly outlook
Gold’s broader trend remains bullish, but the week ahead is likely to be volatile, headline-driven, and highly sensitive to both macro data and geopolitics. The market is caught between several conflicting forces. On the supportive side, gold still benefits from safe-haven demand linked to the Middle East conflict and from a weaker U.S. labor backdrop after February payrolls fell and unemployment rose. On the limiting side, the same geopolitical shock has pushed oil prices sharply higher, which has lifted inflation concerns, supported the dollar and Treasury yields, and reduced confidence in a quick Fed easing cycle. That conflict between growth fears and inflation fears explains why gold has not rallied in a straight line.
During the past week, gold initially behaved like a classic crisis hedge, surging on geopolitical risk, but later shifted into a more choppy consolidation pattern as markets moved between risk-off and relief-rally modes. In other words, gold front-ran the shock, then lost momentum as traders reassessed the broader macro implications. Even so, the metal remains in a strong long-term uptrend. After a powerful rally through 2025 and into late January 2026, gold corrected sharply but has since built a base above the 5,000–5,100 area. That suggests consolidation rather than a full reversal.
Fundamentally, gold is still supported by elevated macro uncertainty, geopolitical instability, and softer U.S. labor data. However, the near-term constraint is that the oil shock has made the inflation outlook less benign. If inflation remains sticky, the Fed may keep rates higher for longer, which would limit gold’s upside by keeping real yields and the dollar firm. That is why next week’s most important catalysts are Wednesday’s CPI and Friday’s PCE. These releases are effectively the final major inflation tests before the March 17–18 FOMC meeting.
The market setup is relatively clear. Gold would likely turn more decisively bullish if CPI and PCE come in softer than expected, allowing yields and the dollar to ease further and reviving expectations for Fed rate cuts. In that environment, gold would benefit from both haven demand and a more supportive monetary backdrop. On the other hand, if inflation data remain firm while oil stays elevated, gold may stay volatile or corrective rather than breaking higher, even if geopolitical demand remains in the background.
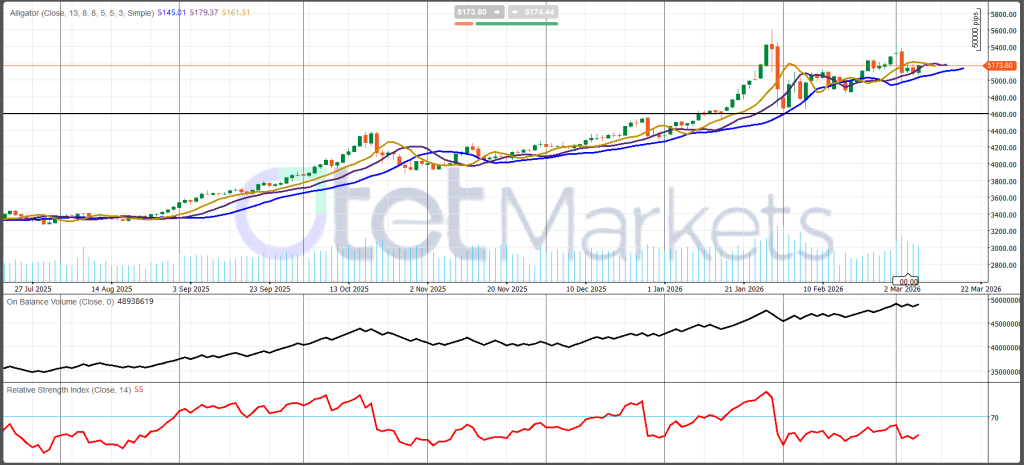
Technically, the daily chart still favors the bulls over the medium term. Gold remains above its major moving structure, RSI around 55 suggests momentum is neutral-to-constructive rather than overstretched, and OBV remains near highs, indicating that accumulation is still broadly intact. The key near-term pivot is 5,170–5,180. Holding above it keeps the tone constructive. Support sits at 5,050–5,100, then 4,950–5,000, while resistance is at 5,250–5,300 and then 5,450–5,500. Overall, gold’s long-term uptrend is intact, but next week’s direction will depend on whether markets focus more on weaker growth or stickier inflation.
WTI: current market condition and weekly outlook
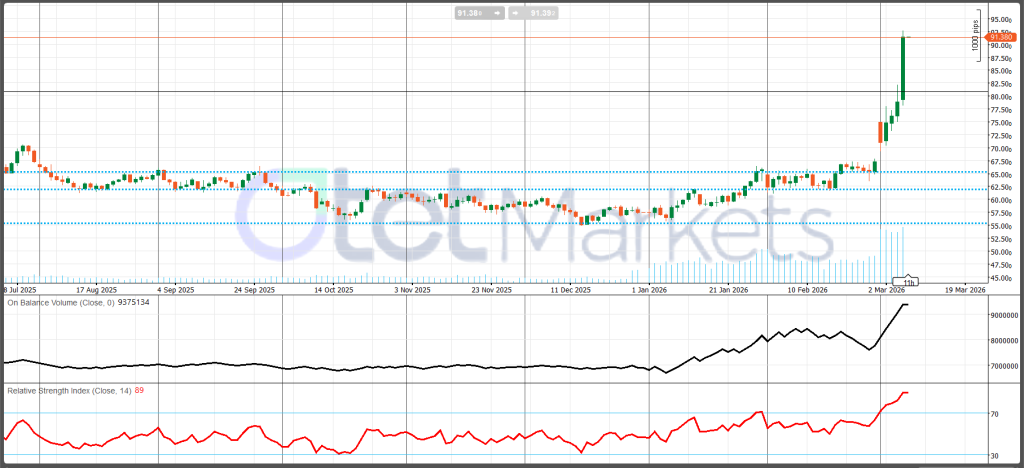
WTI is currently trading in a strong geopolitical risk-premium regime, with prices above $90 per barrel driven mainly by acute supply disruption fears rather than by a normal demand-led cycle. The key force behind the move is the Middle East conflict and the risk to flows through the Strait of Hormuz, which has forced markets to rapidly reprice global supply risk. As long as that disruption persists, the fundamental bias remains bullish, although volatility is likely to stay extremely high. The main downside risk is not inventories or OPEC+ policy, but a quick geopolitical de-escalation that removes part of the war premium.
During the past week, oil traded as a supply-shock market, not a typical inventory-trading market. WTI settled around $91.40 on Friday, up more than 12% on the week, while Brent moved close to $93.60. The market focused on the possibility that conflict involving the U.S., Israel, and Iran could significantly disrupt Gulf shipping and energy exports. Reports indicated that nearly 15 million barrels per day of crude and another 4.5 million barrels per day of refined products were effectively stranded, while large volumes of oil remained stuck on tankers in the Gulf. That is why traders largely ignored the usual bearish arguments.
Domestic U.S. supply data were mixed, but secondary. The EIA reported a 3.5 million barrel build in crude inventories, yet stocks remain below the five-year average. At the same time, gasoline inventories fell, refinery utilization improved, and product demand did not appear to be collapsing. In a normal market, those numbers would matter more. In the current environment, they are outweighed by the much larger issue of export disruption and tightness in global physical supply.
There is also clear support in the physical market. U.S. Gulf heavy crude benchmarks surged, with refiners paying sharply higher premiums for alternatives to disrupted Middle East medium and heavy grades. Fuel prices are already rising in the U.S., reflecting tighter balances and stronger export demand.
Looking ahead, the core question is whether the disruption starts to ease. If there is credible evidence that Hormuz traffic is normalizing or that geopolitical tensions are de-escalating, WTI could correct sharply because a large premium has been added very quickly. If not, the path of least resistance remains upward, and $100 oil becomes a realistic scenario rather than an extreme one.
Next week’s scheduled catalysts include the EIA Short-Term Energy Outlook, the weekly petroleum report, the OPEC monthly report, and U.S. CPI. Still, the market hierarchy is clear: war and shipping headlines matter most, followed by signs of wider producer disruption, refinery demand, product tightness, and only then inventories or macro data.
Technically, WTI remains very bullish after breaking above major resistance levels and accelerating sharply higher. Volume supports the breakout, but with RSI near 89, the market is extremely overbought and vulnerable to sudden pullbacks. Key resistance sits near 91.40, then 95.00, while support is around 80.00 and, more importantly, 65.00.
Crypto market condition and weekly outlook
Crypto enters the week of March 9–13, 2026 in a corrective and unstable recovery, not in a clean bullish re-acceleration. Bitcoin and Ether have rebounded from their February washout lows, but the market remains fragile, nervous, and highly reactive to broader macro conditions. Rather than trading as an isolated asset class, crypto is behaving like a macro risk asset, closely tied to oil prices, Treasury yields, the U.S. dollar, and overall risk sentiment. That makes next week’s key catalysts Wednesday’s U.S. CPI and Friday’s PCE inflation, personal income/spending, and Q4 GDP second estimate, especially with the March 17–18 FOMC meeting approaching.
Current price action shows that crypto has stabilized from the sharp selloff seen earlier in February, when Bitcoin fell to around $63,525 and Ether to roughly $1,854, but the rebound remains incomplete. Bitcoin near $67,873 and Ether around $1,983.75 still leave the market well below previous highs. Recent trading has also shown how quickly crypto reacts to macro stress. When oil surged, bond yields rose, and global sentiment deteriorated, crypto slipped again, confirming that it is still trading more like a volatile extension of the tech-and-liquidity complex than like a safe haven.
The main driver next week is likely to be inflation and Fed expectations. A softer CPI and PCE path, especially if oil stops rising, would likely ease Treasury yields and weaken the dollar, helping crypto recover as markets revive hopes for future Fed easing. That is the bullish scenario. The bearish scenario is the opposite: if inflation remains sticky while oil stays elevated, markets are likely to push back expectations for rate cuts, which would keep pressure on risk assets and leave crypto defensive. In that kind of environment, Bitcoin may remain relatively more stable than the rest of the market, while Ether and higher-beta altcoins would remain more vulnerable.
There is also a regulatory backdrop, but it looks secondary for the near term. In the U.S., the Clarity Act has run into fresh opposition from banks, especially over stablecoin rewards and yield-bearing products, while broader U.S.-UK coordination on crypto regulation remains incomplete. These issues matter for medium-term sentiment, but they are unlikely to be the main market mover over the next few sessions.
Technically, Bitcoin’s daily chart still looks damaged rather than bullish. The prior high-range structure around 85,000–95,000 broke down, and price is now trying to base in the 65,000–70,000 zone. Momentum remains weak, with RSI below 50 and OBV still trending lower, suggesting limited buying conviction. The key near-term pivot is 68,000–70,000. Support lies at 65,000 and then 60,000, while resistance stands at 80,000, 85,000, and 95,000. Overall, crypto has stopped collapsing, but it has not yet rebuilt a convincing bullish structure.
Share
Hot topics

What is Forex Rebate
Introduction If you have been trading Forex for a while, you have probably noticed that every trade comes with a cost. Whether it is spread, commission, or both, trading is...
Read more


Submit comment
Your email address will not be published. Required fields are marked *