
Global Economic Outlook – Week 15, 2026: Inflation, Oil, and Central Banks Set the Tone
Week 15 of 2026 begins with global markets navigating a fragile mix of inflation risks, oil-market volatility, central bank caution, and shifting growth signals. This week-ahead outlook explores the key economic releases, policy events, and geopolitical drivers shaping expectations across the United States, Europe, the United Kingdom, China, Japan, and emerging markets, while assessing what they could mean for currencies, equities, bonds, commodities, and overall market sentiment.
U.S. A
U.S. Economy Weekly
The U.S. economy ended the week in a mixed but still expansionary condition, with the strongest headline coming from the labor market. Nonfarm payrolls rose 178K in March, well above expectations, private payrolls also rebounded, manufacturing employment improved, and the unemployment rate edged down to 4.3%. But underneath that solid headline, labor-market quality was less convincing. Participation slipped, the U6 unemployment rate rose, wage growth cooled on both a monthly and annual basis, and average weekly hours declined. In other words, hiring improved, but wage pressure softened and broader labor slack did not fully disappear.
On the consumer side, the picture remained relatively firm. Retail sales rose more than expected, core retail sales and the control group also beat forecasts, and annual retail sales growth accelerated. Consumer confidence improved, and vehicle sales increased, suggesting households were still spending and that discretionary demand had not collapsed. However, housing-related demand remained weaker. Mortgage rates moved higher, mortgage applications dropped sharply, and both purchase and refinance activity softened. House-price measures also showed a slower pace of growth, indicating that the housing sector remained under pressure even as broader consumption held up.
Business activity showed a more visible split between manufacturing and services. Manufacturing remained in expansion, with the ISM Manufacturing PMI and S&P Global Manufacturing PMI both above prior readings. But the internal details were less reassuring: the ISM prices index jumped sharply, signaling stronger input-cost pressure, while employment and new orders softened. Services looked weaker. The S&P Global Services PMI fell back into contraction territory, and the composite PMI slowed close to stagnation. Inventory data also suggested caution, with business inventories falling and retail inventory growth remaining subdued.
Forward-looking growth indicators softened during the week. The Atlanta Fed GDPNow estimate for Q1 was revised lower to 1.6%, JOLTS job openings declined, and ADP employment remained modest. Initial jobless claims stayed low, showing layoffs were still contained, but continuing claims rose, suggesting re-employment conditions were less strong. Externally, the trade deficit narrowed somewhat, though the goods deficit widened. In energy, crude inventories rose sharply, refinery activity eased, and supply conditions stayed active, but balances across the energy complex were still uneven.
Overall, the week’s data pointed to a U.S. economy that is still growing, but unevenly. Consumption and manufacturing remained supportive, and layoffs were low, but services weakened, housing stayed soft, wage growth cooled, and real-time growth tracking deteriorated. The broad message was resilience on the surface, softness underneath—enough to keep the Fed cautious, but not enough to confirm a clean re-acceleration.
U.S. Economic Outlook — Week Ahead
The week ahead for the U.S. economy is shaping up as a high-stakes inflation and policy week, not simply a test of whether growth is slowing. The starting point is a mixed macro backdrop. On the positive side, March Payrolls rebounded by 178,000, unemployment fell to 4.3%, February retail sales rose 0.6%, and consumer confidence improved to 91.8. But underneath those stronger headline numbers, the picture is less clear: job openings and hiring have softened, and the Atlanta Fed’s GDPNow estimate for Q1 growth was marked down to 1.6% by April 2. That leaves markets facing a difficult combination of still-resilient demand and rising inflation pressure from energy and supply chains.
The main question for markets is whether inflation is re-accelerating enough to keep the Federal Reserve firmly on hold. The Fed left rates unchanged at 3.50%–3.75% on March 18, and next week’s FOMC minutes on Wednesday, April 8, should help investors judge how worried policymakers were even before the latest oil shock intensified. With gasoline prices already elevated and OPEC+ meeting on Sunday, April 5, markets may begin the week with another oil-driven adjustment in future and inflation expectations.
The weekly calendar is dense and market sensitive. On Monday, the ISM Services PMI will show whether the largest part of the U.S. economy is still expanding strongly and whether cost pressures are spreading beyond manufacturing. On Tuesday, the focus shifts to Consumer Credit, the EIA Short-Term Energy Outlook, comments from Fed Vice Chair Philip Jefferson, Delta’s earnings, and the 3-year Treasury auction combination that ties together consumers, oil, policy, and rates. On Wednesday, the FOMC minutes, oil inventories, business formation data, and the 10-year Treasury auction make for the busiest cross-asset day of the week. Thursday brings jobless claims, the 30-year bond auction, and the delayed Personal Income and Spending report for February, with spending expected to stay firm in nominal terms but partly because of higher prices.
The key event is Friday’s March CPI report. We expect headline CPI to rise around 1.0% month over month, lifting annual inflation to 3.4%, with gasoline accounting for much of the increase. Core inflation is expected to remain sticky rather than collapse. The implication is clear: if CPI is hot and oil remains elevated, markets may further reduce rate-cut expectations, pushing yields and the dollar higher while keeping pressure on equities. If inflation is softer and oil stabilizes, markets could shift back toward a more balanced Fed outlook. Overall, the week ahead is likely to be dominated by oil, CPI, and Fed expectations.
USD and Wall Street in the week ahead. The map is clear.
The week-ahead macro view is modestly bullish for the U.S. dollar and cautious-to-selective for Wall Street. The key reason is that the U.S. enters the week with a relatively firm economic backdrop, while the inflation outlook has worsened because of higher oil and gasoline prices. That mix is pushing markets to expect a more patient Federal Reserve, with fewer near-term hopes for rate cuts.
For the USD, the fundamental backdrop remains supportive unless inflation and activity data cool meaningfully. Stronger labor data reduced pressure on the Fed to ease quickly, while manufacturing data still points to sticky price pressure. Higher oil prices also reinforce inflation concerns, which can keep U.S. yields relatively firm and support the dollar against peers.
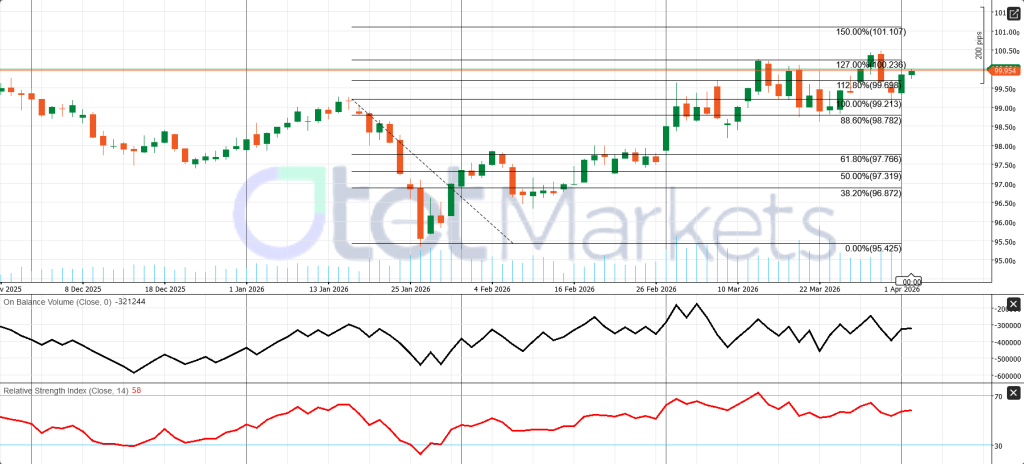
Technically, the dollar’s daily structure is still mildly bullish. It has been printing higher highs and higher lows since the late-January bottom, and price is now testing the important 99.95–100.24 resistance zone. A break above that area could open the way toward 101.10, while support stands around 99.70, 99.21, and 98.78. RSI near 58 shows positive momentum without signaling overbought conditions, and OBV has improved, although not with a strong breakout yet.
For Wall Street, the picture is less straightforward. The U.S. economy is still resilient enough to support earnings, and expected Q1 earnings growth of 14.4% provides some cushion. However, equities are not trading mainly on growth optimism right now. Instead, they are being driven by oil, inflation, and interest-rate expectations. That makes the market more fragile and selective rather than supportive of a broad-based rally.
The main external driver remains oil and the Persian Gulf situation. Higher crude prices are positive for the dollar through inflation and yields, but negative for equities because they squeeze corporate margins and consumer purchasing power. In short, the dollar currently has the cleaner macro setup, while Wall Street needs either cooler CPI or cooler oil—ideally both—to sustain a stronger and broader rebound.
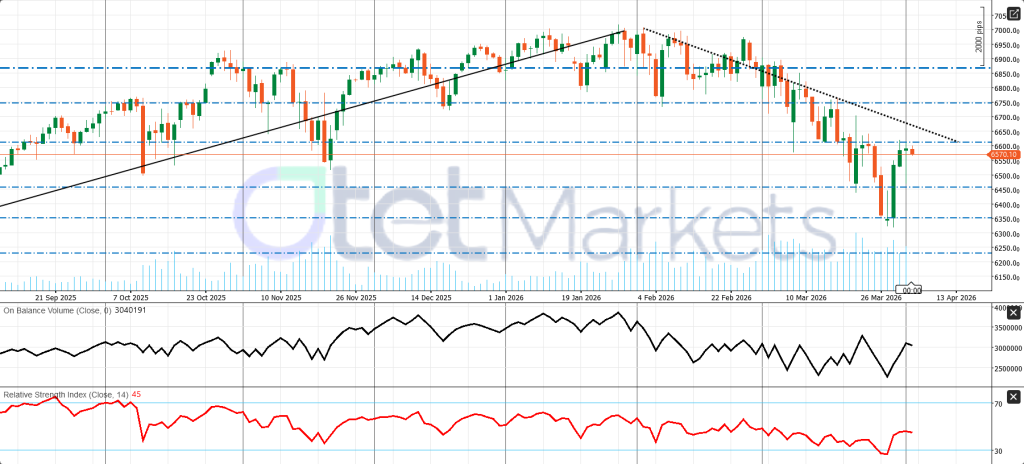
The S&P 500 daily chart is still fragile. The rebound is improving, but price remains below key trendlines, so it still looks like a bounce inside a correction, not a confirmed reversal.
- Resistance: 6600–6625, then 6750
- Support: 6450, then 6350
- Bias: cautious to bearish unless price breaks above 6625
RSI has improved but is still below neutral, and OBV shows recovery without strong accumulation confirmation.
Reserve Bank of New Zealand Meeting in the Week Ahead: Hold Likely, but the Signal Has Turned More Complex
The Reserve Bank of New Zealand is expected to leave the Official Cash Rate unchanged at 2.25% at its Wednesday, April 8 meeting. Although this is only an April Monetary Policy Review rather than a full Monetary Policy Statement, the meeting still matters because the RBNZ has already signaled it will provide expanded communication, including a media conference. That suggests policymakers understand markets want more guidance than usual after the recent oil shock.
The policy backdrop has become more difficult since the RBNZ’s February meeting. At that time, the bank also held rates steady and still appeared broadly comfortable with an accommodative stance, believing inflation would gradually return lower and the recovery, while fragile, was improving. Even then, the easing cycle already looked close to finished, but there was no urgency to tighten. Since then, however, the Middle East oil shock has complicated the picture and made a somewhat firmer tone more reasonable.
The main challenge now is the familiar inflation versus growth trade-off. Governor Anna Breman has said the RBNZ can generally look through a temporary rise in energy costs, but could react if inflation pressures become more persistent. That matters because fuel prices have risen sharply, and petrol and diesel make up about 4% of New Zealand’s CPI basket. At the same time, inflation is already slightly uncomfortable: annual CPI was 3.1% in the December 2025 quarter, above the top of the RBNZ’s 1%–3% target range, and inflation expectations have also moved higher. These numbers do not yet point to a loss of control, but they do increase the bank’s sensitivity to further price pressure.
Against that, the growth side of the economy remains weak. Q4 2025 GDP rose only 0.2% quarter on quarter, below expectations, annual growth was just 1.3%, and unemployment stood at 5.4%. That means the RBNZ does not have a strong case for tightening aggressively, even if inflation risks have increased.
The most likely outcome is therefore a hold with a watchful, slightly firmer tone. The bank is unlikely to signal imminent hikes, but it is also unlikely to preserve any clear easing bias. Markets should focus less on the rate itself and more on whether the RBNZ emphasizes vigilance, second-round inflation effects, and persistence, or instead leans more heavily on soft growth and spare capacity.
NZD/USD Daily Chart — Technical View
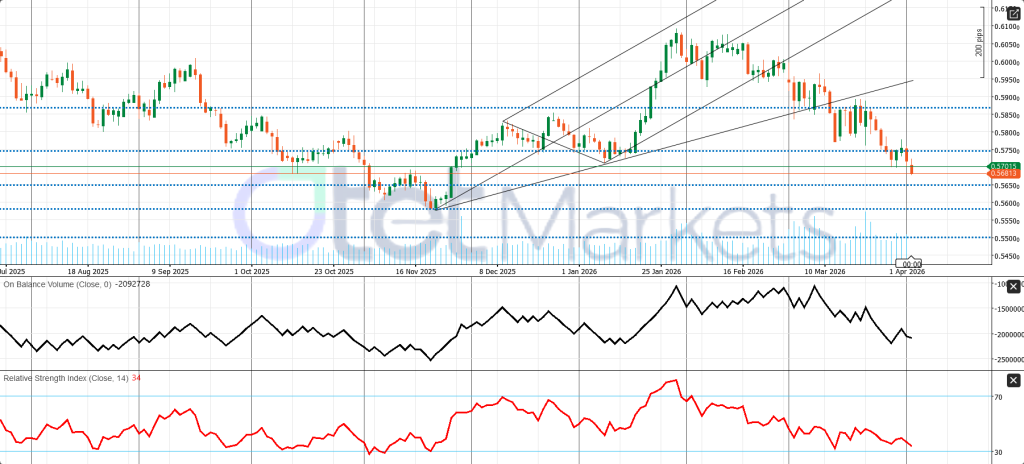
The chart has a bearish daily basis. Price has broken below the 0.5700–0.5750 support zone and is now trading around 0.5680, showing the earlier uptrend has faded into a corrective/downward phase.
- Support: 0.5650, then 0.5590–0.5560
- Resistance: 0.5700–0.5715, then 0.5750
- Bias: bearish unless price closes back above 0.5750
RSI near 34 shows weak momentum and near-oversold conditions, while OBV is still falling, confirming weaker buying pressure.
Gold’s current market condition and Weekly Outlook!
Gold enters the new week in a two-way macro environment, caught between safe-haven demand and a less supportive U.S. rates and dollar backdrop. In other words, it is not a clean trend. Geopolitical tension is still providing support, but stronger oil prices, firmer Treasury yields, and a stronger dollar are limiting gold’s upside. Spot gold rose sharply early in the week and reached $4,784.22/oz on April 1, helped by a softer dollar and hopes of de-escalation, but that rebound faded as the dollar strengthened again and overall risk sentiment worsened.
The main pressure on gold comes from the inflation channel. The Iran war and the continued disruption in the Strait of Hormuz pushed energy prices sharply higher, with Brent at $109.03 and WTI at $111.54 on April 2. Higher oil matters because it lifts inflation expectations and reduces the chance of quick Federal Reserve easing. That, in turn, supports the dollar and bond yields, raising the opportunity cost of holding a non-yielding asset like gold. The pressure intensified after the U.S. jobs report showed 178,000 payroll gains, a drop in unemployment to 4.3%, a firmer 10-year yield at 4.32%, and the dollar index near 100.08. This leaves gold in what can best be described as volatile consolidation with a slight macro headwind.
For the week ahead, the most important drivers are not gold-specific developments but the Fed and inflation calendar. The key events are the FOMC minutes, Core PCE, and March CPI. These releases matter because they will shape expectations about whether the Fed needs to remain restrictive for longer. Oil is the second major driver. While OPEC+ may consider another output increase, this may not materially calm the market as long as Hormuz remains disrupted. As a result, the outlook for gold is neutral to slightly bearish, with very high headline sensitivity. Gold could still rally if CPI is softer, the dollar weakens, or oil pressure eases, but it would likely struggle if CPI were hot and yields continue rising.
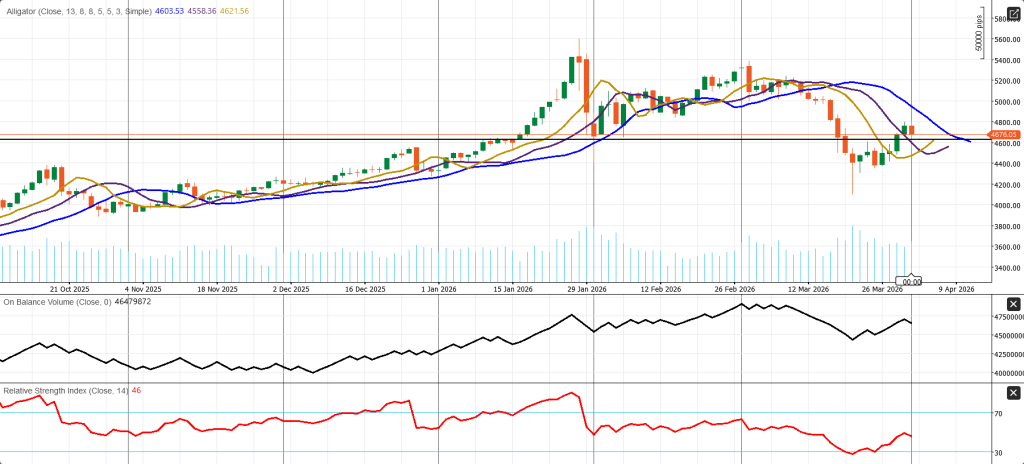
Technically, gold is attempting to stabilize after a sharp correction, but the structure is still fragile rather than clearly bullish. Price has moved back above the Alligator lines, which is an early sign of improvement, yet the rebound still looks more like a bounce inside a damaged structure than a confirmed new uptrend. The key resistance zone is 4675–4700; a break above it could open the way toward 4800 and then 5000. On the downside, 4620–4600 is the first support area, followed by 4555 and then 4400–4320. Momentum has improved, but not decisively: RSI near 46 is still below neutral, and OBV has bounced without confirming strong accumulation.
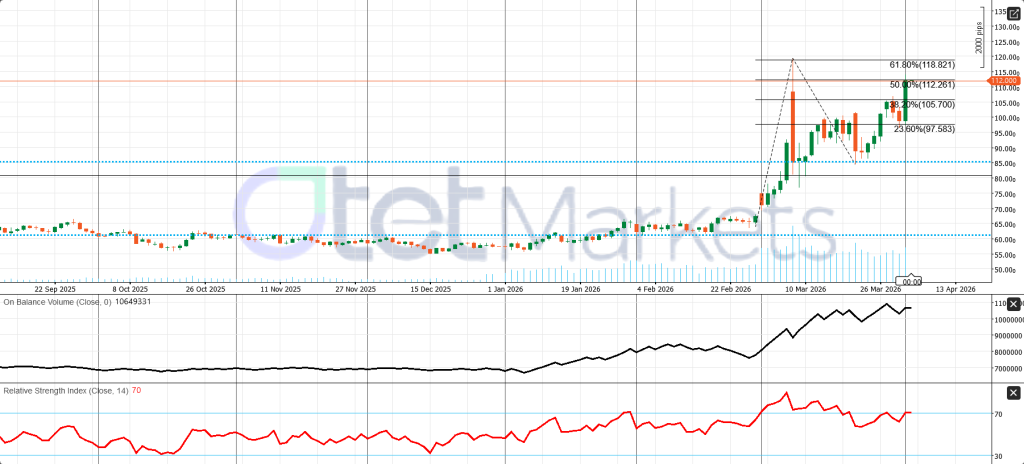
Crude Oil: Current Market Condition and Week-Ahead Outlook
Crude oil enters the week ahead in a war-risk market, not a normal macro-driven one. Prices remain elevated because the dominant issue is not ordinary demand strength but the ongoing disruption in the Strait of Hormuz. Brent closed at $109.03 and WTI at $111.54 on April 2, while front-month WTI traded at an unusually large premium to both later-dated contracts and Brent, signaling acute near-term physical tightness. Reuters’ March survey also showed OPEC output fell sharply to 21.57 million bpd, the lowest since mid-2020, because the war and shipping disruption forced export cuts across major Persian Gulf producers. This means the market is still being driven primarily by supply insecurity rather than optimism about global growth.
The first major event for the week is the OPEC+ meeting on Sunday, April 5. The group had already approved a 206,000-bpd production adjustment for April and is now expected to discuss another increase for May. However, even if OPEC+ agrees to raise output further, the market may see that as mostly symbolic unless those barrels can actually be exported. Spare capacity matters only if supply can move, and the real bottleneck remains Hormuz and regional shipping risk. As a result, the market is likely to keep reacting more to military headlines, shipping insurance conditions, and transit security than to modest changes in OPEC+ production quotas.
For the April 6–11 week itself, the most important monthly oil-market report is the EIA Short-Term Energy Outlook on April 7. The OPEC Monthly Oil Market Report and the IEA April Oil Market Report arrive just after the week, on April 13 and 14. That makes the EIA report especially important because its previous assumptions already look outdated. In March, the EIA expected shut-in production to peak in early April and forecast Brent averaging $91 in Q2 2026, but spot prices are already well above that. Tuesday’s update will therefore be closely watched for any upward revision to near-term prices or tighter supply assumptions.
The base case for the week is elevated, volatile, headline-driven oil, with upside spikes more likely than a clean selloff unless there is credible progress on Hormuz. The three key layers are: Sunday’s OPEC+ signal, Tuesday’s EIA forecast update, and whether shipping conditions in the Strait improve. Technically, WTI still looks strong. The broader trend remains bullish above the 105–106 zone, with price testing the 112.26 Fibonacci area. A move above could reopen the path toward 118.82 and 120, while only a break below support would begin to weaken the bullish structure. Momentum indicators, including RSI near 70 and firm OBV, still support the underlying uptrend, though they also warn that volatility remains high.
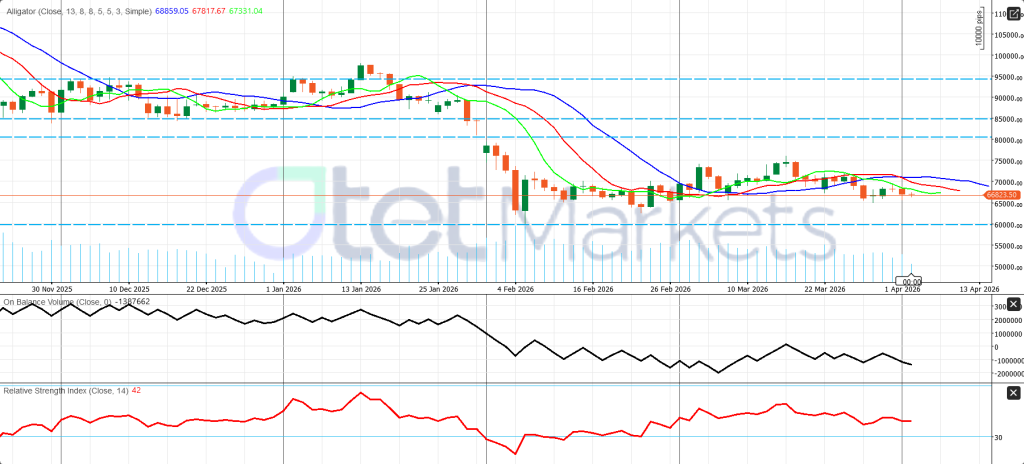
Current crypto market condition and BTC Weekly Outlook
The crypto market is entering the week in a cautious, range-bound, and macro-driven state. Bitcoin is trading around $66,983 and Ethereum near $2,053.73, with both assets behaving more like high-beta risk assets than safe havens. The recent escalation in the Iran war has strengthened the U.S. dollar and weakened broader risk appetite, which has weighed on crypto as well. At the same time, the flow picture has softened. Digital-asset investment products recorded their first outflows in five weeks, totaling $414 million, including $194 million of bitcoin outflows. U.S. spot bitcoin ETF flows have also turned more uneven, shifting from solid inflows at the end of March to a sharp outflow on April 1, then only a small rebound on April 2. This does not suggest capitulation, but it does show that institutional demand is becoming more selective and less aggressively trend-following.
One important structural development is Circle’s launch of cirBTC, a new 1:1 Bitcoin-backed wrapped token starting on Ethereum. This move pushes Circle beyond stable coins such as USDC and EURC and into the tokenized bitcoin market, where it will compete with products like WBTC. Circle is targeting institutional users such as OTC desks, market makers, and lending platforms, while presenting cirBTC as a secure and neutral way for bitcoin holders to access DeFi lending, borrowing, and liquidity provision. Circle also plans to expand cirBTC to its Arc Layer-1 blockchain and Circle Mint, suggesting a broader strategy to connect traditional finance, centralized crypto infrastructure, and decentralized finance. While BTC itself has dipped slightly, cirBTC could become a bullish long-term infrastructure development by increasing Bitcoin’s utility and institutional adoption over time.
For the week ahead, the outlook for Bitcoin is driven more by macro events than crypto-specific news. The key dates are OPEC+ on April 5, ISM Services on April 6, FOMC minutes on April 8, and U.S. CPI on April 10. The central market debate is whether slowing growth will eventually push the Fed toward cuts, or whether sticky inflation—possibly reinforced by higher oil prices and tariffs—will keep the Fed patient. That uncertainty is one of the main reasons bitcoins remains volatile and indecisive. The base case is neutral to slightly cautious for BTC, with high event-driven volatility. If oil stays high, CPI runs hot, and the Fed sounds patient or hawkish, BTC may struggle as the dollar stays firm. If inflation softens, geopolitical stress eases, and ETF flows stabilize, BTC could recover with the rest of the risk complex.
Technically, BTC/USD still looks fragile on the daily chart. After breaking down from the 90k–95k zone in early February, bitcoin has shifted into a lower trading range and is now trading around 66.8k, below all three Alligator lines. That suggests a weak trend phase rather than a confirmed recovery. Price action between 66k and 70k looks more like consolidation after a breakdown than the start of a new bullish leg. RSI near 42 remains below neutral, and OBV is still negative, showing that momentum and accumulation are not yet convincing. The key support zone is 65k–66k, followed by 60k, while resistance stands at 67.3k–68.9k, then 70k–72k and 75k. In short, bitcoin is still in a fragile structure: above 68.9k it may stabilize, but below 65k downside pressure could deepen again.
Share
Hot topics

What is Balance in Forex? A Complete Guide for Traders
Introduction When you open a trading account for the first time, one of the first numbers you see on your screen is your balance. It looks simple. It looks clear....
Read more


Submit comment
Your email address will not be published. Required fields are marked *