
War, Oil, and Data: A High-Stakes Week for Global Markets
Global markets will stay focused on the war in the Persian Gulf as disrupted energy exports continue to drive oil, currencies, bonds, and risk sentiment. In the United States, investors will watch S&P Global PMI, University of Michigan consumer confidence, and regional Fed surveys for signals on growth and business conditions. Flash PMIs across the Euro Area, UK, Japan, Australia, and India will offer a snapshot of global momentum under geopolitical strain. Germany and Euro Area confidence surveys, inflation reports from Japan, the UK, Australia, and Spain’s CPI, plus central bank decisions in Norway and Mexico, will shape the week.
US Economy Weekly Review: Resilient Activity, Sticky Inflation, and a More Fragile Soft Landing
The past week’s US data showed a mixed but still expansionary economy. Growth has not broken down, the labor market remains relatively firm, and some parts of manufacturing are holding up. But the broader message is that the economy is no longer moving through a clean disinflation path and is becoming more exposed to a slower-growth, higher-inflation mix, especially with oil and geopolitical risk back in focus.
The biggest takeaway was inflation. February PPI came in hot, with headline PPI up 0.7% MoM and 3.4% YoY, while core PPI rose 0.5% MoM and 3.9% YoY. Even narrower measures stayed firm, showing pipeline inflation is not fully under control and that business cost pressures remain meaningful. That makes it harder to assume inflation will keep easing smoothly.
That fed directly into the Fed’s message. The Fed left rates unchanged at 3.75%, as expected, but the tone remained cautious. Policymakers signaled that higher energy prices and the Iran war shock could complicate the inflation outlook. So this was a hold, but not a clearly dovish one. The market was left with the sense that the Fed wants flexibility, but has less room to ease quickly if inflation expectations rise again.
On growth, there were still signs of resilience. Industrial production and manufacturing output both rose 0.2% MoM, while capacity utilization held at 76.3%. The Philadelphia Fed index surprised to the upside at 18.1, with employment back in positive territory and capital spending improving. These figures suggest manufacturing is not collapsing and that some firms are still investing.
But the picture was not broad-based. The Empire State index slipped back to -0.20, the Leading Index stayed negative, and the Atlanta Fed GDPNow estimate for Q1 was cut to 2.3% from 2.7%. The labor market still looks solid, with low initial claims, but higher continuing claims point to gradual cooling. Consumer spending remains alive, yet housing is still fragile, with mortgage activity weak and new home sales falling sharply.
Energy and financial conditions added another layer of uncertainty. So what does this mean? The US economy remains resilient, but less comfortable. The soft-landing story is still alive, but it is becoming messier: inflation is sticky, the Fed cannot pivot easily, housing is soft, and growth is gradually slowing.
United States: Week Ahead Outlook
The U.S. economy enters the new week in a slower-but-still-expanding phase. Growth has cooled meaningfully from the stronger pace seen earlier, and momentum was already fading before the latest geopolitical shock added new uncertainty through higher energy prices and renewed inflation concerns. The US–Israel–Iran conflict is therefore likely to remain the main driver of market sentiment this week, influencing both inflation expectations and broader risk appetite. On the domestic calendar, there is no single blockbuster release, but several reports will help markets judge whether the economy is still soft-landing or becoming more vulnerable. The main releases include the flash S&P Global PMI for March, February import and export prices, Q4 productivity and labor costs revisions, the current account balance, construction spending, regional manufacturing surveys, and the final University of Michigan consumer sentiment reading.
For the week ahead, the macro story is less about one event and more about whether incoming data confirm three broad themes. First, growth is moderating but not collapsing. Second, inflation risks are starting to re-emerge through imported cost pressure and higher oil prices. Third, the Federal Reserve remains cautious after its March meeting and is unlikely to shift quickly unless the data move decisively in one direction.
The most important economic data and market expectations
1) Flash U.S. PMI — Tuesday, March 24
The first major market-moving release is the S&P Global flash PMI. February data showed U.S. activity remained in expansion territory, but momentum softened, with both manufacturing and services easing while staying above 50. For March, the key issue is not simply whether the indexes remain in expansion, but whether business activity shows renewed resilience or further cooling. A firmer PMI would support the idea that growth is slowing only gradually. A weaker result would reinforce concerns that the economy is losing momentum more quickly than expected.
2) Productivity and Costs (Q4 revised) — Tuesday, March 24
The revised Q4 productivity report matters because the Fed is still assessing whether wage pressures can cool without keeping inflation sticky. If productivity remains solid, it can help offset rising labor costs and reduce inflation pressure. If it weakens, the inflation mix becomes more uncomfortable. Expectations are for nonfarm productivity and unit labor costs to remain broadly unchanged, which would support the view that the labor market is still relatively resilient despite some softer recent signals.
3) Import and Export Prices for February — Wednesday, March 25
This is one of the most important inflation-related releases of the week. Markets expect both import and export prices to rise modestly, but in the current environment even small upside surprises would matter. Investors want to know whether external price pressures are beginning to broaden, especially as energy markets remain sensitive to geopolitical developments. A firmer-than-expected import price reading would strengthen the view that headline disinflation could stall.
The most important events to watch
Fed speakers between March 24 and March 26 are the main policy events of the week. Michael Barr, Philip Jefferson, and Lisa Cook are all scheduled to speak, and Jefferson’s remarks are especially important because they explicitly address the economic outlook and energy effects. Markets will be listening for three signals: whether officials treat the oil shock as temporary, whether they worry about second-round inflation effects, and whether they sound more concerned about slower growth or persistent prices. The Fed’s calendar also includes the Senior Credit Officer Opinion Survey on Dealer Financing Terms, which could offer insight into whether tighter financial conditions are already doing part of the central bank’s job.
Traders’ Note
For U.S. markets, this week is mainly about whether the data preserve the “Fed on hold, growth slowing, inflation sticky” narrative. If PMIs and import prices both come in firm, Treasury yields and the dollar could strengthen further. If business surveys soften while price data stay contained, markets may return to a more dovish medium-term interpretation. The practical watchpoints are PMI price components, import prices, and Fed messaging on energy pass-through.
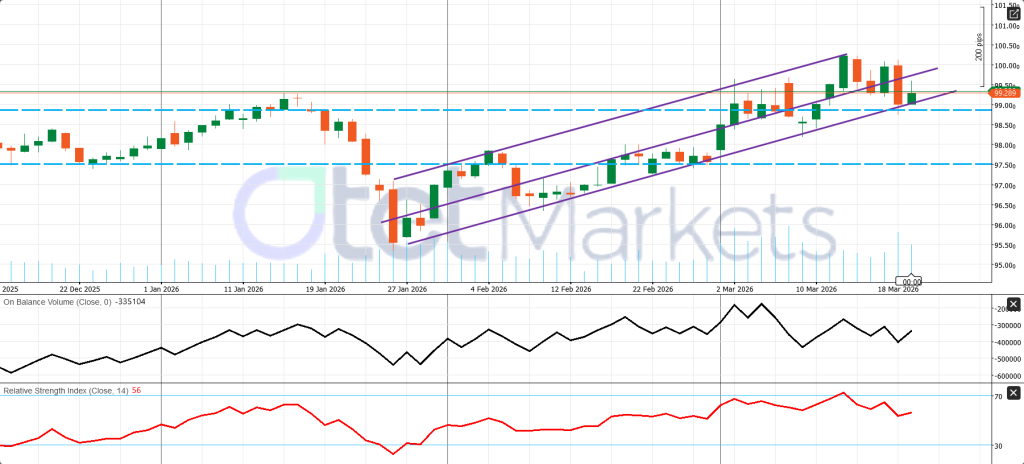
USD Index (DXY) – Daily Technical View
The daily structure remains mildly bullish, with price still moving inside a rising channel, though momentum has cooled after the recent push toward the upper boundary. As long as DXY holds above 99.00, the short-term uptrend remains intact and another move toward 100.00–100.30 stays possible. A break below 99.00 would weaken the setup and expose 98.50, then possibly 97.50. RSI remains positive but no longer overbought, while OBV suggests the rebound has lost some conviction.
S&P 500 – Daily Technical View
The short-term trend remains bearish after the index lost its earlier uptrend structure. Price continues to show lower highs and lower lows, and rebound attempts have stayed capped below the descending trendline. The break below 6600 leaves the market vulnerable near the 6500–6540 support area. As long as price remains below 6600–6710, downside pressure dominates. A clean break under 6500 would expose 6420 next. RSI is approaching oversold territory, but OBV still points to weak buying conviction.

UK Economy Weekly Review:
The UK economy ended the past week with a mixed but still relatively stable picture. The labour market held up better than expected, housing showed a modest monthly rebound, and industrial orders improved slightly. But beneath that, domestic momentum remained soft, wage pressure continued to ease, and the Bank of England still showed little urgency to cut rates. Combined with weaker public finances and higher gilt yields, the overall message is that the economy is not breaking, but it is not strong enough to support hopes for a rapid easing cycle.
The most important signal came from the Bank of England. The BoE left rates unchanged at 3.75%, as expected, but the key surprise was the vote split: all nine MPC members backed no change, with no votes for a cut. Markets had expected at least some support for easing, so this unanimous decision sent a hawkish message. It suggests policymakers still see inflation risks as serious enough to justify patience and do not yet feel comfortable opening the door to near-term rate cuts.
That view fits the wage data. The labour market remains resilient, but pay growth is moving in a more favorable direction from the BoE’s perspective. Average earnings including bonuses slowed to 3.9% from 4.2%, while earnings excluding bonuses eased to 3.8% from 4.1%. That helps reduce inflation pressure, especially in services, but it is still not weak enough to convince the BoE that immediate cuts are appropriate.
At the same time, the labour market itself did not look weak. The unemployment rate held at 5.2%, slightly better than expected, and employment rose by 84K, well above forecasts. However, the claimant count also increased sharply, showing some underlying pressure in hiring conditions. So the labour market looks more like it is cooling gradually than re-accelerating.
Housing also sent a mixed signal, with monthly prices rising but annual growth still negative. Industry improved slightly, but demand remains weak. Fiscal data were less encouraging, as borrowing came in above expectations and gilt yields rose sharply, keeping financial conditions tight.
Bottom line: the UK economy looks resilient, but still too soft for comfort and too inflation-prone for easy rate cuts. The BoE’s unanimous hold was the clearest message of the week: policy is likely to stay restrictive for longer than markets had hoped.
United Kingdom: Week Ahead Outlook
Overall economic outlook
The UK enters the week with a more complicated backdrop than the U.S. Activity has improved modestly, but the inflation outlook has become more fragile again after the Middle East shock. The Bank of England kept Bank Rate at 3.75% on March 19, and unlike February’s split decision, the March meeting ended with a unanimous hold as policymakers assess the scale and duration of the conflict and its effect on energy prices and inflation.
That unanimity should not be seen as dovish. The minutes suggest that a longer-lasting shock could require a more restrictive stance, especially if higher energy prices feed into wages and broader price-setting. At the same time, the BoE also recognizes that weaker demand and squeezed real incomes could create more spare capacity and raise unemployment. In other words, the UK now faces a clearer stagflation-style trade-off than it did only a few weeks ago.
The growth backdrop remains soft. ONS data showed GDP rose just 0.1% in the three months to December 2025, meaning the economy was already fragile before the latest energy shock. The BoE had expected CPI to return close to target by Q2 2026, but that path now looks less certain after the recent repricing in energy markets.
The most important economic data and market expectations
The bias for the week ahead is caution rather than optimism. The CBI distributive trades survey showed a sharp drop in February retail sales volumes, although expectations for March improved somewhat. That leaves the official February retail sales report carrying meaningful downside risk.
1) Flash UK PMI — Tuesday, March 24
This is the key UK release of the week. February data were constructive, with the composite PMI at 53.7, services at 53.9, and manufacturing still slightly above expansion at 51.7. The main question now is whether March activity can hold up despite the energy shock and rising uncertainty.
2) Consumer and Producer Inflation — Wednesday, March 25
The final February CPI and PPI data are due Wednesday. January inflation eased to 3.0% year-on-year, which was encouraging, but markets may treat these figures as backward-looking given the fast-changing geopolitical and energy backdrop.
3) Retail Sales for February — Friday, March 27
January retail sales rose 1.8% MoM, surprising to the upside. The key issue now is whether that gain was temporary or the start of firmer consumer demand.
Traders’ Note
This week will test whether the UK still looks like a slow-growth economy in expansion mode or is slipping toward softer growth. That distinction will shape gilt yields, sterling, and BoE expectations.
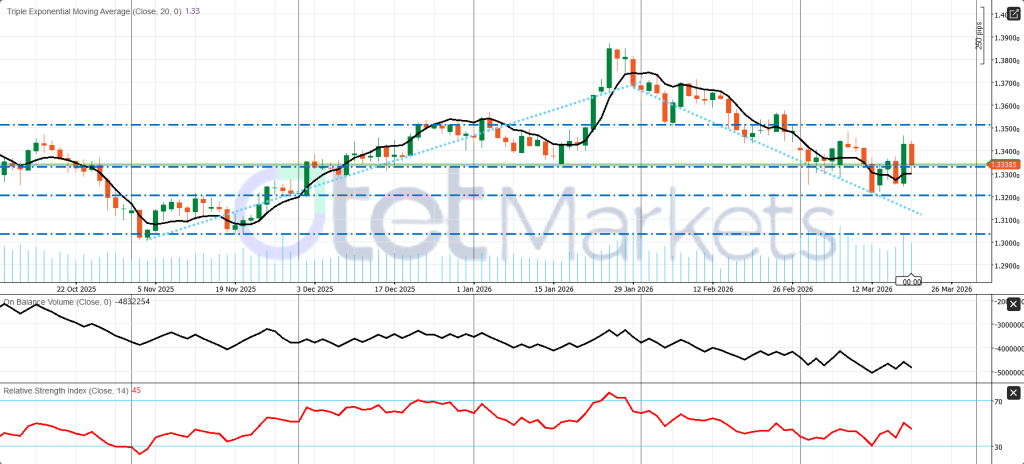
GBP/USD – Daily Technical View
The daily bias is neutral to slightly bearish. Price is near 1.3340, close to an important pivot zone, but the rebound still looks corrective rather than a clear bullish reversal. TEMA suggests limited trend conviction, RSI near 45 shows soft momentum, and OBV remains weak.
Key technical levels to watch:
Resistance: 1.3350, then 1.3500
Support: 1.3200, then 1.3050
If GBP/USD stays below 1.3350–1.3500, rallies may remain limited. A break above 1.3500 would improve the outlook, while a move below 1.3200 would expose 1.3050.
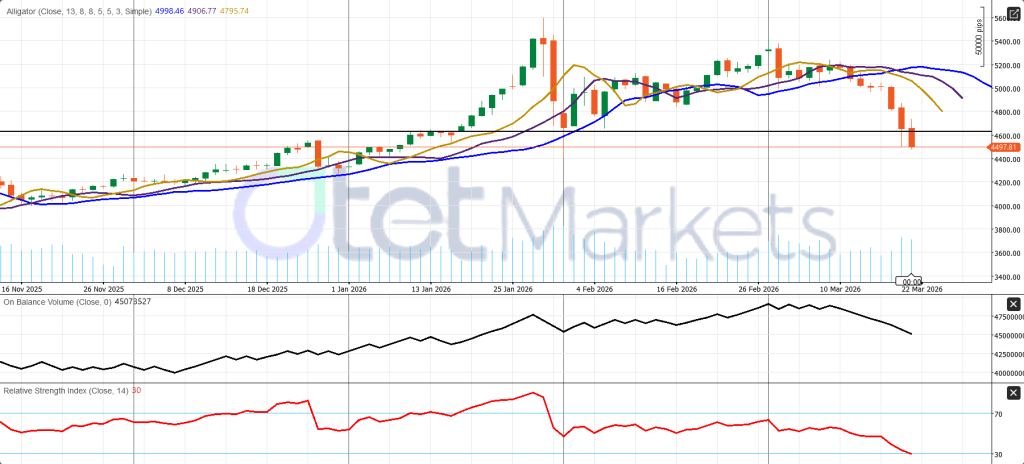
Gold Weekly Outlook: War Premium vs. Higher-for-Longer Rates
Gold enters the new week in a fragile short-term position. Despite the ongoing war in the Persian Gulf, bullion just posted its sharpest weekly setback since 2020, with April Comex gold settling near $4,574.90 and spot gold ending Friday slightly below the $4,500 area. The main message from last week was clear: a stronger U.S. dollar, firmer Treasury yields, and fading expectations for near-term Fed cuts outweighed the usual safe-haven support.
The macro backdrop remains difficult for gold. On March 18, the Federal Reserve kept rates unchanged at 3.50% to 3.75% and stressed that uncertainty around the outlook remains elevated, including the impact of developments in the Middle East. That leaves gold highly sensitive to anything that lifts U.S. real yields and the dollar, especially if markets continue to treat the oil shock mainly as an inflation problem rather than a recession signal.
An important point is that gold’s recent decline does not contradict geopolitical stress. Instead, it suggests gold is currently trading more like a reserve-flow asset than a classic fear hedge. Even though war, oil disruption, and volatility would normally support precious metals, gold and silver have weakened because key structural buyers, especially central banks and sovereign reserve managers, are not providing the same support as before.
The recent gold bull market was built on two major forces: long-term monetary debasement after 2008, which boosted demand for hard assets, and de-dollarisation after Russia’s reserves were frozen in 2022. That pushed countries such as China, Turkey, and Persian Gulf states to shift part of their reserves into gold. In that sense, gold became more than a safe haven; it became a strategic reserve asset.
The war in the Persian Gulf and disruption around Hormuz have now reversed some of those flows. Oil-exporting states depend on energy revenues to build reserves, so when those flows are disrupted, gold buying may slow or assets may even be liquidated. China faces a related challenge through weaker growth and smaller external surpluses. Silver has fallen even more because, beyond being a monetary metal, it is also closely tied to industrial demand.
What to expect?
The long-term case for gold still holds, but short-term price action is being driven more by liquidity, reserve flows, and sovereign balance-sheet pressure than by fear alone. This week, the key issue is whether markets keep focusing on inflation and rates or shift back toward safe-haven demand. The base case is for high volatility and two-way trading, not a clean rebound. Gold is oversold, so sharp relief bounces are possible, but a more durable recovery likely needs a softer dollar, lower yields, weaker U.S. data, or a deeper risk-off move. Technically, the trend remains bearish below 4600, with support at 4490–4500, then 4400 and 4300.
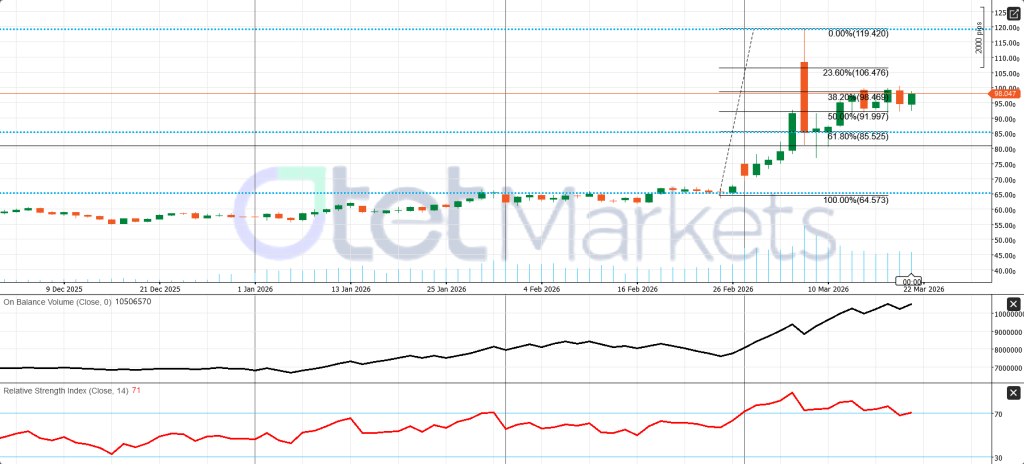
WTI Weekly Outlook: Supply Shock Still Dominates
The energy market is still trading as a war-driven supply shock, not a normal cyclical oil market. By Friday, Brent closed at $112.19 and WTI near $98.3, with prices reaching their highest levels in almost four years as the conflict intensified and Iraqi supply disruptions worsened. The main driver remains the Persian Gulf disruption: the Strait of Hormuz, which carries roughly 20% of global oil and LNG flows, has been severely affected, while Iraq has declared force majeure on foreign-operated oilfields and cut Basra production sharply after export stoppages. Broader Persian Gulf energy infrastructure has also come under attack.
There are some buffers, but they still look too small to fully offset the shock. The IEA announced a 400 million barrel emergency stock release, and U.S. officials signaled that further SPR releases remain possible. OPEC+ had already planned only a 206,000 bpd production increase for April before the war escalated, which is minor relative to the current disruption. At the same time, the U.S. has temporarily eased restrictions on some Iranian oil and reserves, while similar flexibility was also extended to Russian tanker reserves last week in an effort to contain prices.
The U.S. domestic backdrop is supportive for oil, though not enough on its own to explain the rally. EIA data showed crude inventories rose by 6.2 million barrels, but gasoline and distillate stocks fell, refinery utilization increased, and total product demand stayed firm. That suggests crude supply still exists, but refined-product balances are tightening, which matters more during a shock. U.S. shale is also unlikely to solve this quickly. Rig activity has improved only slightly, and producers remain disciplined on spending despite higher prices.
The world is now facing an unusually broad energy shock, one the IEA describes as worse than the 1973 oil embargo because it affects not only crude, but also gas, LNG, fuels, chemicals, and fertilizer inputs. Around 400 million barrels, or roughly four days of global supply, have been removed from the market, lifting costs across transport, power, heating, and industry. The gas side is especially severe, with major Persian Gulf gas facilities hit and LNG supply losses potentially lasting three to five years.
The bias remains bullish but highly volatile. As long as Hormuz traffic stays restricted and Persian Gulf outages continue, the path of least resistance is still higher, though WTI may lag Brent because the U.S. market is relatively better supplied. For the week ahead, the key things to watch are Hormuz shipping headlines, further Iraqi or Persian Gulf outages, emergency supply responses, and Wednesday’s EIA report.
WTI – Daily Technical View
WTI still looks like a bullish market in consolidation, not a confirmed reversal. Price is near 98.0, just below an important pivot around 98.5. RSI remains strong but near overbought, while OBV still supports the broader uptrend. Immediate resistance stands at 98.5 and 106.5. Support is at 92.0, then 85.5. As long as WTI holds above 92.0, the broader bullish structure remains intact.
Crypto Market Condition and BTC Weekly Outlook
Bitcoin enters the new week in a mixed but still fragile position. The market has recovered significantly from the early-February selloff, when BTC briefly fell toward $60,000, but it is still behaving more like a macro-sensitive risk asset than a clean, self-sustaining bull market. The recovery is real, yet conviction remains limited, and the broader tone still depends heavily on rates, yields, oil, and overall risk sentiment rather than on crypto-only momentum.
ETF flows and institutional support
Crypto ETFs have become a major source of support during the recent period of geopolitical stress. Since the start of the Iran-US conflict, total crypto ETF assets reportedly increased by around $12 billion, with total assets under management rising to roughly $140 billion. In the most recent week alone, crypto ETFs saw about $1.06 billion in inflows, marking the strongest weekly result since mid-January and the third straight week of positive flows. That shift suggests institutional investors are returning after a cautious period.
Recovery led by Bitcoin, Ethereum also helped
Most of the recent inflows were directed toward Bitcoin ETFs, which brought in roughly $793 million last week and about $2.2 billion over the past three weeks. That shows Bitcoin remains the main institutional entry point, especially around the $70,000 area. Ethereum ETFs also added support, with around $315 million in weekly inflows, though year-to-date demand for ETH products remains far more neutral. Overall, ETF demand is helping stabilize sentiment, but it has not yet created a strong breakoutenvironment.
The biggest issue remains macro conditions
The main challenge for BTC is still the macro backdrop. The Federal Reserve kept rates unchanged at 3.50%–3.75% on March 18 and stressed elevated uncertainty tied partly to Middle East developments. That matters because Bitcoin usually struggles when markets interpret higher oil prices and geopolitical stress as reasons for stickier inflation, firmer yields, and fewer rate cuts. In addition, one of Bitcoin’s medium-term bullish pillars, faster U.S. crypto legislation, has weakened, reducing a potential regulatory catalyst.
Weekly BTC outlook
The base case remains choppy, two-way trading with only a slight recovery bias if macro conditions calm. The bullish scenario would require softer U.S. data, lower yields, calmer oil, and a steadier dollar. The bearish case would come from stronger inflation signals, firmer yields, another rise in oil, or broader risk-off pressure. In that environment, the $70,000 area remains the key anchor for the market.
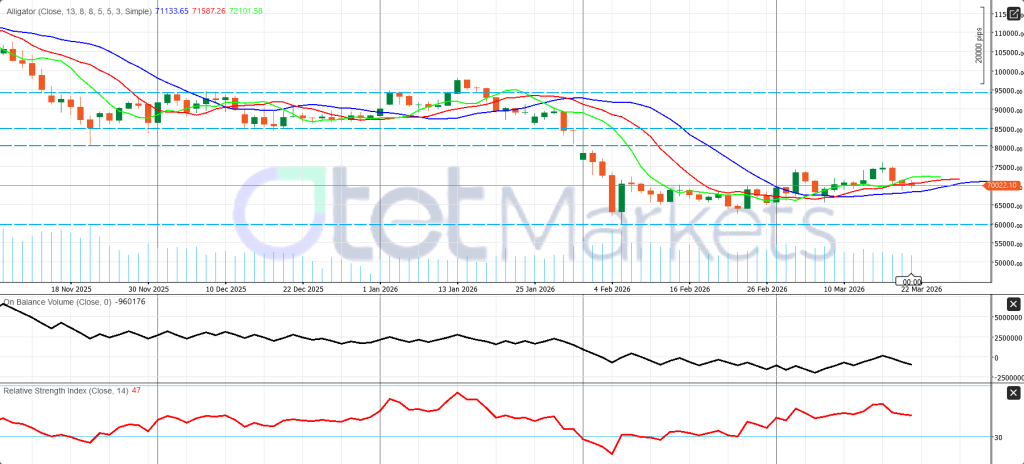
Bottom line and technical view
Bitcoin looks more stable than it did in early February, but it is still not trading with full confidence. Near term, BTC remains in a fragile recovery inside a macro-heavy range. Technically, price is trying to build a base above $70,000, but it still needs a stronger break above $72,000–$73,000 to improve sentiment. First support stands at $68,000–$70,000, while deeper weakness could reopen $64,000–$60,000.
Share
Hot topics

What Is a Forex PAMM Account? Complete Guide
Introduction If you’ve ever wanted to invest in Forex but had reservations about doing it alone, you’re not by yourself! Many people are interested in investing in the Forex market...
Read more


Submit comment
Your email address will not be published. Required fields are marked *