
Global Economy
The global economy ended the week weaker and more fragile, though not in recession. Middle East tensions and the fragile U.S.-Iran ceasefire dominated markets, driving oil, inflation expectations, currencies, and risk sentiment. Inflation remained the main concern: U.S. headline inflation stayed firm, Europe saw mixed signals, China remained soft on consumer prices, Japan faced firmer inflation and wages, and several emerging markets kept sticky inflation. Growth slowed across major economies without breaking down, leaving central banks cautious. Markets rebounded, but the recovery relied more on temporary geopolitical relief than on stronger economic fundamentals or an improvement in the global outlook.
USA
The U.S. economy showed a difficult underlying picture this week, with sharply slower growth, weaker household income, softer labor data, and deteriorating sentiment. Inflation did not reaccelerate, but it remained too firm for the Fed, while rising inflation expectations complicated policy. The backdrop now looks like slower growth with sticky inflation, not a soft landing. Markets improved on geopolitical relief, but the domestic macro picture still argues for caution overall.
U.S. Economy Weekly Review
The U.S. economy ended the week in a mixed but increasingly fragile position. The clearest message from the data was that growth is slowing, inflation remains sticky, and financial markets were lifted more by geopolitical relief than by any clear improvement in domestic fundamentals. A fragile U.S.-Iran ceasefire helped equities recover, reduced volatility, and weakened the dollar as safe-haven demand eased, but the underlying macro backdrop remained challenging.
On inflation, the picture was not cleanly dovish. March CPI showed that headline inflation stayed high, while core inflation was somewhat softer than expected. Headline CPI rose 0.9% month on month and 3.3% year on year, showing that price pressures remain uncomfortable. Core CPI was more reassuring at 0.2% month on month and 2.6% year on year, but that still did not provide the Fed with a convincing signal that inflation is returning smoothly to target. PCE data told a similar story, with core PCE still running at levels that are too firm for policymakers to feel comfortable. More importantly, inflation expectations rose sharply, with the University of Michigan’s 1-year expectation jumping to 4.8%. That increase made the policy outlook more difficult because even modestly softer inflation loses some value if households start to expect higher prices ahead.
On growth, the data softened clearly. Q4 GDP was revised down to just 0.5%, well below earlier readings, while consumer spending growth was also revised lower. The Atlanta Fed’s GDPNow estimate for Q1 remained positive at 1.3%, suggesting the economy is still expanding, but only modestly. Household data showed a similar pattern: personal spending remained positive, but personal income unexpectedly fell, and real earnings dropped sharply. That suggests consumers are still spending, but with less income support and a thinner cushion than before. Consumer surveys reinforced that weaker tone, with both Michigan sentiment and IBD/TIPP optimism falling significantly.
The labor market softened at the margin but did not break. Initial jobless claims rose, employment-related indicators weakened, and the ISM non-manufacturing employment index slipped into contraction territory. Still, continuing claims declined, showing that labor conditions remain resilient overall, even if cracks are becoming more visible. Business activity stayed in expansion, especially in services, but the quality of that expansion was mixed, with a sharp rise in services prices showing continued inflation pressure.
U.S. Economic Outlook for the Week Ahead | April 13–19
The U.S. outlook for the week of April 13–19, 2026 is less about getting a decisive new macro signal and more about confirming whether inflation is spreading further or whether growth is slowing enough to offset it. Two of the usual market-moving releases—March retail sales and housing starts/building permits, have been delayed, making this a lighter-than-usual mid-month week. As a result, investors will focus more heavily on PPI, import/export prices, regional Fed surveys, jobless claims, industrial production, the Beige Book, and Fed speakers. The overall tone remains cautious, with the base case still pointing to a wait-and-see Federal Reserve that is not ready to reopen a near-term rate-cut narrative.
The first major data point comes on Monday with March existing home sales. Housing remains important because it reflects how rising mortgage rates and weaker sentiment are affecting real activity. February sales were running at a 4.09 million annualized pace, but affordability pressures were already weighing on demand. Mortgage purchase applications had fallen sharply in February and only partially recovered in March, while pending sales showed only limited improvement. Since existing home sales reflect closings rather than new contracts, the March data will mostly capture conditions before the recent geopolitical shock and rate spike. Even so, the expectation is for softer reading, around 3.97 million, slightly below consensus.
The most important release of the week is likely Tuesday’s March PPI. After the hotter CPI print, markets want to know whether inflation pressure is now broadening more clearly into upstream prices. February PPI was already firm, rising 0.7% month on month and 3.4% year on year. Another strong report would reinforce the view that higher energy prices and supply-chain costs are feeding further into the economy, which could keep Treasury yields high and support the dollar.
Wednesday adds more texture, with import/export prices, the Empire State manufacturing survey, the NAHB housing index, and the Beige Book. These releases will help investors judge whether higher energy costs, uncertainty, and tighter financial conditions are putting greater pressure on business activity. The end of tax season also matters because Treasury cash flows and smaller-than-expected refunds could influence short-term funding conditions.
Thursday shifts attention to the growth side, with jobless claims, the Philadelphia Fed survey, and industrial production. Claims have risen modestly, suggesting labor is cooling gradually, while industrial production remains positive but soft. Friday lacks major data, but Fed Governor Waller’s speech could still move markets, especially ahead of the April 28–29 FOMC meeting.
USD and Wall Street
The U.S. dollar ended the week weaker, but not structurally weak. The Dollar Index fell to around 98.50, posting its largest weekly decline since January, as tentative Middle East ceasefire optimism reduced safe-haven demand and encouraged a shift toward risk-sensitive assets. However, the decline was limited. As doubts about the ceasefire resurfaced and disruptions in the Strait of Hormuz continued, the dollar stabilized. This suggests the market is not ready to abandon the dollar’s defensive role. Softer U.S. growth weighs on the currency, but sticky inflation and geopolitical risk still provide support. Technical Analysis
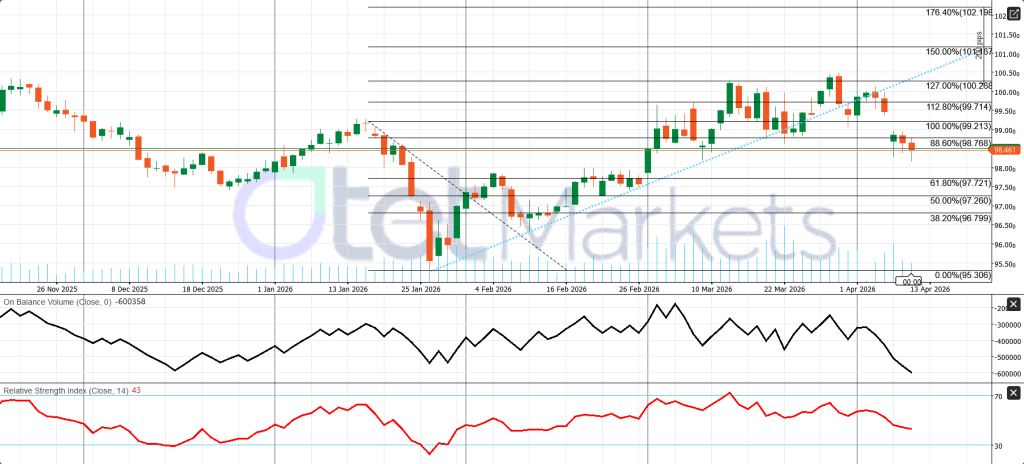
The daily chart of the U.S. Dollar Index shows that the rebound from the late-January low at 95.306 lost momentum after topping near the 127.0% Fibonacci level at 100.268. The latest move has pushed price down to around 98.461, below the rising trendline that had supported the advance from late January into early April. That trendline break weakens the prior bullish structure and shifts the short-term tone back to the downside.
The price has also slipped below the 88.6% Fibonacci level at 98.768, which now acts as the first resistance zone. Below that, the next key upside barriers are 99.213 and 99.714. On the downside, the chart points to 97.721 as the first meaningful support, followed by 96.799 if selling pressure extends.
Momentum indicators also lean bearish. The RSI is at 43, which places it below the neutral 50 area and suggests fading upside momentum. At the same time, On-Balance Volume is trending lower, signaling weaker buying participation and stronger distribution during the latest pullback. Taken together, the chart favors a cautious bearish view unless the index quickly reclaims the 98.768-99.213 resistance zone.
Wall Street had a strong week, but the rally was driven more by improving geopolitical sentiment than by better domestic macro data. The S&P 500 gained 3.6% on the week, the Dow rose 3.0%, and the Nasdaq advanced 4.7%, while the VIX fell to 19.23, signaling reduced near-term fear. The strongest gains came after ceasefire headlines eased immediate concerns of a wider regional war and an even larger oil shock. Technology and growth stocks led the move, supported further by strong earnings expectations, especially in semiconductors and large-cap tech. Reuters-based expectations for about 14% S&P 500 earnings growth and over 40% growth in the technology sector helped explain the resilience in growth-heavy indices. Still, late-week trading became more selective as markets reassessed the fragility of the ceasefire and the persistence of inflation pressure.
The broader conclusion is that both the dollar and equities remain highly sensitive to geopolitics. If diplomacy improves further, equities may continue higher and the dollar may stay softer. But renewed tensions could quickly reverse that pattern.
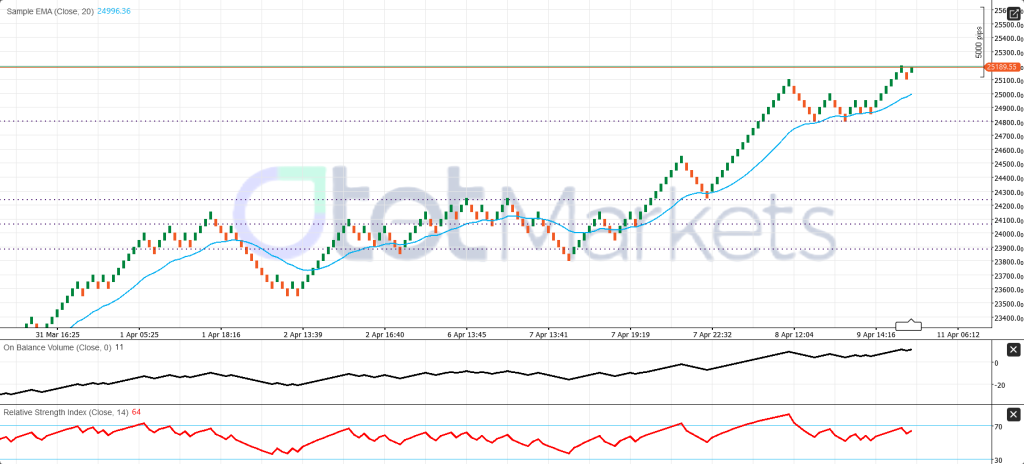
Technical Analysis – US100 Renko 500
daily US100 remains technically bullish, trading above its 20-period EMA and holding the medium-term uptrend. Momentum is positive, with RSI at 64 and rising On-Balance Volume showing continued buying interest. The index is now testing the key 25,190–25,200 resistance zone. A decisive break above that area would support further upside, while rejection there could trigger a short-term pullback toward 24,800. As long as price stays above 24,800 and the 20 EMA, the broader bullish bias remains intact, with 24,300 as the next important support below.
UK
The UK week ahead will focus mainly on Tuesday’s Bank of England speakers and Thursday’s February activity data. Markets are likely to see any February rebound as old news and stay focused on energy prices, BoE tone, and whether March’s slowdown becomes more persistent. Sterling and gilts should react most to GDP surprises and any hawkish shift from Bailey, Greene, or Mann, while the FTSE remains especially sensitive to oil and ceasefire headlines.
UK Economy Weekly Review
The UK economy ended the week in a fragile but still positive position. Growth did not collapse, but momentum softened clearly across several key areas. The overall picture is of an economy that remains technically in expansion, mainly because services are still slightly above the 50 thresholds, but one that is increasingly losing pace in household demand, housing, and other interest-rate-sensitive sectors. This is not yet a recessionary backdrop, but it is far from a durable recovery.
The most important signal came from the latest PMI data. The S&P Global Composite PMI fell to 50.3 from 53.7, while the Services PMI declined to 50.5 from 53.9. Both readings remained above 50, meaning the private sector is still expanding, but only narrowly. The sharp slowdown matters because it suggests the UK has moved from a relatively steady services-led expansion toward something much closer to stagnation. At the same time, Construction PMI improved to 45.6 from 44.5, beating expectations, but it still remained firmly below 50, confirming that construction is still in contraction. Together, these numbers show that the UK economy is still moving forward, but the quality of growth has deteriorated.
The housing market also lost momentum. The Halifax House Price Index fell 0.5% month on month in March, missing forecasts and reversing the prior increase. On a yearly basis, house prices rose 0.8%, but that was weaker than expected and below the previous reading. Mortgage rates edged slightly higher to 6.60%, keeping financing conditions restrictive. This reinforces the idea that housing remains under pressure from elevated borrowing costs, which is likely to weigh on turnover, household wealth effects, and consumer confidence.
Consumers remained cautious as well. The Thomson Reuters IPSOS PCSI fell to 43.3 from 46.0, showing a further deterioration in sentiment. Since the UK economy depends heavily on services and consumer activity, persistent weakness in confidence limits the chance of a strong rebound. One brighter area was the auto sector, where new passenger car registrations rose strongly and annual growth remained positive at 6.6%, showing that some pockets of demand are still holding up.
UK Economic Outlook for the Week Ahead
The UK enters the week of April 13–19, 2026 with the focus firmly on growth and Bank of England communication, rather than inflation. The key domestic release is Thursday’s February GDP package, which includes GDP, services, production, construction, and trade. Because labour-market data, CPI, and retail sales all arrive the following week, this Thursday report becomes the main test of whether the UK economy showed any resilience in February before March’s softer business surveys and the latest Middle East energy shock began to weigh more heavily.
The most important figure is the monthly GDP print. January GDP was flat, with services unchanged, production down 0.1%, and construction up 0.2%. Growth over the three months to January was only 0.2%, while Q4 2025 GDP rose just 0.1% quarter on quarter. The expectation for February is a modest 0.1% monthly increase, but even that would not materially change the broader picture of a sluggish economy. The growth mix is expected to remain uneven, with some support from industrial production and services, but offset by continued weakness in construction. In addition, the data predate the recent geopolitical escalation, so even a stronger-than-expected result may have limited influence on policymakers.
The Bank of England remains central to the week’s outlook. Andrew Bailey, Catherine Mann, and Megan Greene are all due to speak on Tuesday, and their remarks could move markets because policy is becoming harder to navigate. The BoE has kept Bank Rate at 3.75%, and the combination of weak growth, moderating inflation, a softer labour market, and contained wage pressures supports the case for staying on hold. At the same time, renewed Middle East tensions create upside inflation risk through energy prices, which complicates the policy outlook. This backdrop raises the risk of a more stagflation Ary environment for the UK if geopolitical pressure persists.
The broader macro picture is mixed but fragile. February CPI was 3.0% year on year, unemployment stood at 5.2%, regular pay growth was 3.8%, vacancies continued to decline, and retail sales had already fallen 0.4% month on month. Meanwhile, the March services and composite PMIs weakened sharply, while input costs rose at the fastest pace since 2021. This makes Thursday’s hard data especially important: if GDP disappoints, markets may conclude that UK momentum was already fading before the latest energy shock hit.
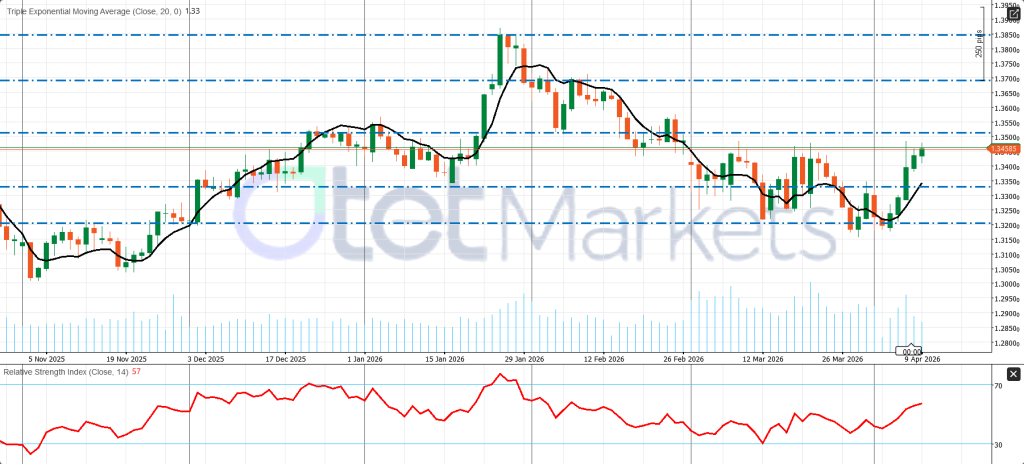
For sterling, the outlook is cautiously constructive but limited. GBP/USD has been supported by a weaker U.S. dollar and has recovered toward the 1.3450–1.3500 area, with technical indicators showing improving momentum. Still, upside may remain capped by the UK’s weak growth backdrop and the view that the BoE is less hawkish than some peers. GBP/USD is recovering from a base near 1.3200 and is now trading around 1.34585, above its rising 20-period TEMA, which signals improved short-term momentum. The pair has reclaimed 1.3350 support and is testing the 1.3450–1.3500 resistance zone. A break above 1.3500 would strengthen the bullish case and open the way toward 1.3550 and 1.3700. RSI at 57 and active volume support the rebound without showing overbought conditions. The near-term bias remains moderately bullish while price holds above 1.3350.
Gold market condition and Weekly Outlook
Gold’s market condition remains constructive, but highly sensitive to headlines. The metal is recovering from the sharp volatility seen in late March, yet it has not confirmed a full breakout. By Friday, April 10, spot gold had ended the week near $4,750/oz, after briefly rising to $4,789.67/oz on Thursday, leaving it almost 2% higher over the week. This performance suggests that buyers are gradually returning, helped by a softer U.S. dollar and easing worst-case fears after the fragile U.S.-Iran truce. However, geopolitical risk has not disappeared, and that keeps gold trading in a market shaped as much by headlines as by traditional macro data.
At the core, gold is being driven by two opposing forces. On the bullish side, the metal continues to benefit from a weaker dollar, ongoing Middle East uncertainty, and continued restrictions on the Strait of Hormuz, all of which help preserve safe-haven demand. In addition, central bank buying remains a major structural support. China’s central bank has extended its gold-buying streak, and reserve managers increasingly view geopolitics as the top risk to global reserve management. This helps explain why gold has stayed resilient even during periods when interest rates and the dollar should, in theory, have been stronger headwinds.
On the bearish side, the biggest limit on gold’s upside is the higher-for-longer U.S. rate backdrop. Inflation in the United States remains too firm, and that reduces the likelihood of early Federal Reserve easing. Since gold offers no yield, delayed rate cuts and elevated Treasury yields reduce its relative attractiveness. As a result, while the market has a supportive base, it lacks a clean monetary-policy tailwind.
The near-term outlook is therefore cautiously bullish, but choppy. Gold still has a firm macro floor because the ceasefire remains fragile, energy disruption risk remains present, and expectations for Fed cuts have shifted later, with many major institutions now looking for the first cut in September rather than June. This means gold’s support is no longer based on easy-policy optimism alone, but more on geopolitical stress and reserve diversification demand.
The next key upside battleground is the $5,000 area. For gold to break that level decisively, it likely needs either a renewed deterioration in geopolitics that lifts safe-haven demand, or a clearer decline in the dollar and Treasury yields that revive monetary-policy support. Without one of those, gold may continue rising, but probably in a slower, less aggressive manner.
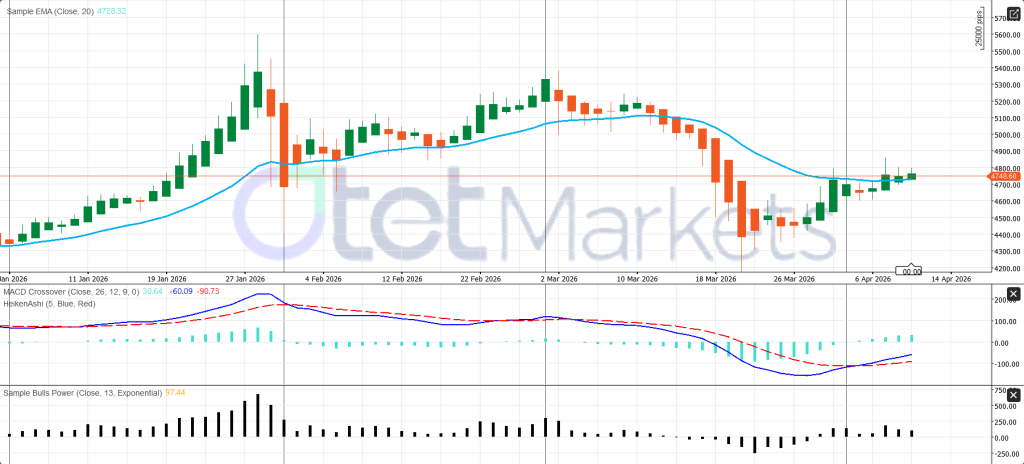
Technically, the market is improving. XAU/USD is trading above its 20-day EMA, momentum indicators such as MACD and Bulls Power have turned more supportive, and the pattern of higher lows suggests recovery is becoming more organized. Still, resistance at $4,780–$4,800 remains important. If gold stays above the EMA and holds support around $4,728 and $4,680–$4,700, the short-term bias remains cautiously positive.
Energy market conditions and WTI Weekly Outlook
Crude oil ended the week in a highly unusual position: futures corrected sharply, but physical supply conditions remained tight. Brent settled at $95.20, down 12.7% on the week, while WTI closed at $96.57, down 13.4%. On the surface, that looked like a strongly bearish move, reflecting the market’s rapid removal of a large part of the war premium after the U.S.-Iran ceasefire announcement. The decline reflected improved sentiment, not a full normalization of supply.
The key to the week was the divergence between the paper market and the physical market. Financial traders priced a lower probability of a worse-case regional war, but actual supply disruptions remained severe. Shipping through the Strait of Hormuz was still running at less than 10% of normal volumes, Saudi oil production capacity had been cut by around 600,000 barrels per day, and East-West Pipeline throughput had been reduced by around 700,000 barrels per day. Middle East producers had already shut in about 7.5 million bpd in March, with outages projected to rise to 9.1 million bpd in April. This explains why crude kept rebounding whenever negative geopolitical headlines returned.
U.S. inventory data added nuance rather than relief. API figures showed a 3.719-million-barrel crude build for the week ended April 4, smaller than the previous 10.263-million-barrel increase. EIA data similarly showed U.S. commercial crude stocks rising 3.1 million barrels to 464.7 million, about 2% above the five-year average. But distillate inventories fell 3.1 million barrels and remained 5% below the five-year average, while refinery utilization stayed high at 92%. In other words, U.S. crude availability was not critically tight, but refined-product balances, especially distillates, remained less comfortable.
Demand expectations also prevented a clean bearish interpretation. OPEC still sees global oil demand growth of about 1.4 million bpd in 2026, meaning the market cannot easily assume major demand destruction unless broader macro data weaken more clearly. Looking ahead, the coming week will be shaped by OPEC’s monthly report on April 13, the IEA’s report on April 14, U.S.-Iran diplomacy, Hormuz shipping conditions, U.S. PPI, EIA petroleum data, and broader macro releases such as the Beige Book and industrial production.
The base case for WTI is volatile but still elevated, with a likely trading range of $93–$101. If diplomacy improves and tanker traffic recovers, WTI could slip toward $90–$92. But if talks disappoint, repairs are delayed, or inventories tighten again, prices could quickly move back above $100 and retest $103–$106.
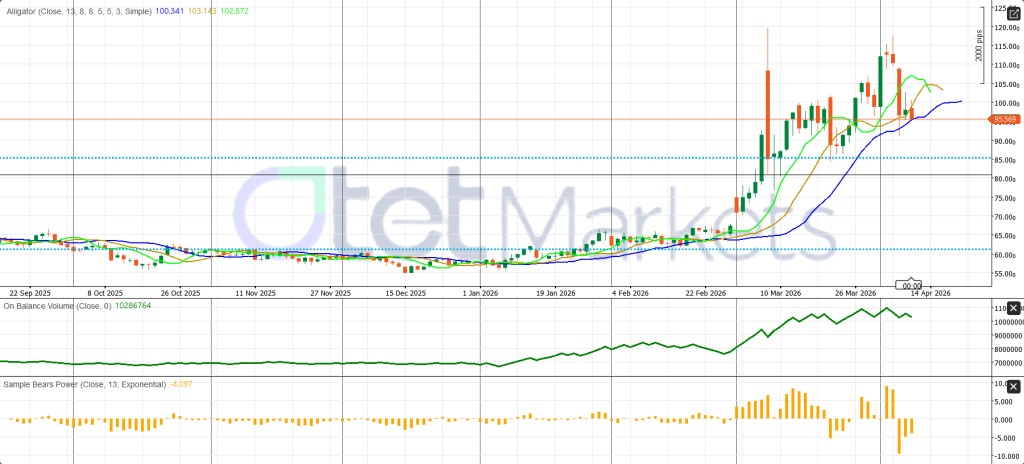
Technically, WTI remains elevated overall, but the near-term trend has turned corrective. Price is trading near 95.57, below the Alligator resistance cluster around 100.34–103.14, showing that sellers have regained short-term control. The market failed to hold above 100 and is now testing support near 95.50. A break lower could expose 90.00 and then 85.38, while recovery requires reclaiming 100.34 and then 102.57–103.14. Momentum still argues for caution, as OBV has flattened and Bears Power remains negative, signaling fading upside strength and active downside risk.
Crypto Market Condition and BTC Weekly Outlook
The crypto market ended the week in a risk-sensitive recovery mode, driven more by easing geopolitical stress than by any deep structural shift in the asset class. The main catalyst was President Donald Trump’s decision to pause strikes on Iran for two weeks, combined with tentative Iranian acceptance of a ceasefire framework tied to safe passage through the Strait of Hormuz. That truce helped trigger a broader risk-on move across global markets: the dollar weakened, oil prices fell, equities rose, and cryptocurrencies advanced. The week therefore reinforced the idea that crypto is currently behaving more like a high-beta risk asset than a defensive haven such as “digital gold.”
Bitcoin and major altcoins rallied sharply on the first ceasefire headlines, but the gains did not hold cleanly. As doubts about the ceasefire resurfaced, the rally lost momentum and the market pulled back. By Thursday, Bitcoin had slipped toward $70,948, while Ethereum, XRP, and Solana also retreated as geopolitical uncertainty returned. By Friday, however, crypto recovered some ground again as markets looked ahead to U.S.-Iran talks in Pakistan. This pattern showed that crypto remains highly exposed to geopolitical headlines and macro sentiment, rather than trading on crypto-specific fundamentals alone.
Under the surface, however, the market tone was somewhat healthier than the headline volatility suggested. U.S. spot Bitcoin ETFs reportedly recorded $471.3 million of inflows on April 6, the largest one-day inflow since late February, which indicates that institutional investors were still willing to buy the dip despite macro instability. Weekly digital-asset products also saw $224 million inflows, although Ethereum continued to face outflows and the broader market remained BTC-led rather than broadly bullish. In other words, investors were willing to own Bitcoin, but they were not yet aggressively chasing the full altcoin complex.
Looking ahead, the outlook for Bitcoin is constructive but not yet confirmed. BTC is holding around the low $72,000–$73,000 range, which suggests consolidation after a rebound rather than a decisive breakout. The week ahead is likely to be driven mainly by macro catalysts, including U.S. PPI, the Beige Book, industrial production, and Fed Governor Waller’s remarks. If inflation signals are softer and Fed language is less hawkish, Bitcoin could push higher and challenge resistance more convincingly. If inflation remains hot or rate-cut expectations are pushed further back, crypto could quickly swing back into a more defensive range. Technically, Bitcoin has improved by moving above key moving averages, but it still needs a stronger move through resistance to confirm a more durable bullish continuation.
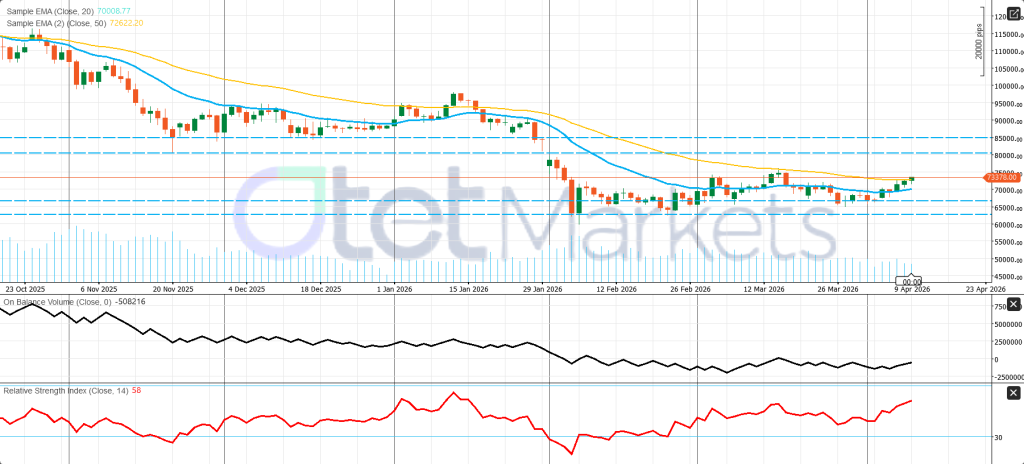
BTC/USD is recovering, with price around 73,378 now above both the 20-day and 50-day EMAs, signaling improved short-term momentum. However, the 20-day EMA is still below the 50-day EMA, so the broader trend remains in repair rather than fully bullish. Resistance stands near 75,000, with a larger upside zone at 80,500–85,000. Support lies around 72,600–70,000, then 67,000 and 64,000. RSI at 58 and stable OBV suggest improving momentum, but not a confirmed breakout yet.
Share
Hot topics

Best Market to Trade for Beginners (Complete 2026 Guide)
Introduction When you’re starting out as a trader, you’re probably thinking the same thing as everyone else: Where do I start? It can be hard to know which market to...
Read more


Submit comment
Your email address will not be published. Required fields are marked *