
Global Economy After Longer US government Shutdown, Week 47, 2025
The global economy is moving toward a soft-landing environment, marked by cautious sentiment and uneven momentum. The U.S. remains the key stabilizer, with solid growth but tighter financial conditions as the Fed pushes back against expectations for near-term rate cuts. The Eurozone shows low but steady growth, easing inflation and improving trade, keeping the ECB cautious. China is the main downside risk, with weak industrial output, soft consumption, falling investment and persistent housing stress.
USA
The U.S. economy continues to display steady, non-recessionary momentum, but financial markets faced a sharp reality check this week: the Fed is not ready to ease, and rate-cut optimism is fading quickly. The week was defined by policy repricing, heightened global volatility, and the earliest indications that U.S. economic momentum is beginning to cool—though it is far from breaking.
U.S. Economic Review
Financial markets spent the week dissecting an unusually heavy slate of Federal Reserve commentary in the absence of new economic data, and the message was clear: policymakers are increasingly hesitant to deliver another rate cut in December. Several influential voting members—including St. Louis Fed President Musalem and Boston Fed President Collins—struck a hawkish tone, arguing that inflation risks remain elevated and that monetary policy should stay restrictive for now. While Governor Miran continued advocating a 50-bps reduction, the broader communication stream was hawkish enough to pull market-implied odds of a December cut down from 63% to 42%.
This shift reflects two dynamics: reduced visibility on the labor market due to the prolonged government shutdown, and recent indications that economic activity may be running hotter than expected. Alternative data show jobless claims tracking seasonal norms, suggesting a gradually cooling—but not weakening—labor market. Meanwhile, Q3 GDP growth is on pace for roughly 3.5%, raising concerns among some Fed officials that policy may not be sufficiently restrictive to guide inflation back toward the 2% target.
Nonetheless, softer momentum is expected to head into late 2025 and early 2026. Consumer spending and business investment are likely to cool under pressure from a moderating labor market, slower income gains, elevated borrowing costs, and heightened uncertainty. Small business sentiments are also weakening; the NFIB Optimism Index slipped to 98.2, it’s lowest since April, as firms report declining sales, persistent cost challenges, and greater caution around demand—though hiring remains steady. Retail activity, measured by Redbook sales, rising 5.9% YoY, shows consumer spending remains resilient but gradually moderate.
Housing data reinforce this mixed picture: the MBA 30-year mortgage rate climbed to 6.34%, yet mortgage applications rose modestly, confirming a rate-sensitive but not collapsing sector.
Financial markets reacted decisively to the Fed’s hawkish shift. Treasury yields firmed, with the 10-year near 4.12% and the 2-year period close to 3.59%, although safe-haven demand later tempered the rise. Risk appetite weakened as equities softened and high-beta assets—particularly crypto—came under pressure. Gold gained on safe-haven flows, while oil remained volatile amid broader risk-off sentiment.
U.S. Economic Outlook
The week ahead will focus heavily on how incoming data shape expectations for the December Federal Reserve meeting, at a time when the U.S. economy remains resilient but confidence is increasingly fragile. Following the Fed’s second 25 bps cut of the year—bringing the federal funds rate to 3.75–4.00%—officials emphasized that another reduction in December is “not a foregone conclusion.” With markets hypersensitive to any shift in the growth-inflation narrative, this week’s releases will help determine whether policymakers feel comfortable easing again or prefer to pause.
Economic visibility remains clouded by the prolonged federal government shutdown, which has delayed key data and weakened sentiment. Consumer psychology is especially vulnerable: the University of Michigan’s survey has slipped toward historic lows as households react to political tensions, tariffs, and cost-of-living pressures. Yet private-sector indicators point to continued moderate, non-recessionary growth, and major retailers still expect holiday spending to surpass $1 trillion—albeit with slower growth and highly price-sensitive consumers.
Against this mixed backdrop, the November 17–22 data flow will refine, not redefine, the macro-outlook. Regional and national manufacturing indicators—including the Empire State Survey, Philadelphia Fed Index, industrial production, and the S&P Global PMIs—will show whether factory activity is holding up under tighter financial conditions and weaker sentiment. Housing statistics (starts, permits, and existing home sales) will provide clarity on how elevated mortgage rates and uncertainty are affecting construction and resale demand. Meanwhile, the FOMC minutes from the October 28–29 meeting will be the week’s most important policy event, offering insight into how divided the Committee is over further rate cuts and the decision to end balance-sheet runoff on December 1.
Markets will enter the week looking for validation of a soft-landing narrative: slowing but steady growth, moderating inflation, and a Federal Reserve that remains open—but not committed—to cutting again in December. Stronger-than-expected activity or sentiment would likely reduce rate-cut odds and support the dollar and Treasury yields. Conversely, softer data or dovish FOMC minutes would increase the probability of another cut and bolster risk assets heading into late November.
The delayed September nonfarm payrolls report—expected mid-week—may also be the final comprehensive labor snapshot the Fed receives before the December meeting. We expect a modest 45K job gain, steady unemployment near 4.3%, and firm wage growth of 0.3% month-over-month. While the report is dated, a surprise uptick in unemployment toward 4.4% would strengthen the argument for another cut. Overall, the week ahead is poised to shape the final stage of the Fed’s 2025 policy path, with markets highly sensitive to every data point and policy signal.
USD and Wall Street in the week ahead
Both the USD and U.S. equity markets are entering a choppy, headline-driven week dominated by incoming data and shifting Fed expectations. After a wave of hawkish Fed speeches, confidence in a December rate cut has slipped below 50%, down from nearly two-thirds just weeks ago. Strong Q3 earnings—up roughly 17% y/y with 83% of companies beating estimates—continue to support equities, yet major indices remain volatile, with the S&P 500 slightly lower in November and the Dow only marginally higher. The dollar index is holding near 99–100, moving sideways as traders weigh Fed uncertainty and missing data from the recent shutdown.
USD Outlook: Sideways-to-Firm, Highly Data-Sensitive
The U.S. dollar is likely to trade in a range with a mild upward bias, supported by elevated U.S. yields, a Federal Reserve pushing back against aggressive easing expectations, and a shaky global risk backdrop marked by equity volatility, crypto weakness, and geopolitical tension. Stronger U.S. data—firmer manufacturing, steady industrial production, and resilient housing—would reinforce the “no rush to cut” narrative, lifting DXY and pressuring high-beta and EM currencies. Softer data, however, would revive December rate-cut odds and push the dollar lower, especially against cyclical FX like AUD, NZD and CAD, while the JPY could gain on risk-off flows.
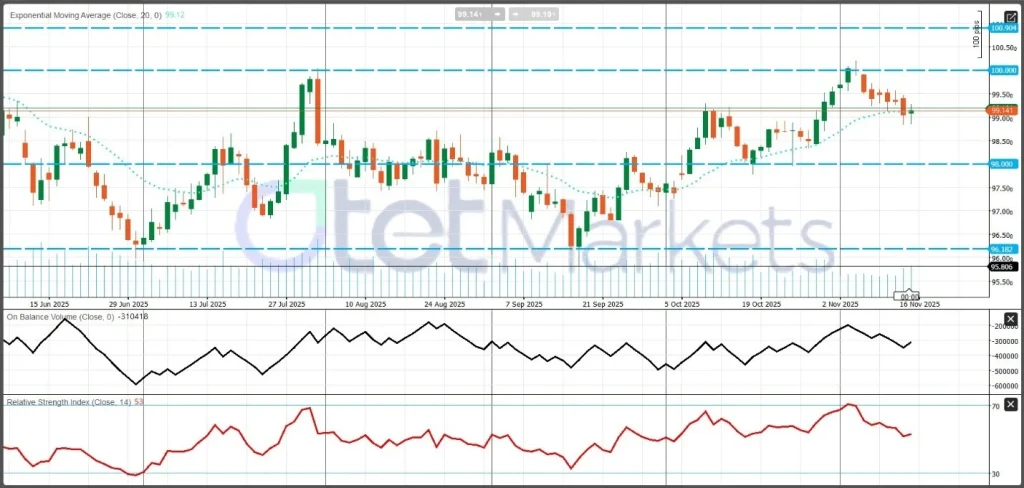
Technically, the dollar remains in a medium-term uptrend, with higher highs and higher lows since June. Price is consolidating near the upper third of the 96–101 range, holding above key support at 98–99, which keeps the structure bullish-to-neutral. The 20-day EMA and RSI both support an uptrend pause rather than a reversal. Key resistance sits at 100–101, while a break below 98 would signal a deeper correction toward the mid-96s.
Wall Street Outlook
U.S. equities enter the week in a choppy, range-bound environment, driven primarily by shifting Fed expectations and ongoing earnings momentum. The S&P 500 ended last week slightly lower after a sharp mid-week drop and partial rebound, with especially AI-linked names—remaining the main swing factor. Big-tech earnings and guidance will continue to dominate sentiment, making intraday volatility around data releases and Fed speeches likely.
Fundamentally, the market is still anchored by a soft-landing narrative: solid growth signals and no major inflation surprises support dip-buying, particularly in quality growth and mega-cap tech. Conversely, weaker data could revive recession fears, pressuring cyclicals while pushing investors back into defensive large-cap tech. If Fed officials maintain their hawkish tone and December cut odds fall further below ~50%, equities may remain heavy, especially rate-sensitive segments such as small caps, REITs and high-multiple tech. Softer data or a more dovish Fed tone could re-ignite cut expectations and support risk assets into late November.
Positioning is moderate after a strong year (S&P up high-teens YTD through October) and a small pullback in November, favoring “buy-the-dip, sell-the-rip” flows over a full trend reversal.
Dow Jones Technical Picture
The Dow remains in a medium-term uptrend following a strong V-shaped recovery from March. Price is now testing a key rising trendline near 47,000, with the 50-day EMA (~46,650) acting as critical support. Holding above these keeps the outlook bullish-to-neutral with potential retests of 48,500–49,000 and possibly 50,000+. A clean break below the trendline and EMA opens downside risk toward 45,000–45,500, and deeper toward the 41,950 bases.

Eurozone Economy and Weekly Outlook
The Eurozone remains on a slow but stable expansion path, with external demand and falling inflation providing important support. A recession looks unlikely in the near term, but a vigorous recovery also appears out of reach. For the ECB, this week’s data is encouraging on inflation and stability, yet probably not sufficient to justify an aggressive easing cycle. A cautious, data-dependent stance is likely to remain the default.
Eurozone Economic Review
The latest data show the Eurozone navigating a period of soft but broadly stable growth, with inflation easing, the labour market holding firm and the external sector delivering an unexpected boost. Although momentum remains subdued compared with historical norms, the block appears to have sidestepped the deeper slowdown seen earlier in the year.
Growth in Q3 provided a mild upside-price surprise. GDP expanded by 0.2% QoQ and 1.4% YoY, supported by resilient services activity and a stronger trade contribution. Domestic demand, however, remains weak as tighter financing conditions continue to act like a drag.
The labour market remains a pillar of stability. Employment rose 0.1% QoQ and 0.5% YoY, bringing total employment to 170.28 million. Despite the sluggish economic backdrop, companies have largely retained workers, with unemployment still near multi-decade lows across much of the region.
Inflation continues its gradual decline. Core CPI held at 2.5% YoY, reflecting sticky services inflation even as headline pressures ease. National trends diverge: Germany shows steady cooling at 2.3% YoY, France saw sharper declines toward 0.8–0.9%, while Spain remains the outlier with inflation above 3%, driven by energy and services. This highlights an uneven, but generally downward, inflation trajectory.
Industrial production remains fragile but no longer deteriorating. Eurozone IP rose 0.2% MoM in September and 1.2% YoY, missing expectations but stabilizing overall. Italy provided the standout performance, with a 2.8% MoM jump and a 1.5% YoY gain, powered by machinery, equipment and autos—proof that pockets of manufacturing strength remain.
The external sector delivered the week’s strongest signal. The trade surplus widened sharply to €19.4B, boosted by lower energy import costs, firm foreign demand and a competitive euro. This improving trade balance has become a major pillar supporting the Eurozone’s outlook.
Confidence indicators paint a mixed but stabilizing picture. German ZEW sentiment remains weak, reflecting the country’s ongoing industrial challenges, while Eurozone-wide sentiment improved modestly. Consumer confidence varies widely—stronger in Germany and Italy, weaker in France and Spain—but shows tentative stabilization overall.
The Eurozone’s financial resilience also improved, with reserve assets rising to €1.71T, supported by a robust current account surplus and favorable market valuations.
Overall, the block is characterized by modest but steady growth, cooling inflation, a firm labour market and strengthening external balances. Risks remain—weak manufacturing recovery, soft consumer confidence and ongoing German weakness—but the data collectively point to a cautious, low-momentum expansion, rather than renewed recession risk.
Eurozone Economic Outlook
The Eurozone enters the new week with a soft but gradually improving economic backdrop, supported by easing inflation, firmer survey data, and cautiously better sentiment indicators. October flash inflation came in at 2.1% YoY, edging down from 2.2% in September and reinforcing the steady disinflation trend. While core pressures remain present, headline momentum continues to cool, giving the European Central Bank room to remain patient.
Activity indicators are also improving. The HCOB Composite PMI rose to 52.5 in October, marking the strongest expansion in over a year and signaling that the recovery in services and pockets of manufacturing is gaining traction. Forward-looking sentiment echoed this shift, with the Eurozone ZEW economic sentiment index climbing to 25.0 in November—higher than expected and a clear improvement from the prior month.
Against this backdrop, the ECB maintained its deposit rate at 2.0% at its late-October meeting, pausing its easing cycle and signaling that the inflation outlook remains “broadly unchanged.” Policymakers continue to frame upcoming decisions as data-dependent, meaning the incoming inflation and PMI releases will be pivotal in shaping expectations for early 2026.
The week ahead (17–22 November) brings several key releases. On Wednesday, markets will receive the final October Euro Area HICP, expected to confirm the 2.1% flash reading, as well as the Balance of Payments data. The ECB Governing Council non-monetary meeting may also generate headlines that influence rate expectations, especially if comments hint at the 2026 policy path.
On Friday, the focus turns to the November flash HCOB PMIs for Germany and the Eurozone. October’s upside surprise—manufacturing returning to 50.0, services at 53.0, and the composite at 52.5—raised hopes of a durable rebound, although weak export orders highlight ongoing external headwinds. Consensus expects only marginal changes in November, with manufacturing staying slightly above 50 and services easing modestly.
EURUSD in technical review
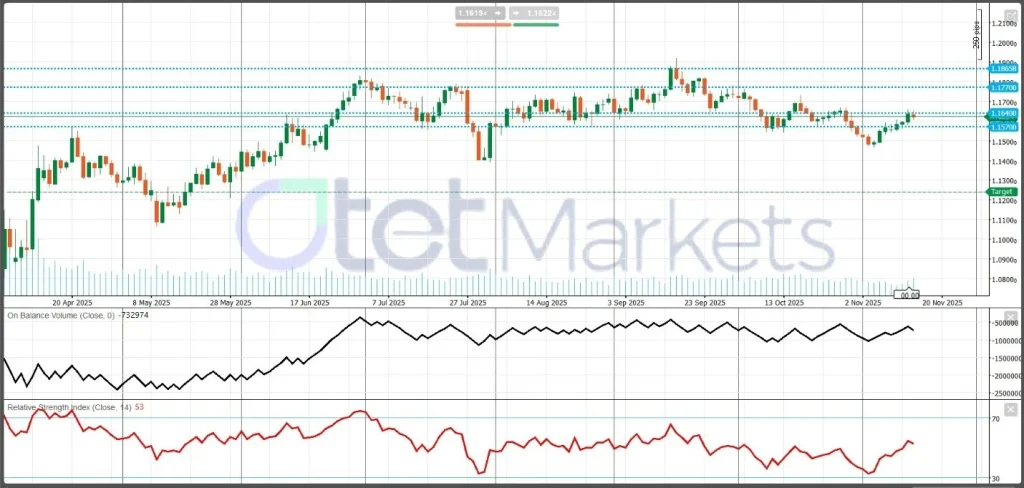
EUR/USD remains in a sideways consolidation, with momentum stabilizing but not yet signaling a clear trend. After rallying from 1.08–1.09 to the 1.18s earlier this year, the pair has spent months moving within a broad 1.15–1.19 range, reflecting a pause rather than a directional shift. Current price action near 1.16 puts it in the lower half of that range following a rebound from support. Key levels to watch are 1.1570 on the downside—holding this keeps the rebound valid—and 1.1640 as the first resistance. A break above 1.1770, and especially 1.1865–1.19, would signal a bullish range breakout.
Gold – Current Market Condition and Weekly Outlook
Gold’s long-term bullish narrative remains fully intact, supported by persistent macro uncertainty, strong central-bank accumulation, and accelerating global diversification away from the U.S. dollar. Even so, the metal enters the new week in a stretched and highly sensitive state, trading near historically elevated levels after an explosive year-to-date rally. Spot prices are holding around $4,050–4,100/oz, only modestly below mid-October’s record highs above $4,300, despite a sharp 2–3% pullback triggered by hawkish Federal Reserve commentary. Futures continue to trade within a $4,050–4,200 band, underscoring how extended the run has become following a move from the low-$3,000s to nearly $4,400 since September.
Fundamentals remain constructive but crowded. Inflation is cooling only gradually, geopolitical tensions are elevated across multiple regions, public-debt pressures continue to grow, and concerns around global growth persist. Central banks and ETFs remain steady buyers. However, renewed uncertainty over a December Fed rate cut—after policymakers pushed back strongly—has lifted real yields and strengthened the dollar, creating short-term headwinds. With gold already up more than 60% this year, the market is highly vulnerable to headline-driven swings, profit-taking, and tactical repositioning.
In the week ahead, gold’s direction will be shaped by three primary forces:
1. Fed expectations & U.S. data
Soft PMIs, weaker labor data, or cooling inflation would revive rate-cut expectations and support gold. Conversely, stronger-than-expected macro data or continued hawkish Fed commentary would reinforce higher-for-longer yields and keep pressure on prices. A supportive macro mix could send gold back toward $4,250–4,300, while firmer data may drag it decisively below $4,000, opening room toward $3,800s without breaking the long-term trend.
2. Risk sentiment
Equity or credit stress, geopolitical escalation, or a risk-off shock would drive safe-haven flows back into gold. A broad risk-on rebound—especially alongside crypto recovery—would reduce hedge demand and keep gold in a corrective phase.
3. Dollar trajectory
Recent declines have coincided with a firmer USD and rising real yields. Continued dollar strength caps upside; a weaker USD would give gold room to retest its upper range.
Technical picture
Gold remains in a dominant uptrend, but in the cooling phase of a parabolic rally. Price holds above the rising 20-day EMA (~4,060) and 50-day EMA (~3,930), indicating consolidation rather than reversal. Key resistance sits at $4,250–4,280, then $4,380. Support lies at $4,050, with major trend support at $3,875–3,900. A break below this zone would signal a deeper correction, while holding above keeps the path open for another attempt at new highs.

Energy Market – Current Condition and WTI Weekly Outlook
WTI enters the new week trading in the high-$50s to around $60, stabilizing after a volatile stretch marked by sharp sell-offs on oversupply concerns and brief rebounds on geopolitical headlines. The broader market narrative has clearly shifted: what was once a “tight supply” story has now transitioned into a medium-term surplus outlook, driven by rising global production and softening demand.
The IEA’s latest Oil Market Report underscores this shift, projecting that global oil supply will outpace demand in 2025–26, resulting in higher inventories and a material surplus by 2026. The EIA’s Short-Term Energy Outlook echoes this view, expecting Brent to trend toward the mid-$50s in 2026, which would place additional downward pressure on WTI. Weekly U.S. data reinforce the message—refinery runs are up, product output is strong, and crude inventories remain ample, painting a picture of a market that is well supplied rather than tightening.
OPEC+ has also revised its expectations, now anticipating a modest surplus in 2026 as non-OPEC supply expands and global demand growth slows. With this shift, the market consensus has tilted firmly bearish for the medium term: high inventories, strong supply growth, and subdued demand collectively weigh on crude.
In the near term, WTI is likely to remain range-bound and choppy, fluctuating between the high-$50s and low-$60s as traders balance the surplus narrative with short-term positioning and headline-driven volatility. Upside risks still exist—particularly geopolitical disruptions or unexpected OPEC+ action—but unless such events materialize, upside moves are likely to be short-lived.
Last week encapsulated the bearish tone. OPEC+’s surplus forecast triggered a 3.5–4% drop in both Brent and WTI, pushing prices to three-week lows. A brief geopolitical bounce followed a Ukrainian strike on a Russian oil depot, but gains faded quickly under the weight of fundamentals. The U.S. EIA added further pressure with a massive +6.4M crude stock build, while rising rig counts confirmed that U.S. supply growth remains resilient.
Natural gas also weakened after a larger-than-expected storage build (+45 Bcf), while global risk sentiment deteriorated as the Federal Reserve pushed back against near-term rate-cut expectations. Weak Chinese data—especially slower industrial production, retail sales, and investment—added another layer of demand concerns.
Overall, the energy market ended the week firmly bearish. With supply rising, inventories building, China slowing, and the Fed tightening financial conditions, crude remains under downward pressure. Without fresh OPEC+ cuts or a meaningful macro upside surprise, WTI’s near-term path is likely to stay defensive.
WTI technical review
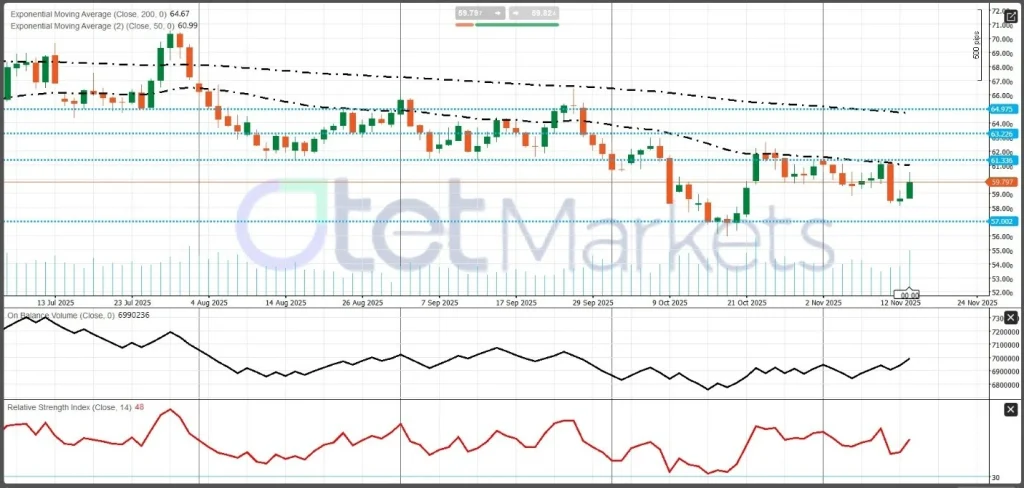
WTI remains in a medium-term downtrend, with price recovering from the $57 support but still capped by declining moving averages and overhead resistance. The structure continues to show lower highs and lower lows since late July, while both the 50-day EMA (~$61) and 200-day EMA (~$64.7) are trending downward—confirming bearish momentum. The market is trading in a sideways-to-lower range between $57 and $62, with current price near $59.8, making the latest rebound still countertrend. A break below $57 would signal further downside toward the low-$50s, while $61.3–61.5 remains the first key resistance, followed by $63–64.
Crypto Market Current Condition & BTC weekly Outlook
The global crypto market cap has slipped to roughly $3.3–3.6 trillion, edging lower over the past week amid 1–3% daily swings. Bitcoin dominance remains elevated at 57–60%, confirming that BTC continues to dictate broader market risk. Bitcoin itself has retreated sharply from recent all-time highs above $120,000, now trading in the high-$90,000 area after repeated intraday breaks below $100k, erasing hundreds of billions in market value and triggering significant liquidations across majors and altcoins.
ETF flows, which powered much of the early-year rally, have turned mixed. After strong inflows earlier in 2025, U.S. spot Bitcoin ETFs have posted several sessions of heavy outflows, especially around macro events, with only modest inflow days returning recently. The flow pattern shows a market that is no longer in “one-way accumulation” mode. Institutional investors remain engaged but have shifted to more tactical positioning.
On-chain data signals rising fragility. Long-term holders still command roughly 75% of total supply, but more than 300,000 BTC has rotated into short-term hands over the past month, reflecting profit-taking and speculative turnover. Notably, short-term holders recently sent ~29,400 BTC to exchanges at a loss—a historically bearish signal associated with elevated downside risk and forced selling phases.
Altcoins continue to underperform BTC on the downside, showing higher beta to sell-offs. While isolated pockets such as Solana and specific thematic tokens have held up better, most altcoins remain under pressure as liquidity tightens and ETF flows concentrate in Bitcoin rather than the broader market.
Bitcoin Weekly Outlook
BTC is currently navigating a complex macro environment shaped by slower Fed-easing expectations, higher real yields, and choppy global risk sentiment. Spot ETFs still hold large structural positions, but the shift from strong inflows to intermittent outflows highlights investor fatigue near the $115k–$120k zone. Long-term fundamentals—scarcity, institutional adoption, dominant network effects—remain intact, yet short-term headwinds dominate: tighter financial conditions, profit-taking, negative flow momentum, and weak on-chain behavior. A further deterioration in macro sentiment or renewed ETF outflows could open risk toward the low-$80k region, even though the long-term bullish thesis remains strong.
BTC Technical review
Bitcoin has entered a clear corrective downtrend, breaking decisively below the key $100,000 level and trading beneath all major moving averages, with momentum indicators (RSI, OBV, Alligator lines) confirming bearish pressure. The first support sits near $95k; a break below this would expose $90k and potentially $85k. While short-term rebounds are possible, the structure favors further downside or a bearish consolidation unless BTC can reclaim $100k–104k+, which would be needed just to neutralize selling pressure. After peaking above $125k, price action shows acceleration to the downside, signaling a medium-term bearish phase rather than a shallow pullback.

Share
Hot topics

What is Balance in Forex? A Complete Guide for Traders
Introduction When you open a trading account for the first time, one of the first numbers you see on your screen is your balance. It looks simple. It looks clear....
Read more


Submit comment
Your email address will not be published. Required fields are marked *