
Global Economic Outlook | From Beijing to the Fed: The Week’s Macro Map
This week’s Global Economy Weekly Outlook maps the key macro catalysts shaping cross-asset markets, with a focus on how growth, inflation, and policy expectations are likely to evolve across major regions. We break down the highest-signal event risks—U.S. data and Fed pricing, China’s GDP/activity and PBoC stance, and the Bank of Japan’s decision—while translating them into actionable implications for FX, rates, equities, commodities, and crypto. The report pairs top-down fundamentals (real yields, credit impulse, demand quality, and geopolitical risk premia) with clear technical roadmaps for the main market benchmarks, highlighting the levels and triggers that matter most into the week.
USA
The second week of 2026 reinforced the market’s base case of a “moderating but resilient” U.S. economy—one that supports a higher-for-longer Fed posture and keeps the timing of rate cuts highly dependent on upcoming inflation and labor-market data. With the week ahead holiday-shortened and earnings-heavy, rates and Fed-related headlines remain the dominant swing factors for both the USD and U.S. equity valuations.
On growth, the tone stayed firm. The Atlanta Fed’s GDPNow for Q4 held elevated at 5.3% (vs 5.1% expected/prior), pointing to meaningful momentum entering 2026. Hard activity data also surprised to the upside: Industrial Production rose +0.4% m/m (vs +0.1% expected), Manufacturing Production increased +0.2% m/m (vs -0.2% expected), and Capacity Utilization ticked up to 76.3%. Regional factory surveys turned notably stronger, with Philly Fed jumping to 12.6 (from -8.8) and Empire State improving to 7.7 (from -3.7). Within Philly Fed, demand signals strengthened (New Orders 14.4), capex intentions remained high (CAPEX 30.3), and price pressures eased modestly (Prices Paid 46.9), suggesting resilience without an obvious overheating signal.
Inflation data were constructive, particularly at the core level. CPI printed 0.3% m/m and 2.7% y/y (in line), while Core CPI came in at 0.2% m/m and 2.6% y/y, both softer than expected—supporting the disinflation narrative even with solid activity. The caution is upstream: Import Prices rose +0.4% m/m and Export Prices +0.5% m/m, implying pipeline pressures could re-emerge if FX, freight, or commodities stay firm.
Labor markets remain tight. Initial claims fell to 198K (vs 215K expected), continuing claims eased to 1.884M, and the 4-week average declined to 205K, consistent with contained layoffs and stable income dynamics. Consumers were mixed but not weak: real earnings dipped -0.3% m/m, while retail indicators remained supportive (Redbook +5.7% y/y; prior retail sales +0.6% m/m). Housing stabilized as rates improved: Existing Home Sales rose to 4.35M and MBA applications surged +28.5% w/w, but builder sentiment softened (NAHB 37), highlighting ongoing affordability constraints.
Financial conditions were aided by a major positive: strong foreign demand for U.S. assets, with TIC long-term inflows +$220.2B and Treasury buying +$85.6B. Overall, the data mix supports a Fed that can wait, not rush—growth is holding up, and core inflation is behaving, even as pipeline inflation and rates remain the key risks.
US Economy in the week ahead
The week ahead is holiday-shortened and earnings-heavy, with rates and Fed-related headlines likely to remain the dominant drivers of both the USD and U.S. equity multiples.
Macro and policy positioning remains finely balanced. Resilient U.S. activity keeps the “higher-for-longer” risk alive, while Fed leadership/independence noise has the capacity to reprice both yields and the dollar quickly. The baseline USD setup remains modestly supported as long as yields stay firm and policy uncertainty sustains a safe-haven bid. A meaningful USD downside move would more likely require a clearer risk-on impulse paired with decisively lower yields.
Event risk begins with U.S. markets closed Monday (Jan 19) for MLK Day, typically translating into thinner liquidity and higher positioning risk into Tuesday. Tuesday (Jan 20) also functions as a “catch-up” day for delayed Fed statistical releases.
Wednesday (Jan 21, 8:30 a.m.) brings Housing Starts and Building Permits (Dec)—a key read for the housing cycle and other rate-sensitive sectors—followed by Pending Home Sales (Dec) at 10:00 a.m. Construction Spending is also due; recent trends suggest outlays have been supported by home-improvement activity even as single-family and parts of nonresidential remain pressured. The base case is flat October construction spending (0.0%) after +0.3% in September.
Thursday (Jan 22) is the macro fulcrum, featuring the Q3 2025 “third” GDP estimate, Corporate Profits, GDP by Industry, and Initial Jobless Claims—a data cluster that can quickly reprice rates and the USD. The same day includes Personal Income and Spending, with the consumer backdrop still bifurcated. Building on November retail strength, expectations are for outlays +0.5% and income +0.3%. Inflation is expected to remain sticky early in 2026, with PCE improving more slowly than CPI; headline and core PCE are estimated at 2.8% y/y in October and November.
Friday (Jan 23) brings the first major January activity read via the S&P Global Flash Manufacturing PMI. Throughout the week, markets will take their cue from major earnings and guidance—Netflix, Johnson & Johnson, and Intel—and from any Fed-independence or legal headlines that could jolt yields, the USD, and risk appetite.
DXY Technical Analysis | Daily
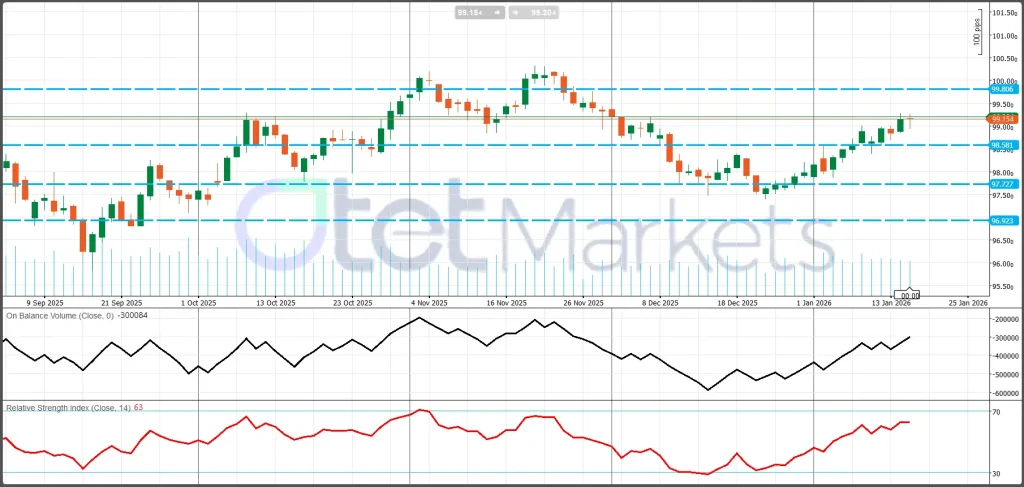
DXY has staged a clean short-term recovery since the late-December low, printing higher lows and higher highs as it rebounded from the ~97.7 area into the 99.1–99.2 region. However, the broader structure still looks range-bound rather than trend-driven: from September through January, the index has largely oscillated between 96.9 and 100.0, and price is now back in the upper half of that range.
The key technical issue is overhead supply. DXY has reclaimed 98.53 and advanced toward ~99.15, but the main decision zone sits at 99.80–100.00. Until the index delivers a convincing daily close above that band, the move should be treated as a recovery within a larger range—not a fully re-established uptrend.
Momentum is supportive but not extreme. RSI (14) around 63 signals constructive bullish momentum without overbought conditions, which typically allows continuation if resistance breaks. OBV has also turned higher from the December trough, suggesting improving participation consistent with accumulation rather than a purely mechanical bounce.
Key levels: resistance at 99.80–100.00, then 100.40–100.60, with 101.00–101.50 only relevant if a new higher range develops. Support sits at 99.15, then 98.53, followed by 97.73 and the range floor near 96.92.
S&P 500 Technical Read | Daily
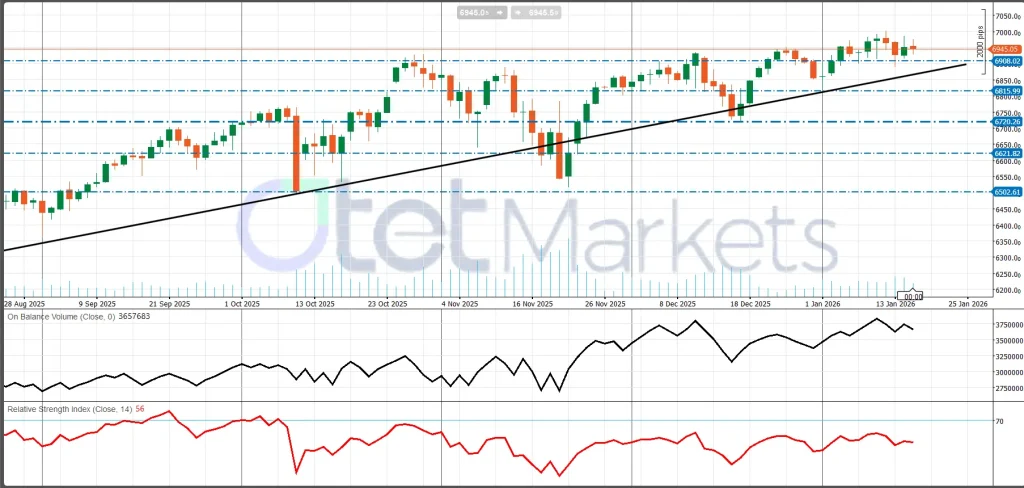
The primary trend remains bullish, with the index holding above the rising trendline that has guided the advance since late August. Near-term price action, however, reflects consolidation near the highs: since late December, the market has moved sideways-to-slightly higher rather than extending in a clean trend. This is a classic “trend + pause” setup—bulls still control the broader structure, but price is pressing for confirmation at overhead resistance.
Trendline support is now converging with price in the high-6800s/low-6900s, creating a notable support confluence around 6908 and the rising trendline. With resistance relatively flat in the ~6945–7000 zone and support rising, the chart resembles an ascending triangle / tightening coil: bulls are defending progressively higher lows while sellers repeatedly appear near the same ceiling. These setups often resolve via breakout, but confirmation depends on daily close and acceptance, not brief intraday probes.
Momentum remains constructive but not stretched. RSI (14) ~56 suggests there is room for another push higher, though it is not the type of momentum that typically breaks resistance without a catalyst. OBV remains broadly supportive, but has turned flatter and choppier near the highs—healthy for trend durability, but still consistent with the risk of a quick shakeout if catalysts disappoint.
Key resistance sits at 6945, then 7000, with 7050 as an extension target. Key support is 6908, followed by 6816, 6720, and 6622 (then 6503 if risk-off intensifies).
China
China enters the week with a familiar but increasingly market-relevant policy mix: support is becoming more proactive, yet domestic demand remains uneven and the main constraint is still credit transmission, not liquidity availability. The calendar is front-loaded with Q4 GDP and the National Bureau of Statistics’ December activity pack, followed shortly by a key People’s Bank of China checkpoint via the monthly Loan Prime Rate (LPR). This lands against Beijing’s stated intention to maintain a “moderately loose” monetary stance in 2026, keeping markets focused on whether easing translates into a durable improvement in private demand and pricing power.
China’s second week of 2026 delivered two headline messages. First, the credit pulse improved meaningfully, driven by a clear rebound in bank lending. Second, trade remained a key stabilizer, with external performance continuing to offset softer domestic pockets. In parallel, AI-chip policy signals highlighted Beijing’s attempt to support near-term growth while reinforcing longer-run strategic priorities. Overall, the picture is an economy leaning on policy-enabled financing and resilient external demand, with domestic demand improving but still uneven across sectors.
On credit, the main upside surprise was a sharp year-end acceleration in new lending: New Loans (Dec) CNY 910B versus CNY 820B expected and CNY 390B prior. Liquidity growth also firmed, with M2 rising 8.5% y/y versus 8.0% expected/prior. Outstanding loan growth was steady to slightly firmer at 6.4% y/y, while Total Social Financing (TSF) reached CNY 2,210B—above expectations but down from CNY 2,490B previously. The interpretation is constructive but nuanced: bank loans are doing most of the work, while other financing channels remain more variable, implying improved conditions without uniformly strong demand for leverage.
Trade data reinforced external resilience. The USD trade surplus stayed very large at $114.10B, while exports grew 6.6% y/y versus 3.0% expected. The key nuance was imports, up 5.7% y/y versus 0.9% expected, often read as a healthier signal for domestic demand and supply-chain activity than a surplus driven by weak import volumes.
Finally, reported work on AI-chip “guardrails”—potentially limiting advanced chip purchases from foreign suppliers—underscores a balancing act: enabling AI deployment while reducing reliance on foreign inputs and supporting domestic capacity. Over time, this could reshape capex composition and productivity, though it may introduce near-term friction if demand outpaces local supply.
China Economic & Markets Outlook — Week Ahead (Jan 19–25, 2026)
China enters the week facing a familiar but increasingly market-relevant trade-off: headline growth has remained supported by exports and policy measures, but investors are focused on growth quality—whether consumption stabilizes, private-sector credit demand improves, and prices lift meaningfully from depressed levels. A Reuters poll points to Q4 GDP around 4.4% y/y (down from 4.8% in Q3) and a slowdown toward ~4.5% growth in 2026, reinforcing the expectation that policymakers will keep stimulus tools active, likely through targeted easing rather than broad, aggressive “bazooka” measures. The caution flag remains credit transmission: 2025 new bank loans fell to the lowest level since 2018, suggesting the key constraint is still demand for leverage and effective transmission—not liquidity availability.
The week’s main macro catalyst is Monday, Jan 19 (10:00 Beijing), when the NBS releases the National Economic Performance briefing, typically combining Q4 GDP with the December “activity pack.” Consensus looks for Q4 GDP +1.1% q/q (SA), roughly 4.5% y/y, with a mixed activity profile: industrial production expected to firm to 5.0% y/y, while retail sales are projected to slow further to 1.0% y/y. Even if Q4 growth marks the slowest quarterly pace since 2022, China would still be positioned to meet the government’s 5.0% target for 2025. The more important market read-through is composition: retail sales as the clearest signal of household demand and policy traction, industrial output as a gauge of the export/industrial cycle, fixed-asset investment and property components as the medium-term stress point, and unemployment as a key input into the consumption narrative and the policy reaction function. A “better” outcome is not just higher GDP, but evidence of consumption stabilization and less reliance on state-led investment or external demand.
On policy, the PBoC has reiterated a “moderately loose” stance for 2026, balancing ample liquidity and a “reasonable rebound in prices” with RMB stability. This week, 25 bp cuts to structural tool rates take effect on Jan 19, signaling easing via channels designed to direct credit into priority areas without forcing an immediate repricing of benchmarks. The key checkpoint is the LPR fixing on Tuesday (last levels: 1-year 3.0%, 5-year 3.5%). Base case is an unchanged LPR, reinforcing “targeted-first,” while an LPR cut would signal deeper concern about weak demand and prices.
Market implications: CNY is mainly driven by USD/rates but could soften on a surprise LPR cut; equities need consumption improvement for broader upside; commodities/EM are sensitive to IP/FAI strength versus weak retail/property signals.
USD/CNY Technical Analysis | Daily
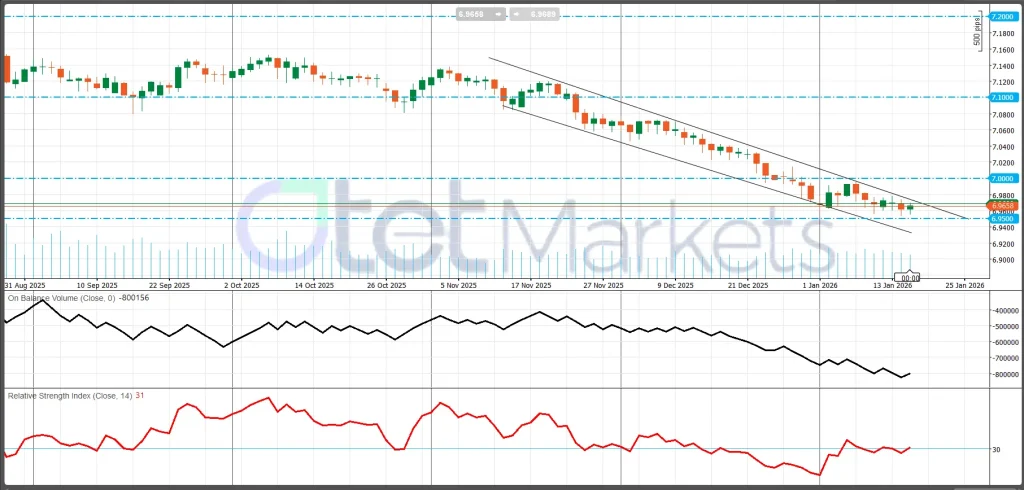
USD/CNY has been in a clear bearish structure since mid-November, trading lower within a well-defined descending channel marked by lower highs and lower lows. Recently, downside momentum has begun to fade near the channel base, with price compressing rather than accelerating. This typically signals either a developing pause/base or a final flush into lower support before any meaningful mean reversion. Regardless, the technical conclusion is unchanged: the trend remains down until price breaks the channel to the upside and holds.
Momentum is stretched, but confirmation remains bearish. RSI (14) near 31 is close to oversold territory, increasing the probability of a corrective bounce, but it does not confirm a reversal. OBV continues to trend lower, indicating negative participation/flow and suggesting sellers still control the tape on balance. The combined read favors tactical rebounds within a broader downtrend, with the burden of proof on bulls to prove a regime shift.
Key levels define the roadmap. The immediate pivot is 6.965–6.97 (around 6.9658). Reclaiming and holding above it would support a corrective rebound, while failure keeps pressure on the channel base. Resistance is concentrated at 7.000 (psychological pivot), then 7.100 (former support turned resistance), and 7.200 (upper cap, relevant only if a larger reversal develops). On the downside, 6.950 is the nearest “line in the sand.” A clean break opens room toward 6.930–6.920, with 6.900 as the next psychological support.
BoJ Week-Ahead Preview
The Bank of Japan’s policy decision on Friday, January 23 lands at a sensitive stage of Japan’s normalization cycle, with the meeting spanning Jan 22–23 and featuring the BoJ’s quarterly Outlook Report. As a result, markets will treat forecast revisions and guidance as at least as important as the rate decision itself—especially given heightened FX sensitivity and political noise.
Baseline expectations are for the BoJ to hold the policy rate at ~0.75%, following the December 2025 hike to 0.75%. Importantly, the December communication preserved a tightening bias: the BoJ reiterated it would continue to raise rates and adjust accommodation if its outlook is realized. That guidance keeps the market focused on the conditions under which the BoJ would deliver the next hike, even if January is a pause.
The domestic data signal is two-sided. Inflation remains above the 2% target (Reuters notes it has been above target for nearly four years), which supports ongoing normalization and argues against declaring inflation risks resolved. However, wages have become a constraint. Preliminary government data show nominal wages rising only 0.5% y/y in November 2025, while real wages fell 2.8% y/y, a downside surprise that complicates the case for a near-term follow-up hike if it persists beyond potential bonus-related distortions. In short: inflation argues for continued normalization; wages argue for patience.
The more immediate market risk to a “quiet hold” is the FX and fiscal narrative. Markets have increasingly priced a renewed “Takaichi trade” amid speculation of a possible snap election (potentially February 8) and expectations of more aggressive fiscal stimulus. This has coincided with yen weakness and a sharp move higher in long-dated JGB yields. A weaker yen can reintroduce imported inflation dynamics—Reuters notes import-price pressure has flattened after a long run of declines as the yen slid—raising the odds that the BoJ adopts a more hawkish tone even without changing rates. External pressure adds another layer: U.S. Treasury Secretary Scott Bessent publicly urged “sound” BoJ policy and faster rate hikes to reduce excessive FX volatility, increasing the communication burden on Governor Ueda.
Because this is an Outlook Report meeting, four items will likely dominate market interpretation: (1) inflation and wage assumptions, particularly any increased confidence around spring wage negotiations; (2) FX sensitivity in the statement and press conference; (3) neutral-rate framing and how far the BoJ intends to normalize; and (4) the risk balance between politics/fiscal risks and domestic demand. A base-case path remains hold in January, then one 25 bp hike in Q3 2026, but the risk skew is asymmetric—yen depreciation and political/fiscal headlines raise the probability of earlier tightening signals and potentially more than one hike if wages re-accelerate.
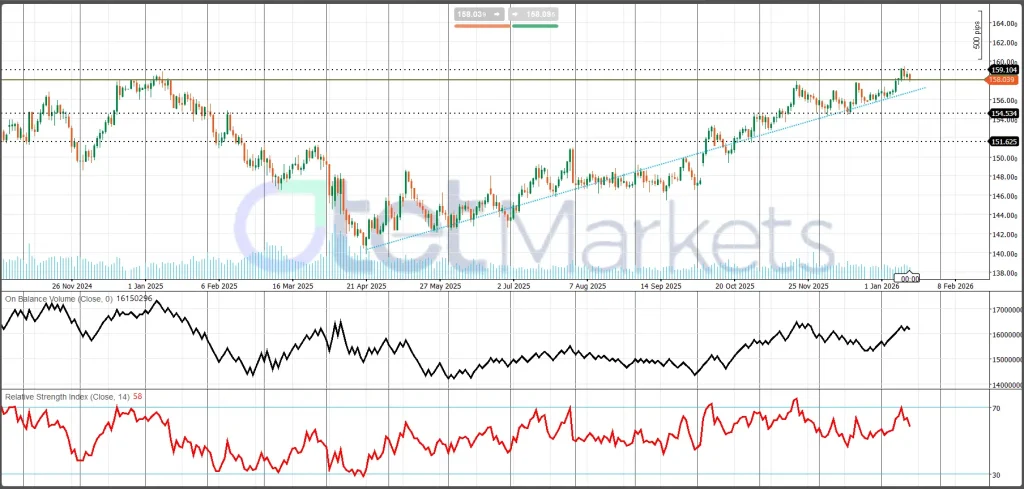
On USD/JPY technicals, the primary trend remains bullish since the April 2025 low, but the pair has shifted into high-range consolidation since October, oscillating in the mid-to-high 150s under resistance near 160. RSI around 58 is constructive without being overbought, while OBV remains supportive but shows slowing momentum consistent with absorption under resistance. Key resistance sits at 159.10 and 160.00 (breakout confirmation requires acceptance above 160), with 162.00 as a follow-through zone. Support is 158.00 and trendline support in the ~157–158 area; a failure there shifts focus to 154.53, with 151.63 as deeper structural support. Overall, the setup favors trend continuation, but confirmation still requires a clean break above 160 rather than intraday spikes.
Gold: Current Market Condition and Weekly Outlook
Gold eased on Friday, pulling back from record highs set earlier in the week as strong U.S. labour-market data reduced expectations for near-term Fed rate cuts and easing Iran-related tensions softened immediate safe-haven demand. The metal retreated from Wednesday’s peak of $4,642.72/oz, but it still looked set for a ~2% weekly gain, reinforcing that the broader trend remains constructive despite the late-week dip.
The primary driver of the pullback was a rates-and-dollar repricing. Thursday’s U.S. data showed initial jobless claims falling more than expected, reinforcing the view that labour-market resilience may keep the Federal Reserve in a higher-for-longer posture. When rate-cut expectations are pushed out, real yields tend to rise, and that directly pressures gold by increasing the opportunity cost of holding a non-yielding asset. The shift in rates also supported the dollar: the U.S. Dollar Index moved to a six-week high, adding another headwind by making gold more expensive for non-U.S. buyers and typically weighing on bullion during higher-yield or risk-on phases.
Geopolitics provided a second, fading tailwind. Gold’s early-week strength was tightly linked to heightened stress around unrest in Iran, including widespread protests and crackdowns that raised escalation fears. As the week progressed, safe-haven demand cooled after President Donald Trump adopted a more cautious tone on possible military intervention and noted reports suggesting the intensity of crackdowns may be easing. Even so, geopolitics remains an important swing factor: developments in the Middle East—especially political shifts in Iran—and potential tensions in Venezuela can still reprice risk premia quickly, swinging safe-haven allocation.
Structurally, the case for gold remains well supported. The market continues to trade in a “macro-risk + policy-credibility” regime, where record highs reflect not only geopolitics but also a premium for institutional and policy hedging. Three pillars are dominant: (1) a policy credibility / USD-confidence premium tied to narratives that challenge monetary-policy independence; (2) persistent central-bank demand, with World Gold Council updates pointing to continued official-sector purchases (including examples such as Poland and Brazil adding in November), supporting strategic diversification flows; and (3) a still-active geopolitical risk premium that can reassert quickly on negative headlines. The main offset is supply: WGC-linked commentary suggests global output is tracking toward a record high in 2025, which could cap medium-term upside if demand normalizes or if real yields remain firm.
The weekly fundamental question is straightforward: do incoming data and headlines keep real yields stable-to-lower (gold-positive), or do they push yields higher and extend USD strength (gold-negative)? Key catalysts include U.S. income/spending and inflation-sensitive consumption data, January flash PMIs, Fed/policy credibility headlines, and any confirmation that central-bank buying remains steady.
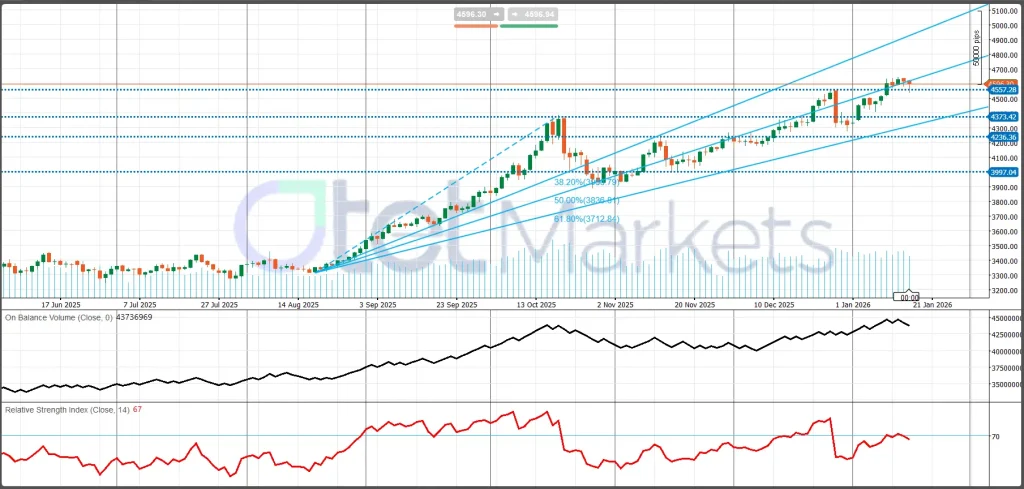
Technically, XAU/USD remains in a strong uptrend within a rising channel. Price is pressing the 4596–4600 decision zone with RSI near 67 (bullish but extended) and supportive OBV. A daily close above 4600 would confirm continuation, opening extension targets (4700, 4800, 5000/5100). A rejection would most likely trigger mean reversion toward 4557 first, with deeper support at 4373, 4236, and 3997 only relevant if the pullback broadens.
Oil Market Conditions & Weekly Outlook
Oil continues to trade under a clear macro overhang: the market is being capped by a “2026 surplus” narrative. Mid-January price action has kept Brent in the low-$60s and WTI in the high-$50s, consistent with a forward balance that leans bearish—even as spot headlines can still generate short-lived spikes. In this regime, rallies tend to fade unless the data deliver a credible tightening impulse.
Fundamentals: balances are comfortable, and the forward curve remains skeptical
U.S. balances look seasonally steady, not tight. In the latest EIA weekly data (week ending Jan 9), commercial crude inventories increased by +3.4 mb to 422.4 mb. Refining activity stayed elevated at roughly 95% utilisation (about 17.0 mb/d of crude inputs), while the gasoline build (+9.0 mb) points to comfortable near-term product availability—an important signal that the market is not facing an acute supply squeeze.
OPEC+ remains in “stability and flexibility” mode. The eight key OPEC+ participants reaffirmed a pause in planned production increments for February and March 2026, explicitly preserving the option to extend the pause or reverse course depending on conditions. This approach effectively sets a policy floor under the market, but it does not, on its own, negate the surplus framing unless real barrels are removed.
Bullish supply signals remain headline-driven—so far. Reuters’ OPEC survey indicated December OPEC output down (around 28.40 mb/d), with declines linked to Iran/Venezuela dynamics. That can support near-term sentiment, but absent sustained disruption that reduces available exports, it has not been enough to shift the broader narrative toward structural tightness.
Medium-term guidance continues to lean bearish. The EIA’s January STEO projects global production exceeding demand with continued inventory builds, forecasting Brent around ~$56/b average in 2026 and WTI around ~$52/b average in 2026. That backdrop tends to limit rally durability unless either demand surprises materially higher or supply is removed in a lasting way.
Weekly outlook: base case is range trade with a modest downside skew, fading rallies unless incoming data show meaningful draws, an unexpected outage, or a strong demand surprise. Two swing factors dominate: (1) U.S. inventory signals—particularly the holiday-delayed EIA Weekly Petroleum Status Report on Thursday, Jan 22, with API on Tuesday night as a directional setup; and (2) geopolitics/sanctions premium, especially Iran/Venezuela/Russia headlines, which matter most if they reduce exports materially rather than just change sentiment. Additional watchpoint: Baker Hughes rig count Friday, Jan 23 (oil rigs around 410), more relevant to medium-term supply than near-term price.
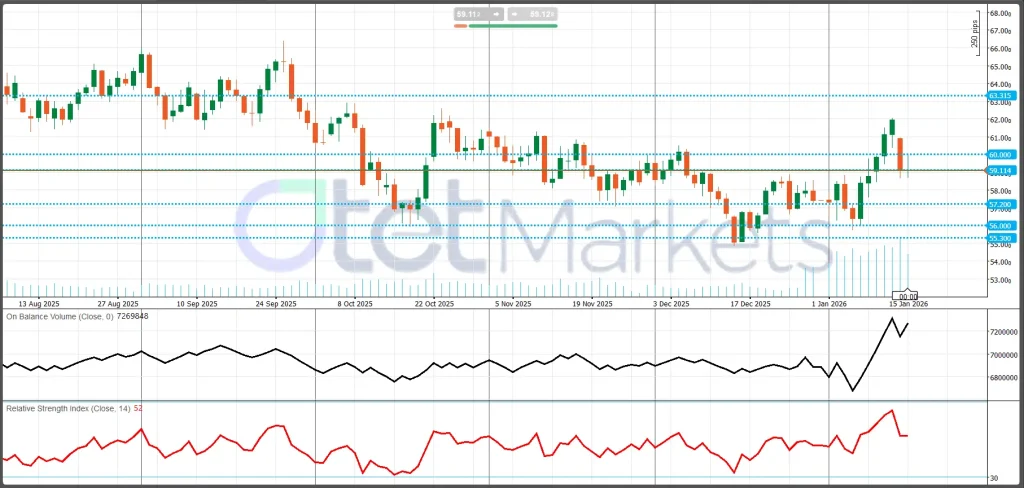
Technically, WTI remains a broad range market, oscillating between the mid-$50s and low-$60s. Current price near 59.11 sits at a major pivot. RSI ~52 is neutral, consistent with range conditions, while OBV improved sharply during the January rebound but has since turned choppy, suggesting the market is deciding whether the bounce was real demand or a squeeze. Key resistance is 60.00, then 63.315 (a close above would signal a regime shift). Key supports are 59.11, then 57.20, with 56.00–55.30 the critical base. Overall: fundamentals favor “fade rallies,” and the chart reinforces 60 as the pivot—acceptance above is needed for extension; loss of 59 increases the odds of rotation back toward 57.2 and the mid-$50s floor.
Cryptocurrency Market Condition and Weekly BTC Outlook
Bitcoin enters the week with a supportive but still headline-sensitive setup. The key stabilizer has been the return of institutional flow, particularly through spot Bitcoin ETFs, while the primary volatility risks remain U.S. regulation headlines and the rates/liquidity channel.
On fundamentals, ETF demand has become the clearest real-time signal for whether dips are likely to be absorbed. Recent reporting points to strong spot Bitcoin ETF inflows, including one of the strongest single days since October and a firm weekly pace. In the current regime, sustained inflows improve market depth on pullbacks and increase the probability that BTC can pressure the top end of its range.
Regulation remains a two-way catalyst. A U.S. Senate market-structure push has periodically improved sentiment—especially when price action is constructive—but the process is noisy. Reports of delays or stalling have also weighed on crypto risk appetite and kept the risk premium elevated. The result is a classic “headline beta” environment, where momentum can accelerate quickly on constructive developments, but reversals can be equally sharp if legislative progress falters.
Derivatives have improved, but conditions are not “blow-off.” Commentary points to rising open interest and a shift toward a more neutral options skew versus earlier bearish bias—often consistent with a market that can grind higher. However, higher positioning also raises event-driven liquidation risk if negative headlines hit while leverage is extended. Overall, BTC is supported by institutional demand and improving derivatives tone, but remains macro-sensitive and policy-driven.
Weekly outlook: the base case is consolidation with upside optionality, with BTC likely to range trade around the mid-$90k area. Upside becomes more plausible if ETF inflows remain firm and macro conditions do not tighten materially. The main movers this week are: (1) U.S. macro releases that can reprice yields and the dollar—softer data is generally BTC-positive, hotter data BTC-negative; (2) U.S. legislative/regulatory headlines, which can move spot and crypto-linked equities quickly; and (3) flow and positioning, where persistent ETF inflows could support another attempt toward $100k, while rising open interest/funding can amplify downside on adverse news. The operating assumption is positive but choppy flows, noisy legislation, and mixed macro—favoring mean reversion and “buy dips/sell rips.”
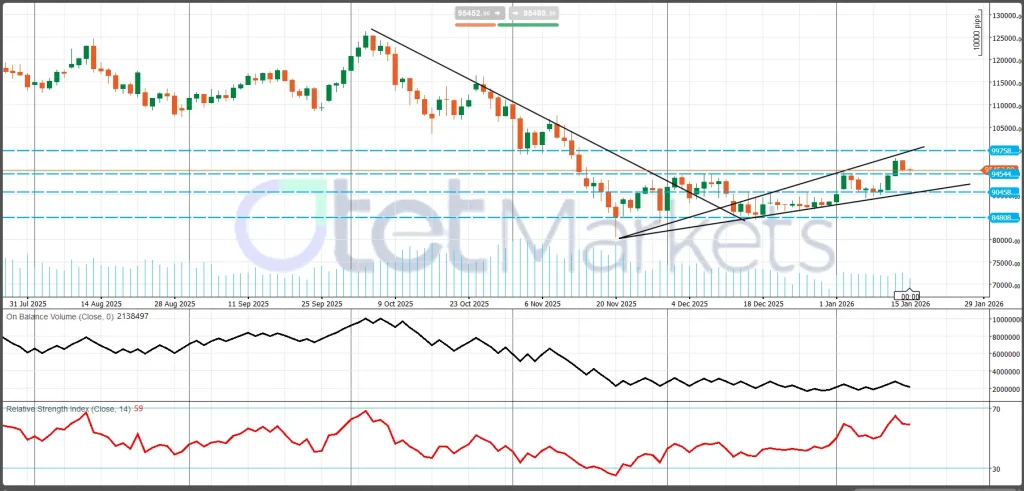
Technically, the downtrend from the October top has been neutralized. BTC peaked near ~$125k, sold off into the 84,808 low, then recovered into a higher-low/higher-high structure back into the mid-$90k. Momentum is constructive with RSI ~59, but OBV remains subdued, suggesting participation confirmation is not fully rebuilt. Key resistance is 99,758 and 100,000; key pivot is 95,444; supports are 90,458 and the structural floor at 84,808. Bottom line: constructive, but still in consolidation unless BTC clears 99,758/100k with convincing follow-through and participation.
Share
Hot topics

Gold symbol in forex
Introduction If you have ever opened a trading platform and searched for gold, you probably noticed a specific code instead of the word “gold.” In the forex world, assets are...
Read more


Submit comment
Your email address will not be published. Required fields are marked *