
Global Economic Outlook: Navigating Uncertainty Amid Trade Tensions and Slowing Growth
- Global Economic Review: June 27 – July 3, 2025
- U.S. Economic Outlook: July 7–13, 2025
- USD and Wall Street: Outlook for the Week Ahead
- RBA Rate Decision Review & Outlook for July 8, 2025
- How an RBA Rate Cut Impacts the AUD
- Gold Weekly Outlook: Key Themes & Trends
- Oil Market Snapshot & Outlook
- Bitcoin Market Conditions and Outlook
Data from last week highlighted a complex and increasingly uncertain global economic backdrop. In the U.S., the labor market’s surface-level strength masks underlying weaknesses, as hiring remains concentrated in a few sectors and jobless claims continue to rise—signs of potential softening ahead. In Asia, indicators point to fragile stability, yet persistent structural challenges cloud the outlook. Meanwhile, Europe’s inflation dynamics indicate central banks will tread carefully with policy adjustments in the coming months. Against this backdrop, renewed trade tensions, ongoing commodity price volatility, and ambiguous monetary policy trajectories add to the risks. Businesses and investors should brace for a difficult second half of 2025, with global growth prospects skewed to the downside.
Global Economic Review: June 27 – July 3, 2025
The global economy faced renewed turbulence last week as trade tensions escalated and key economic indicators revealed a mix of resilience and emerging vulnerabilities. The U.S. administration ended its 90-day tariff pause, issuing letters to nearly 180 trade partners—including allies like Canada, the UK, and Indonesia—signaling new tariffs, especially on steel and aluminum. This announcement revived fears of a broader trade war, with reciprocal measures from the EU and UK threatening supply chains. Businesses rushed to build inventories, ports became more congested, and freight costs climbed, highlighting how quickly tariff dynamics can disrupt global trade, production, and investment confidence.
Yet despite these uncertainties, some indicators showed surprising strength. Goldman Sachs reported that second-quarter GDP growth and measures of consumer spending and factory hiring largely resisted immediate drag from escalating trade frictions. The U.S. labor market offered an encouraging headline as June payrolls rose by 147,000—close to the three-month average—and unemployment dipped to 4.1%. These figures exceeded expectations and helped push U.S. stock indices like the S&P 500 and Nasdaq to record highs, reflecting investor optimism about the economy’s underlying momentum.
However, a deeper look at the jobs report revealed concerns. Hiring was concentrated in education, healthcare, and leisure, while manufacturing and temporary employment declined for a second straight month, pointing to a labor market lacking breadth. Meanwhile, continuing jobless claims rose to their highest level since 2021, signaling it is becoming harder for unemployed workers to secure new positions amid persistent uncertainty and elevated borrowing costs.
Other economic data reinforced the picture of an economy balancing resilience with clear risks. ISM surveys showed manufacturers facing rising input costs and softer demand, driven in part by renewed tariff pressures. Although the ISM manufacturing index improved slightly in June on better production, concerns about supply chain frictions and cost inflation persisted. The ISM services index rebounded into expansion territory, but growth remained tepid, with 14 of 18 service industries reporting higher prices. Construction spending continued its downward trend for a seventh consecutive month in May, weighed down by high rates and economic uncertainty.
Trade figures are added to these concerns. Both imports and exports fell in May, widening the U.S. trade deficit modestly to $71.5 billion. The declines reflected the unwinding of earlier stockpiling by firms trying to beat tariff deadlines, highlighting distortions in recent trade flows. While robust headline jobs data initially dampened expectations for a July rate cut, the underlying economic weakness reinforced the market view that the Federal Reserve is likely to deliver its first cut in September as tariffs and slowing domestic demand drag on growth.
In Asia, sentiment surveys pointed to tentative stabilization. China’s June PMIs suggested modest improvement, with the official manufacturing index rising to 49.7 and Caixin manufacturing climbing back to expansion at 50.4. The non-manufacturing PMI edged up, and the services PMI stayed positive, supported by domestic policy measures and easing trade tensions. Still, China’s growth is expected to slow from 5% in 2024 to 4.7% in 2025 amid structural headwinds.
Japan’s Q2 Tankan survey showed rising confidence among large manufacturers, with the index hitting +13—above expectations—driven by paper and steel industries. This supports forecasts for the Bank of Japan to raise rates by 25 basis points in October. In Europe, June inflation data aligned with expectations: Eurozone headline CPI rose 2%, meeting the ECB’s target, while core inflation held at 2.3%. These figures support cautious ECB easing, with markets expecting no change in July and a final 25 bp cut in September. Switzerland’s June CPI returned to positive territory at 0.1%, limiting prospects for further SNB easing.
U.S. Economic Outlook: July 7–13, 2025
The upcoming week will provide several key updates on the U.S. economy, offering important signals on consumer behavior, small business sentiment, labor market dynamics, and fiscal policy. The May Consumer Credit Report will shed light on trends in household borrowing across credit cards and auto loans. While strong credit growth could indicate continued consumer resilience, it may also point to rising debt burdens that could weigh on spending later this year if economic conditions weaken.
Small business sentiments, as measured by the NFIB Small Business Optimism Index, has experienced significant volatility in recent months. After surging nearly 15 points following the 2024 election, optimism reversed sharply in early 2025, giving back two-thirds of its gains by April amid the negative impact of new tariffs. Expectations for economic improvement among small business owners fell dramatically from 52% in December to just 15% by April. Although some optimism returned in May following eased U.S.-China trade tensions, the NFIB’s uncertainty index rose to 94, signaling heightened anxiety about the economic outlook. This recent volatility has been driven more by shifting expectations than by actual changes in economic conditions. While small firms grew more hopeful about future business prospects and sales in May, they reported weaker actual sales, earnings, and capital expenditures. Moving forward, small business optimism is expected to remain highly sensitive to policy developments. A continued period of relative calm on the tariff front and progress on tax legislation could bolster sentiment in June, but elevated uncertainty is likely to persist.
Investors will closely watch the release of the Federal Reserve’s June FOMC Minutes, which could provide key insights into policymakers’ discussions about trade tensions, tariffs, inflation, and labor market dynamics. These minutes may influence market expectations regarding the timing of the next rate cut, with attention focused on any language that could shift forecasts for a potential move as early as September. Additionally, the final reading of May wholesale inventories will be published; softer-than-expected figures could strengthen the case for monetary easing by signaling weakening demand.
Labor market data will remain central to the week’s economic narrative. Jobless claims, a timely indicator of employment trends, have averaged 242,000 over the past four weeks. While this figure remains low by historical standards, it is 2% higher than a year ago. More notably, continuing claims have increased at a faster pace, suggesting that laid-off workers are struggling to find new employment opportunities. This trend coincides with the median duration of unemployment rising to 10 weeks on a three-month average, indicating growing challenges for job seekers. Although labor demand is easing, low levels of both hiring and firing have so far prevented a sharp rise in layoffs. Research suggests that a 25% year-over-year increase in initial claims—bringing them to around 290,000–300,000—would signal a significant recession risk. Current levels remain below this threshold, but the upward drift in claims warrants close monitoring, as it could foreshadow slower payroll growth ahead, especially given the added pressure of tariffs squeezing employer margins and dampening demand.
The Treasury Statement for June will also provide valuable insight into government borrowing and fiscal flows, which will be particularly relevant as policymakers consider upcoming budget decisions. The report will capture the initial effects of recent tax and spending measures passed under the “One Big Beautiful Bill,” offering an early look at how fiscal policy is impacting government finances and overall economic conditions.
Taken together, the week’s reports and data releases will give investors, businesses, and policymakers fresh evidence on the resilience of consumer spending, the mood among small businesses, and the evolving strength of the labor market, while ongoing trade tensions and policy uncertainty continue to cast a shadow over the economic outlook. The interplay of these factors will help shape expectations for growth in the second half of 2025 and beyond.
USD and Wall Street: Outlook for the Week Ahead
The coming week will be pivotal for markets, with tariff decisions, Federal Reserve signals, and consumer data set to shape near-term expectations. While investors remain cautiously optimistic, uncertainty surrounding trade policy and central bank direction continues to weigh on sentiment. The outcome of the July 9 tariff deadline is particularly critical: a delay or de-escalation could lift equities and weaken the dollar, while an escalation may trigger volatility and strengthen the dollar as a safe haven. Given stretched valuations across many asset classes, strategic positioning and careful monitoring are recommended over aggressive exposure.
Equities have rallied strongly into July, supported by seasonal trends and expectations for robust Q2 earnings. Historically, July has delivered average gains of about +2.5% over the past two decades. Despite first-half volatility, both the S&P 500 and Nasdaq have surged to record highs, fueled by optimism about a pause in tariff announcements, strong corporate results, and resilient labor markets. Strategists, including those at Morgan Stanley, Bank of America, and Goldman Sachs, remain constructive for the second half of 2025, expecting earnings growth and potential Fed rate cuts to support further upside, though tariff-related risks could spark near-term turbulence.
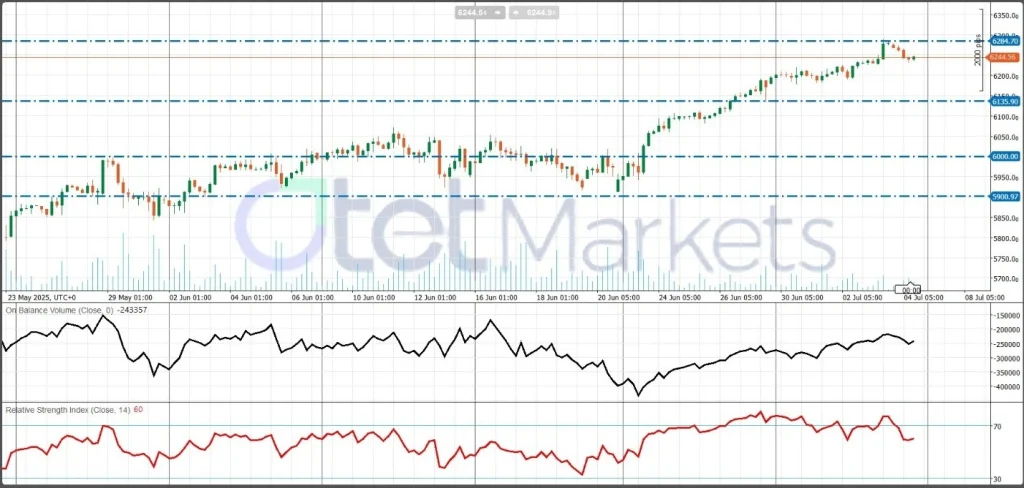
Key drivers this week will include Q2 earnings reports, the tariff decision, and Fed communications. Consumer trends will also be closely watched as Amazon’s Prime Day and major retail promotions provide an informal gauge of household spending strength. Solid credit metrics and retail sales would support equities, while signs of financial stress could slow down fears. Technically, the OBV indicator’s failure to confirm new highs, for S&P500 along with a retreating RSI, suggests a potential correction. A break below 6,100 could open the path to 6,000 or 5,900, while holding above 6,100 would keep bulls in control.
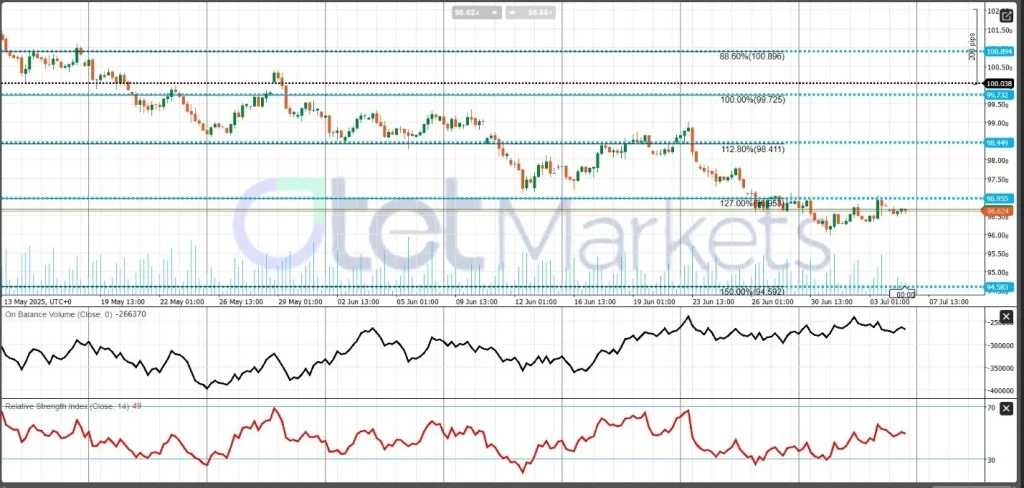
Meanwhile, the U.S. dollar has been under sustained pressure since April, declining about 11% year-to-date—the worst start since 1973—amid rising fiscal concerns, unpredictable tariff policy, and expectations of Fed cuts. Analysts see further near-term weakness unless selective tariffs are imposed. Traders are wary of holding long-dollar positions ahead of the tariff deadline, with the DXY likely to hover around 97–98. A failure to reclaim levels above 97 could send the DXY below 95, while short-term technical hint at a possible rebound toward 96.50–98.50 as the RSI recovers from oversold territory.
RBA Rate Decision Review & Outlook for July 8, 2025
The Reserve Bank of Australia is widely expected to cut its cash rate at this week’s meeting. A recent Reuters poll shows that 31 of 37 economists anticipate a 25-basis point reduction, which would lower the rate from 3.85% to 3.60%. This would mark the RBA’s third consecutive rate cut this year.
This anticipated move follows a series of softer-than-expected economic data, reinforcing the case for near-term easing. May inflation surprised to the downside, with headline CPI slowing to 2.1% year-over-year—just above the RBA’s 2% target floor—and trimmed mean inflation, a key core measure, easing to 2.4% from 2.8%. These figures suggest underlying price pressures are moderating faster than previously expected. Meanwhile, Q1 GDP growth came in at just 0.2% quarter-over-quarter, or 1.3% annually, with per-capita output declining, signaling weakening consumer demand and headwinds from external factors.
Additionally, retail sales data have disappointed. May retail spending rose only 0.2%, missing forecasts of 0.5%, which has further heightened expectations for a July rate cut as consumer momentum continues to fade.
Outlook & Market Positioning
All four major Australian banks—ANZ, CBA, NAB, and Westpac—have forecast a 25-basis point cut in July, with most expecting follow-up reductions in August and beyond, potentially bringing the cash rate into the mid-3% range. Market pricing now reflects nearly a 100% probability of a July cut, with around 65% anticipating another move in August. MUFG forecasts additional cuts that could take the cash rate toward 3.10% by year-end, driven by slowing growth and contained inflation.
Overall, a 25-basis point cut in July appears highly likely, followed by a possible second cut in August, bringing the policy rate down to 3.35%. However, risks remain two-sided. There is a notable possibility that the RBA could either pause after a single cut or hold rates steady if upcoming data fail to show further economic softening. The central bank is expected to maintain a data-dependent stance, balancing the need to support growth while ensuring inflation expectations remain anchored.
How an RBA Rate Cut Impacts the AUD
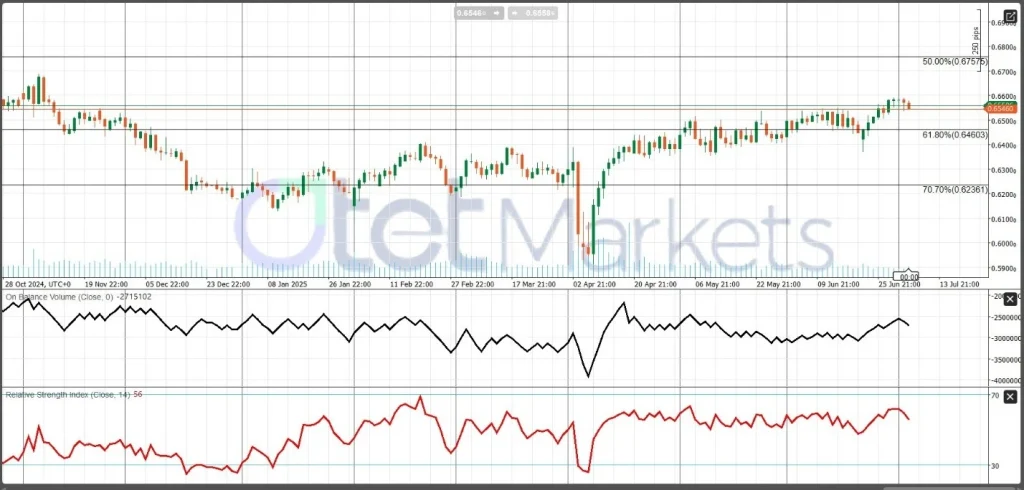
The Australian dollar typically weakens following an RBA rate cut, as lower rates narrow the yield differential between Australia and other major economies, reducing demand for the AUD among carry traders and global investors. The Aussie dollar has maintained its uptrend since May 2025, buoyed by broad U.S. dollar weakness. However, experts caution that the RBA could act more decisively if a strong AUD starts to undermine growth, potentially putting the recent trend at risk.
Generally, an RBA rate, especially if accompanied by dovish guidance, is likely to weigh on the AUD by signaling lower yields and expectations of further easing. Still, factors like ongoing USD softness and resilient global risk sentiment could limit losses or even support the currency.
Technical Picture
- Recovery Potential: Technical indicators show the AUD rebounding from oversold levels, suggesting room for a move toward US 0.675–0.680, unless the RBA’s tone proves more dovish than expected.
- Resistance: US 0.665–0.670—key area to watch for signs of reduced selling pressure.
- Support: US 0.650—critical level aligned with easing expectations and momentum signals.
Gold Weekly Outlook: Key Themes & Trends
Gold remains a pivotal asset amid ongoing geopolitical volatility, strong central bank demand, and persistent macroeconomic uncertainty. Prices continue to trade firmly above $3,300 per ounce, having surged more than 25% since early 2025, driven by rising geopolitical tensions and a weakening U.S. dollar. However, after reaching a record high above $3,500 in April, gold has eased about 5% from its peak. Stronger-than-expected U.S. payroll data contributed to recent softness, pulling prices back toward $3,328 as the dollar strengthened and expectations for imminent Federal Reserve rate cuts were deferred. While resilient U.S. economic data and equity market gains may cap near-term upside for gold, geopolitical risks and uncertainty around trade policy, particularly ahead of the looming July 9 tariff deadline, continue to support gold’s safe-haven appeal and keep it firmly in many investment portfolios.
Cooling U.S. inflation, with CPI currently near 2.4%, alongside the potential for future Fed rate cuts, provides underlying support for gold’s bullish medium-term case. Yet, lingering caution among policymakers and robust labor market data have limited immediate upside momentum. On the fundamental side, central bank demand remains exceptionally strong, with annual sovereign purchases exceeding 1,000 tons—underpinning gold’s long-term appeal as a store of value and inflation hedge. Major investment banks share a constructive outlook: HSBC projects average prices of $3,215 per ounce in 2025 and $3,125 in 2026, with upside potential reaching $3,600. J.P. Morgan, Morgan Stanley, and Goldman Sachs forecast that gold could test $4,000, citing risks from rising fiscal deficits and continued dollar weakness, while State Street Global Advisors (SSGA) expects a “higher-for-longer” regime above $3,000, targeting $4,000 to $5,000 per ounce within the next 12 to 24 months. However, some analysts, caution on technical signals pointing to a possible short-term correction and recommend watching the $3,301–3,286 support zone for potential buying opportunities.
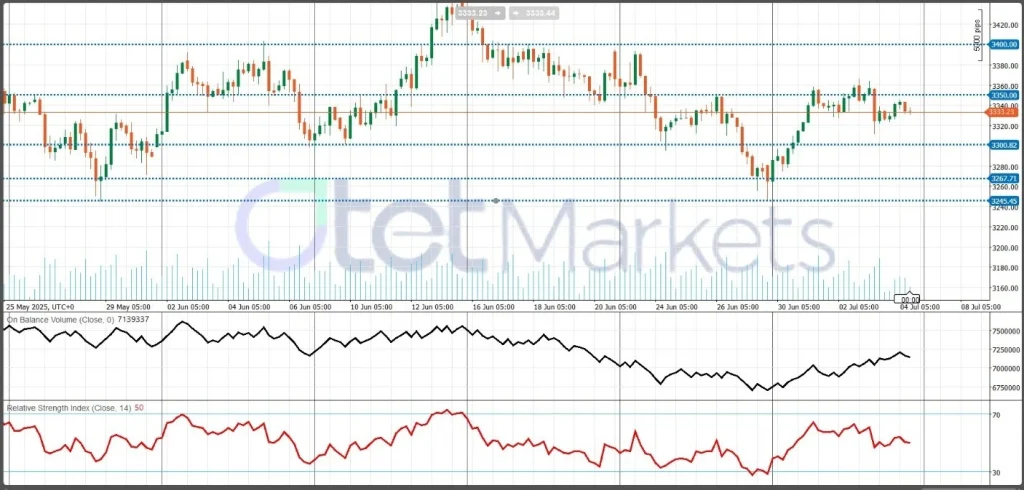
From a technical perspective, gold remains in a bullish structure but shows signs of potential near-term consolidation or pullback. The key pivot level lies at $3,300, with immediate resistance seen around $3,350–3,400. A decisive break above this resistance could pave the way for a retest of the $3,500 mark. Conversely, a drop below the critical $3,300 support could shift focus to $3,270, and if that level fails to hold, further downside could extend toward $3,245. Overall, gold’s fundamental and technical backdrop continues to favor constructive bias, but investors should be prepared for potential short-term volatility driven by upcoming economic data and geopolitical headlines.
Oil Market Snapshot & Outlook
Global oil markets are navigating a delicate balance between rising supply, moderate demand, and persistent geopolitical risks. This week’s price action will be heavily influenced by key data releases from OPEC, the IEA, and the EIA, as well as geopolitical developments in the Middle East. Oil prices have rebounded modestly following recent volatility, with WTI trading around $66.50 per barrel and Brent nearly $69. OPEC+ continues to phase out previous production cuts, implementing monthly increases of around 411,000 barrels per day (bpd), with reports suggesting an August hike of up to 550,000 bpd. This push for higher output, led by Saudi Arabia, Russia, and the UAE, highlights efforts to regain market share despite growing global supply, although overproduction by some members is creating internal friction.
In its latest report, the IEA noted global oil supply exceeding demand by about 1 million bpd, with non-OPEC+ producers ramping up output. Meanwhile, the EIA confirmed unexpected builds in U.S. inventories, though stock levels remain below last year’s levels. A recent Dallas Fed survey showed declining U.S. drilling activity amid trade uncertainty and weak investment sentiment, suggesting potential softness in future U.S. supply growth.
On the demand side, geopolitical tensions—especially between Israel and Iran—continue to lend safe-haven support to oil prices, fueling concerns over possible disruptions to Middle Eastern supplies. However, global economic headwinds, particularly slowing growth in the U.S. and China, are weighing on demand prospects. Reflecting these dynamics, OPEC recently revised its 2025 demand growth forecast downward to 1.3 million bpd, raising concerns about oversupply that could persist into 2026.
For the week of July 7–13, key drivers include the outcome of the July 6 OPEC+ meeting, developments in Iran-Israel tensions, U.S. inventory updates, and economic data releases from the U.S. and China. Short-term trading is expected to remain in a neutral to mildly bullish range as geopolitical risks and OPEC+ discipline counterbalance rising production and tepid demand. However, the medium-term outlook remains neutral to bearish, with surplus conditions forecast to continue unless demand accelerates or OPEC+ changes course.
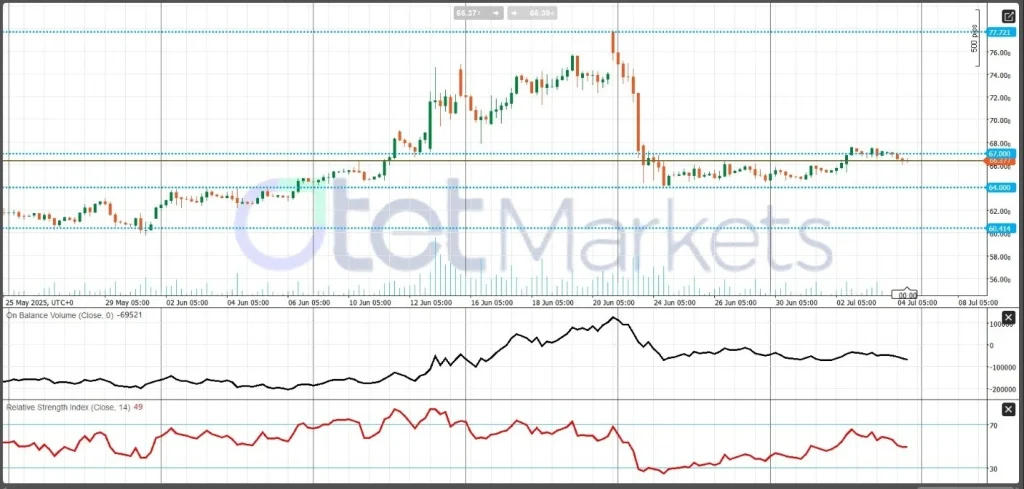
Technically, WTI is consolidating between $64–67, with the market in backwardation, reflecting near-term tightness despite long-term oversupply risks. RSI indicators on the H4 chart remain below 50, while OBV is flat with a downward tilt. A break below $64 could send prices toward $60, while a move above $67 could trigger a stronger rally.
Bitcoin Market Conditions and Outlook
Bitcoin is currently priced around $108,000, with intraday trading ranging between $107,341 and $109,121, reflecting a slight pullback of about –1% from recent highs. Overall, the leading cryptocurrency remains in a consolidation phase near the $100K–$110K zone.
Bitcoin remains fundamentally supported by strong institutional demand and favorable regulatory developments, while technically it sits near key resistance levels. The near-term market is likely to stay range-bound unless a significant catalyst emerges. A breakout above $110K–$114K could unlock a powerful rally, while a breach below support could risk a slide toward $100K.
Significant institutional involvement continues to underpin Bitcoin’s market strength. Approximately $2.7 billion in crypto inflows occurred last week alone, with over 80% directed into Bitcoin-related ETFs. Matrixport analysts suggest that favorable seasonality in July could push BTC toward $116K, while other experts project a potential breakout to $120K–$143K if key resistance is cleared.
Echoing these bullish projections, long-dormant wallets reactivated this week, moving over 20,000 BTC—a collective value exceeding $2 billion. Although these coins have not yet been liquidated, their activation signals potential large-volume activity that traders will monitor closely.
Short-term volatility remains subdued. Realized volatility is near multi-year lows, and implied volatility suggests calm market conditions, encouraging more cautious institutional participation. This stability may foster a gradual upward trend, barring sudden macroeconomic shocks or adverse regulatory changes. ETF inflows remain a primary driver of momentum; any slowdown could impact price strength. Additionally, movements from long-held BTC wallets (e.g., large addresses active since 2011) could signal potential supply shifts.
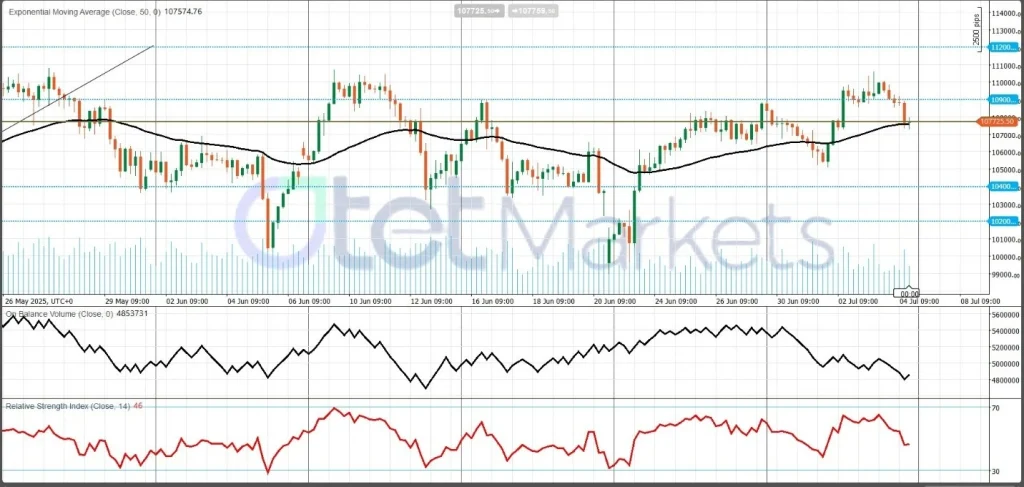
Technical Outlook:
Bitcoin is consolidating within a defined range of $104K–$109K. A decisive breakout above $109K could target $110K and then $114K; surpassing these levels could trigger a sharp rally toward $140K+. Conversely, a weekly candle closing below $104K would open the door for declines toward $102K, and potentially down to $100K.
Share
Hot topics

What is News Trading in Forex? A Complete Guide to Event-Driven Strategy
Introduction If you have ever watched the forex market during a major economic announcement, you know how dramatic it can be. Prices jump within seconds. Spreads widen. Volatility explodes. For...
Read more


Submit comment
Your email address will not be published. Required fields are marked *