
Earnings and Central Banks: Markets Navigate a Volatile Week
Global equities edged higher on Friday, wrapping up a turbulent week marked by trade tensions and economic uncertainty. The ongoing trade war between the U.S. and China created significant doubts about the health of the global economy.
Markets were rattled early in the week by fears of a sharp global downturn, only to experience a brief relief rally after U.S. President Donald Trump announced a 90-day pause on most of his proposed tariff hikes.
Despite the temporary truce, trade policy uncertainty lingered. Both the U.S. and China continued escalating tariffs throughout the week. On Thursday, the White House indicated that the cumulative tariff rate on Chinese goods would effectively reach 145%, while China responded by raising its tariffs to 124%.
Investors found some reassurance on Friday after economic data revealed that the UK economy grew faster than expected in February.
Meanwhile, attention turned to the kickoff of the U.S. earnings season, with major banks like JPMorgan Chase (NYSE: JPM), Citigroup (NYSE: C), and Wells Fargo (NYSE: WFC) reporting their results. This earnings focus will intensify in the coming days as more key companies release their quarterly figures.
Looking ahead, investor focus is likely to shift between corporate earnings, ongoing trade tensions, central bank policy meetings, and economic commentary from key officials—all in the shadow of uncertainty created by President Trump’s trade policies.
U.S. Economy Review: Trade Tensions Dominate as Inflation Eases
Recent developments in U.S. trade policy, notably President Trump’s 90-day suspension of certain tariffs (excluding those on China), took center stage this week, overshadowing economic data releases. Despite the temporary pause, the United States remains in its most protectionist environment in over a century. China continues to face a steep 145% cumulative tariff rate, while tariffs on other trading partners remain at a 10% baseline.
On the data front, inflation readings for March surprised the downside. Headline CPI fell by 0.1%—the sharpest monthly decline since May 2020, while core CPI rose just 0.1%, marking its slowest pace since January 2021. The softness in prices, particularly in discretionary categories and energy, may reflect early signs of weakened consumer demand under the weight of tariffs. Producer prices mirrored this trend, with final demand falling 0.4% in March. Together, these data suggest that the Fed’s preferred inflation gauge, the PCE deflator, likely remained flat last month. Nonetheless, analysts anticipate a pickup in inflation later this year as businesses pass higher import costs onto consumers.
Meanwhile, business and consumer sentiment indicators are signaling growing economic unease. The NFIB Small Business Optimism Index declined for a third consecutive month in March, slipping below its historical average, while the University of Michigan’s consumer sentiment index fell to one of its lowest readings in four decades. Tariffs appear to be a key concern, with nearly two-thirds of respondents spontaneously mentioning them—up from around 40% in previous months.
March’s subdued inflation reading gives the Federal Reserve some latitude to adopt a more dovish tone should broader economic conditions deteriorate. However, the minutes from the March 18–19 FOMC meeting reflected a modestly hawkish stance, as participants expressed concern that tariff-induced inflation could prove more persistent than initially expected. Given these minutes were recorded before the April 2 tariff announcements, they may not fully account for the evolving economic landscape. Ultimately, if economic momentum weakens significantly, the Fed is likely to prioritize labor market stability, even at the risk of higher inflation.
On the fiscal policy front, Congress reached a budget resolution that sets the stage for extending the 2017 tax cuts and introducing $1.5 trillion in additional tax relief over the next decade. The plan also includes increased spending on defense and border security. However, any material impact from these measures is unlikely to be felt before 2026. In the meantime, trade policy will likely remain the primary driver of the U.S. economic outlook.
U.S. Economic Outlook in the Week Ahead
The upcoming week presents a complex economic landscape shaped by the recent imposition of tariffs and their potential impact on inflation and growth.
Recent comments from Federal Reserve officials reflect growing concerns over the inflationary effects of the new tariffs. New York Fed President John Williams noted that these measures could raise inflation and slow economic growth, potentially leading to higher unemployment.
In the private sector, BlackRock CEO Larry Fink warned that extensive tariffs could push the U.S. economy into recession, highlighting the market volatility already triggered by the trade measures.
This week’s key focus will be the March retail sales report, offering insight into consumer behavior under current economic conditions. Market participants will also closely watch corporate earnings reports for signals on how businesses are navigating the challenges posed by tariffs and economic uncertainty.
Given the shifting landscape, the Federal Reserve’s policy stance remains under scrutiny, particularly amid potential changes in inflation and labor market trends.
As for economic events, no major U.S. data releases are scheduled. However, Retail Sales and Industrial Production (March) are due Wednesday, April 16, followed by Housing Starts on Thursday, April 17. Markets will be closed Friday, April 18, in observance of Good Friday.
Retail sales are expected to rebound in March, fueled by pre-tariff auto purchases. After a modest 0.2% rise in February, March sales are projected to climb 1.3%, while core spending (excluding autos) likely rose just 0.4%. Though the control group showed strength in February, broader consumer spending remains fragile amid softening confidence and growing tariff concerns. Consumer activity is expected to weaken in the second half of Q2.
Industrial Production data, also out Wednesday, follows a stronger-than-expected 0.7% rise in February, driven by a sharp rebound in auto manufacturing. However, March output is forecast to decline 0.3% amid persistent headwinds, including high capital costs, labor shortages, and trade-related uncertainty.
On Thursday, Housing Starts data will be released. Following a weather-driven drop in January, starts surged 11.2% in February. Yet, flat building permits point to subdued builder sentiment and continued uncertainty. Despite slightly lower mortgage rates, elevated construction costs and policy headwinds are likely to curb activity. March starts are projected to fall to an annualized pace of 1.410 million units, with a weaker labor market likely to further weigh on residential investment this year.
Earnings Reports
In the week ahead, Wall Street will focus on the unfolding Q1 earnings season amid heightened economic uncertainty. Major U.S. banks, including Goldman Sachs, Bank of America, and Citigroup, are set to report results that could provide early indicators of financial strain or resilience in the face of recent market volatility and recession concerns. Investors will closely monitor these reports for insights into loan growth, credit quality, and overall financial health.
Here’s a summary of key earnings reports to watch for the week of April 14–18, 2025:
- Monday, April 14: Goldman Sachs (GS), M&T Bank (MTB)
- Tuesday, April 15: Bank of America (BAC), Johnson & Johnson (JNJ)
- Wednesday, April 16: ASML Holding (ASML), Abbott Laboratories (ABT)
- Thursday, April 17: Taiwan Semiconductor Manufacturing Company (TSM), American Express (AXP)
- Friday, April 18: Comtech Telecommunications Corp. (CMTL), KB Home (KBH), Aehr Test Systems (AEHR)
These earnings reports will provide insights into the financial health and performance of companies across various sectors, including banking, healthcare, technology, and consumer goods. Investors and analysts should closely scrutinize these releases for signals of market trends and economic conditions.
Wall Street Outlook
Despite economic headwinds, major U.S. stock indices closed the previous week with notable gains:
U.S. equities rebounded sharply last week, with the Nasdaq gaining 7.3%, the S&P 500 rising 5.7%, and the Dow Jones Industrial Average climbing 5%—marking their best weekly performances in over a year, while the Nasdaq posted its best weekly performance since November 2022. However, this recovery follows significant losses earlier in April, driven by escalating trade tensions and the imposition of steep tariffs. Despite a 90-day pause on some tariffs, uncertainty remains high, with major indices still down significantly from their March highs.
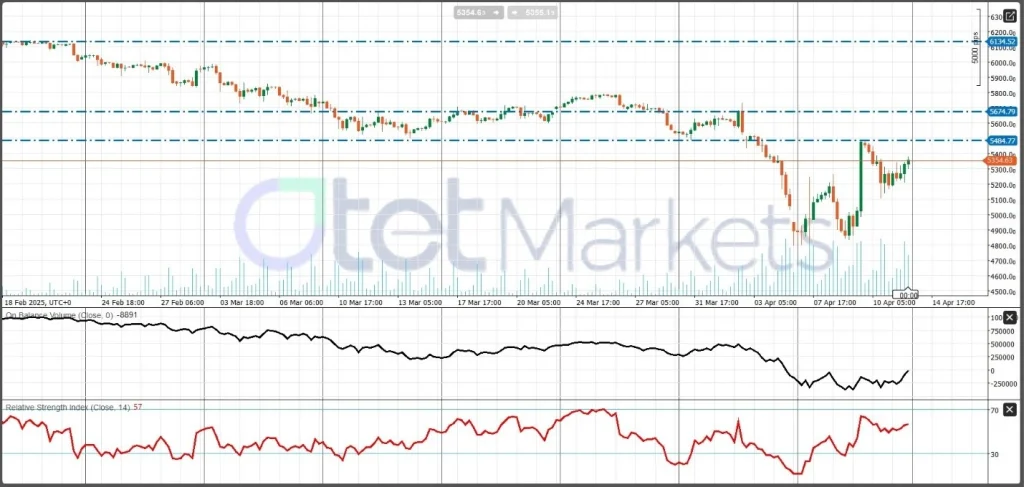
From a technical perspective, despite the short-term recovery, the broader trend remains bearish, with resistance levels at 5,484 and 5,670. For the week ahead, with a recovery from these resistance points, we can expect numbers to fall below 5,000.
U.S. Dollar Outlook
The U.S. dollar has shown signs of weakness amid ongoing economic uncertainties. Analysts suggest that the dollar may continue to face downward pressure as investors seek safer assets amid trade-related concerns.
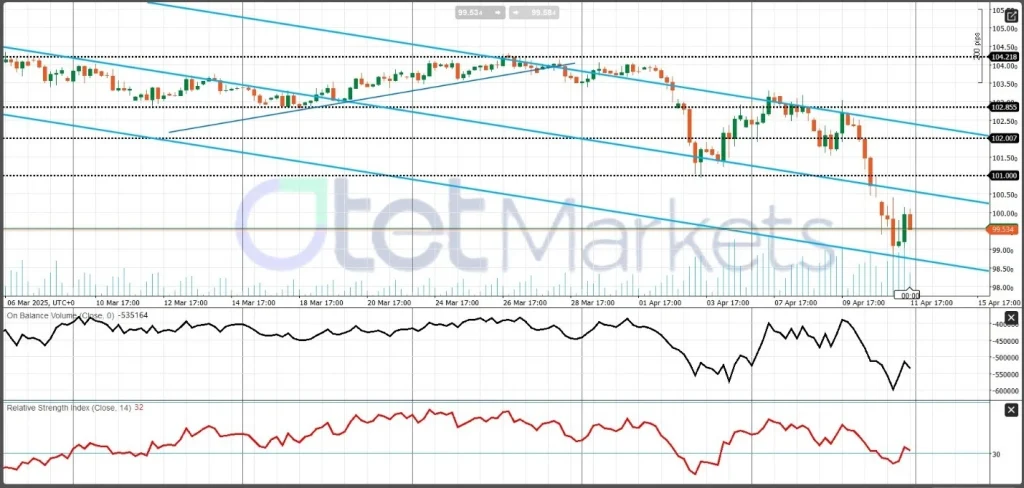
From a technical standpoint, the dollar is in a clear bearish trend, with the pivot point at 102. Trading below this level could exert further pressure on the U.S. Dollar Index.
ECB, and EU-US Relations: Trade Tensions and Impact on EUR
The EU’s relationship with the US is currently on fragile ground, with the EU having initially prepared countermeasures against President Trump’s proposed tariffs, including a retaliatory 25% tariff on US goods. However, Trump’s recent decision to postpone these tariffs for 90 days has temporarily eased tensions, leading the EU to rescind its retaliatory plans. Despite this pause, the potential for renewed volatility in the EUR and European equities markets remains if the EU and President Trump do not reach a concrete agreement in the coming months.
ECB Interest Rate Decision and Market Implications
On the monetary front, the European Central Bank (ECB) is set to make its interest rate decision next week. Economists widely expect a 25-basis-point rate cut, with EUR OIS indicating a 94.75% probability of this scenario. While a rate cut is nearly priced in, the focus will shift to the ECB’s accompanying statement. If the ECB continues to express concern about the resilience of the European economy amid ongoing trade uncertainties, further rate cuts could be expected, which would likely weigh on the EUR. However, should the ECB signal concerns over rising inflationary pressures, it might opt to hold rates, potentially providing support for the EUR.
Macroeconomic Data: Germany’s Inflation and Economic Sentiment
On the macroeconomic front, Germany’s March Consumer Price Index (CPI) came in lower than expected, signaling easing inflationary pressures in one of the eurozone’s most important economies. However, this data was overshadowed by the ongoing tariff narrative, and its impact on the EUR was muted. Looking ahead to next week, Germany’s ZEW economic sentiment index will be closely watched as a gauge of consumer sentiment. Any improvement in this figure could support the EUR, while a decline could put further pressure on the currency.
EUR Outlook
Analysts believe that the tariff situation has largely dictated the movement of the EUR this week, despite easing inflation in Germany. The EUR has strengthened against the dollar, pound, and yen, reflecting the dominant narrative from EU leaders and President Trump. Given the dynamic and uncertain trade environment, it is anticipated that the ECB may adopt a “wait-and-see” approach, even if they decide to cut rates next week. This cautious stance stems from the possibility of significant developments in the trade wars, which could influence the ECB’s decision-making in the coming weeks.
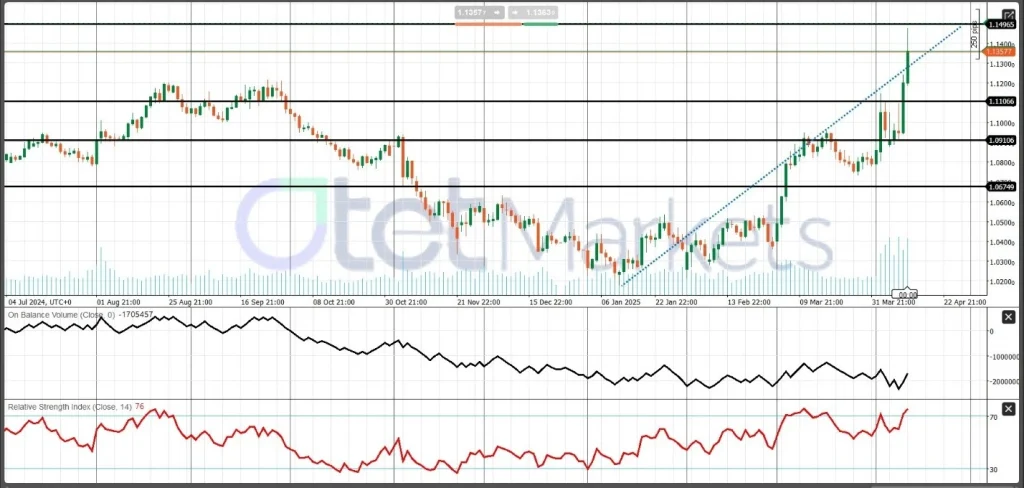
On the technical front, the current bull run lacks strong market volume, raising expectations for correction. However, with a lackluster outlook for the US dollar, the overall bullish trend could persist, with a target of 1.15 after a short-term correction. Support levels are found at 1.10 and 1.09.
Gold Outlook for the Week Ahead
Gold has recently surged to new heights, hitting a record high of $3,200 per ounce on April 11, 2025, driven by escalating U.S.-China trade tensions and broader global uncertainties. This sharp increase has been propelled by several factors:
Geopolitical Tensions: The U.S.-China trade war remains a key catalyst for gold’s rally. U.S. tariffs on Chinese imports have risen to 145%, with China retaliating with tariffs on U.S. goods. This trade conflict, coupled with ongoing economic uncertainty, has led investors to flock to gold as a safe-haven asset.
Weaker U.S. Dollar: The U.S. dollar has weakened, reaching a three-year low, further boosting the appeal of gold. A weaker dollar reduces the opportunity cost of holding non-yielding assets like gold.
Inflation Concerns & Fed Rate Cuts: Anticipation of U.S. Federal Reserve rate cuts, along with concerns about rising inflation, have added to the upward pressure on gold. Historically, gold has been viewed as a hedge against inflation and currency devaluation, making it a preferred asset during uncertain times.
The market’s robust interest in gold reflects heightened fears of financial instability, with gold being seen as a safe haven amid volatile conditions. The ongoing trade tensions between the U.S. and China, coupled with the weakening dollar and inflation concerns, are expected to keep gold’s bullish trend intact in the short term. However, the market should be cautious of potential corrections due to overbought conditions.
In the coming week, investors should keep an eye on developments in U.S.-China trade relations, as well as any updates from the U.S. Federal Reserve regarding interest rate decisions, as these factors will heavily influence gold’s price trajectory. The combination of geopolitical risks and central bank policies makes gold a favored investment, but market participants should remain vigilant about possible price corrections.
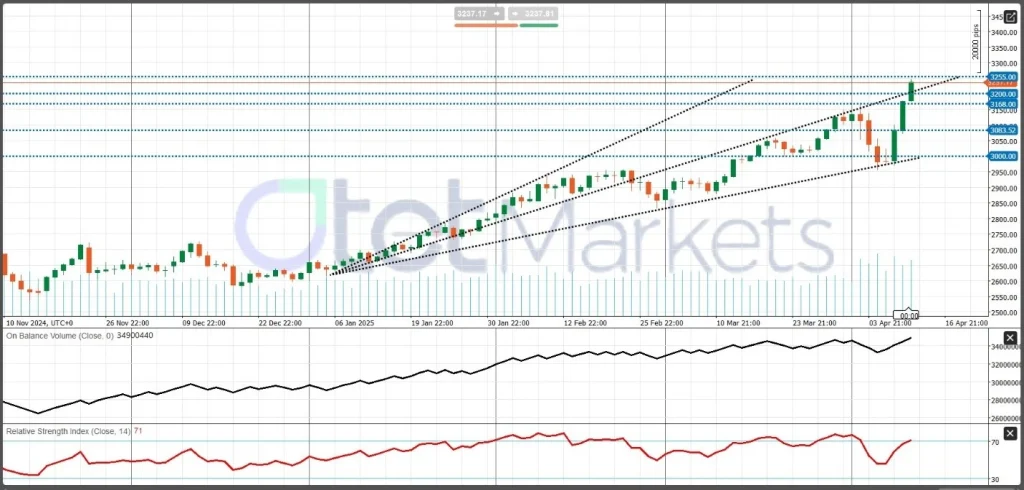
Overall, gold is likely to maintain its bullish trend, with $3,250 as a key resistance level to watch.
Technical Analysis:
Price Levels: Gold has broken above the $3,200 mark, with immediate resistance expected to be around $3,255. Support levels are identified at $3,200 and $3,168. Only a break below $3,000 could signal a potential trend reversal.
WTI Crude Oil Outlook for the Week Ahead (April 14–18, 2025)
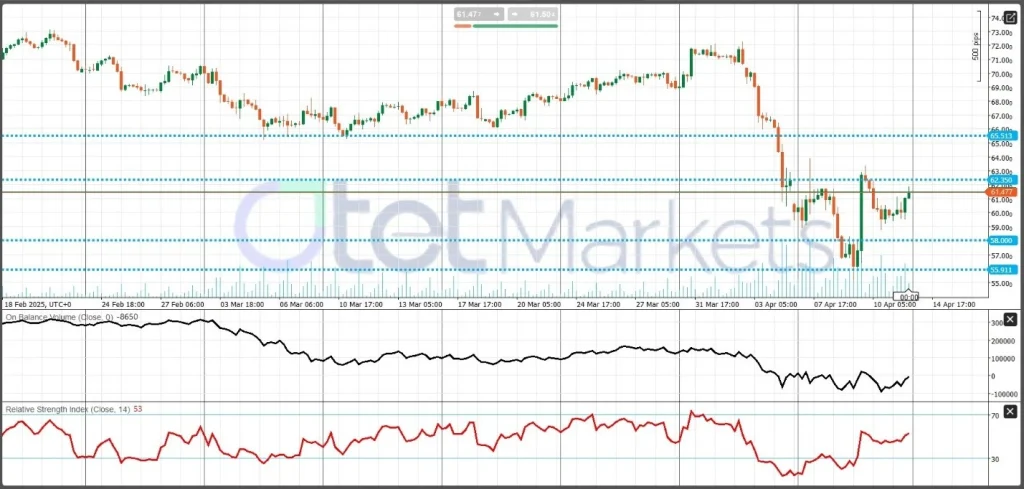
West Texas Intermediate (WTI) crude oil has shown significant volatility recently, driven by escalating U.S.-China trade tensions and shifting supply dynamics. After falling to a low of $56.06 per barrel, WTI rebounded to $62.35 following President Trump’s decision to pause tariff hikes for 90 days while maintaining a 125% tariff on Chinese imports.
Meanwhile, peace talks between Russia and Ukraine have stalled, and ongoing negotiations between Iran and the U.S. warrant close attention. While a positive outcome could ease energy prices, a negative one may have limited market impact, as Iran currently does not have a significant market share, OPEC+ is considering increasing its production by 411,000 barrels per day in May.
Despite the recent rebound, WTI has declined roughly 13% since April 2, raising concerns over a potential global economic slowdown and weakening demand. We forecast WTI to average $58 per barrel in April 2025, with upside risk if U.S.-Iran tensions escalate.
The outlook for WTI remains cautious in the week ahead. While short-term volatility is likely to continue, economic uncertainty and supply-side pressures point to a bearish bias. Geopolitical developments and OPEC+ decisions will be key drivers to watch.
Technical Outlook:
Key support is seen at $58.00, $56.06, and $55.00 per barrel. Immediate resistance lies at $62.35, with further resistance near $65.50.
Bitcoin (BTC) Technical Outlook
Trend Analysis
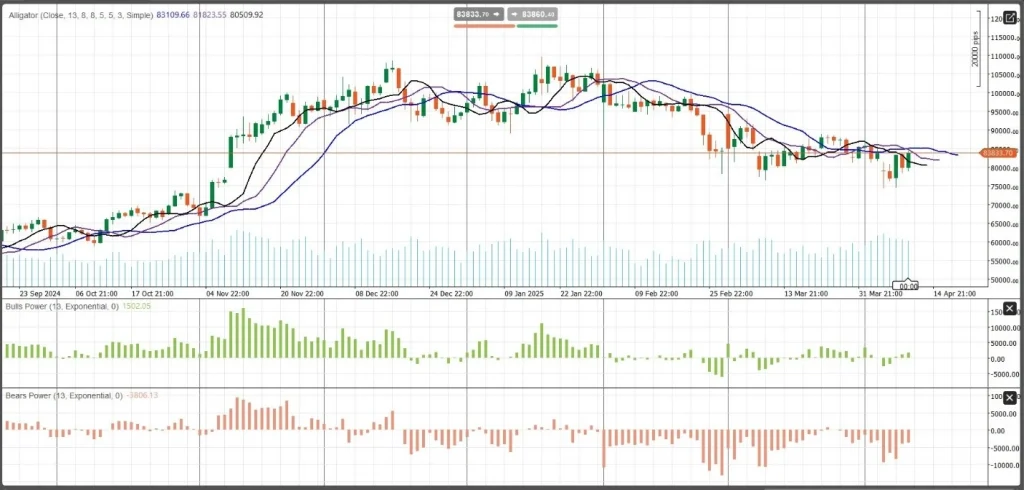
Bitcoin’s price action indicates a shift from a previously strong bullish trend to a more bearish tone. Initially, the market demonstrated a consistent pattern of higher highs and higher lows, supported by the Alligator indicator, with its blue, red, and green lines clearly aligning to reflect bullish momentum. However, around mid-November, this trend began to lose steam, transitioning into a downtrend by late December. This change is marked by a shift to lower highs and lower lows. A descending trendline, drawn from the highs of late December through April, visually reinforces the prevailing bearish momentum.
Support and Resistance
Key resistance lies around the 88,360 level—a zone that has repeatedly rejected price advances in both January and February. On the downside, a strong support level is observed near 80,500, where the price has found buyers multiple times from late February to early April. These levels serve as critical decision points for the market in the near term.
Chart Patterns
While there are no distinct classical patterns such as head and shoulders or double tops/bottoms, the overall price movement within the bearish phase suggests a broad descending channel, defined by the prevailing lower highs and lower lows.
Candlestick Behavior
Several bearish engulfing patterns appeared in late December and early January, highlighting persistent selling pressure. In contrast, bullish engulfing formations have been less frequent, although early February presented a few signals of short-lived reversals.
Indicators and Signals
The Alligator indicator currently shows its lines intertwined, indicating market indecision and a lack of a clear directional trend, typically a precursor to consolidation or a sideways movement. Bulls Power and Bears Power indicators reveal diminishing momentum on both sides, with recent readings reflecting a slowdown in both buying and selling strength.
Volume Analysis
Volume has spiked during periods of notable price swings, confirming strong participation during those moves. However, more recent sessions show declining volume, hinting at waning trader interest or broader market indecision.
Market Sentiment and Scenarios
Overall sentiment leans bearish, though the entangled Alligator lines suggest the potential for consolidation in the near term. Two primary scenarios may unfold:
- A bullish breakout above the 88,360 resistances, particularly with high volume, could signal a shift back to upward momentum.
- Alternatively, continued failure to break above the descending trendline and resistance may lead BTC to retest the 80,500-support level.
Share
Hot topics

What is Balance in Forex? A Complete Guide for Traders
Introduction When you open a trading account for the first time, one of the first numbers you see on your screen is your balance. It looks simple. It looks clear....
Read more


Submit comment
Your email address will not be published. Required fields are marked *