
Busy Week for the USA, Relatively Lighter for Other Markets
The central bank activity continues this week with meetings from the RBA, SNB, and Banxico. Last week saw significant divergence among central banks, with rate cuts in the U.S., hikes in Brazil, and unchanged rates in Japan, England, and China. Besides these central bank meetings, there’s plenty of data to watch, making it an especially eventful week in the U.S., while other markets will experience relatively lighter days.
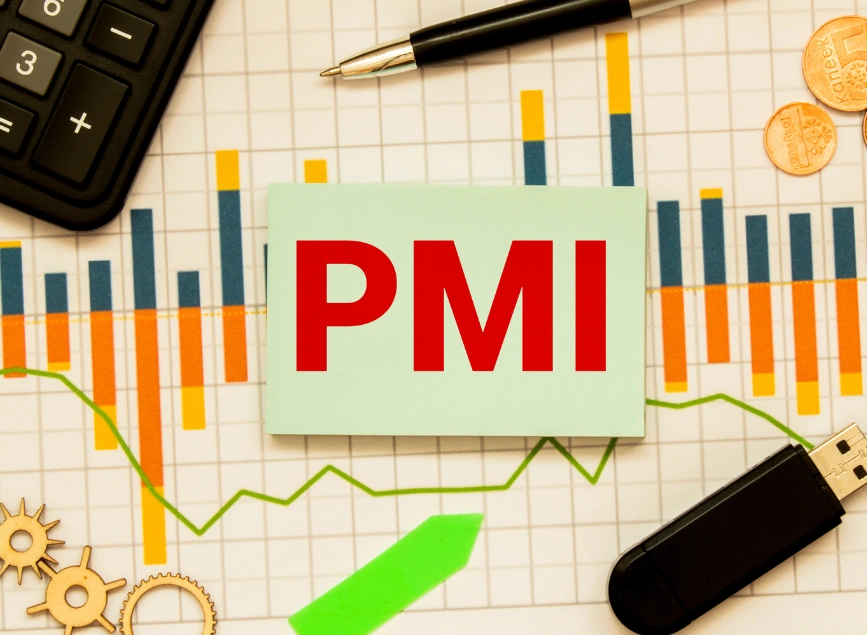
In addition to central bank meetings, the upcoming week will feature key events such as Fed speakers, New Home Sales, Durable Goods Orders, and Personal Income & Spending data in the U.S., along with PMIs from most developed and developing economies outside the U.S.
Wall Street and USD
As you know, the Federal Reserve Open Market Committee (FOMC) cut the target range for the federal funds rate by 50 bps last week, signaling an additional 25 bps cut in both November and December, if supported by data. As a result, expectations suggest that the Fed will reduce the federal funds rate by 25 bps at each of its two remaining meetings this year, potentially bringing the target rate to between 4.25% and 4.50% by year-end. While this level of interest rates could be supportive for stock markets, it may have been more beneficial if initiated earlier in July. Delaying this adjustment and then injecting such a shock into the markets could also spark recession fears, especially given the downward revision in GDP and unemployment forecasts.
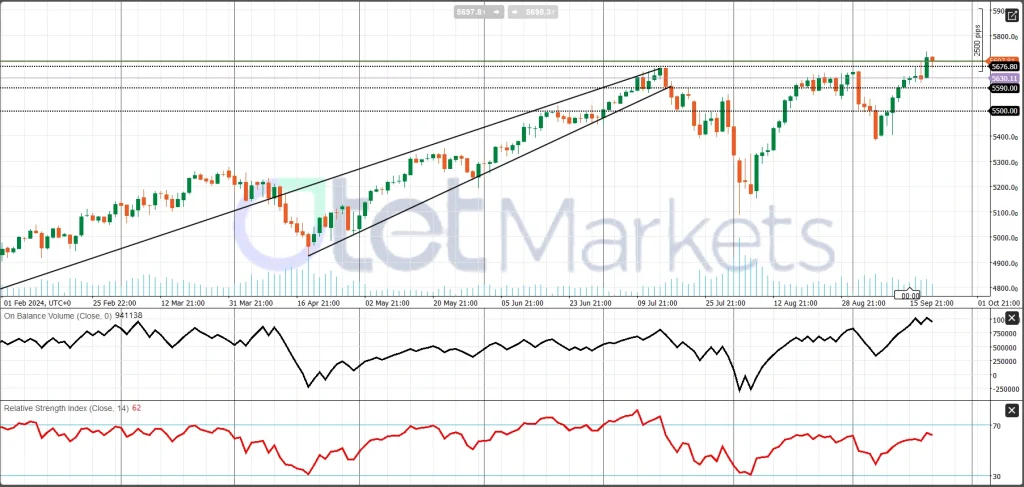
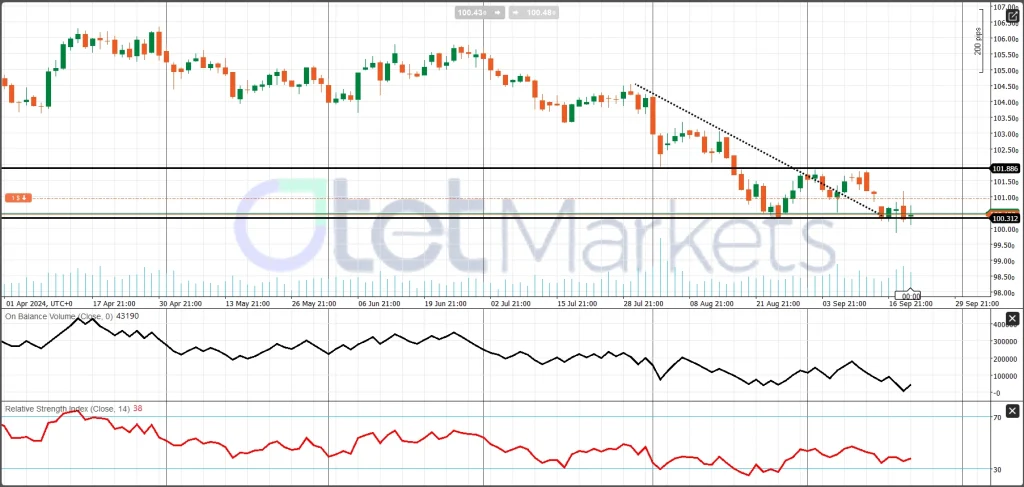
Concerns about weaker economic conditions, stronger than previously anticipated, led to a cautious response from U.S. stocks. Despite the significant Fed rate reduction, the S&P 500 closed the week with only a 1.25% gain, while the DXY (US Dollar Index) ended just 0.66% lower than the previous week’s close. Most of the dollar’s losses occurred on Monday, prior to the Fed decision.
Looking ahead, several important data points will be released this week, including CB Consumer Confidence, PMI numbers, Housing Market figures, GDP, Durable Goods Orders, and, most importantly, U.S. personal income and spending data. These numbers should provide a clearer picture of the U.S. economic outlook.
In the housing market, pending home sales once again dropped last month. Fed Chair Powell confirmed in his speech that investment in the housing market decreased in the third quarter, just as it did in the second quarter, indicating that housing affordability remains a major challenge for prospective homebuyers. However, new home sales continued to outperform in recent months compared to pending home sales. In July, new home sales jumped by 10.6%, reaching a 739K-unit pace—the highest level in over a year. According to the National Association of Homebuilders, 61% of builders reported offering sales incentives like price cuts and mortgage rate buy-downs in July, with that share increasing to 64% in August as builders tried to counteract rising interest rates. For August, however, we expect a 4.5% drop to a 705K-unit pace in new home sales.
Durable goods orders have long been a key economic indicator, reflecting the broader economic health of society. The willingness of consumers to purchase durable, long-term-use items, particularly Core Durable Goods Orders (excluding transportation), is a clear reflection of their financial stability. Overall orders surged by 9.8% in July, driven by a significant rebound in aircraft orders, but excluding transportation, orders slipped 0.2%. For August, with fewer transportation orders, we expect headline orders to drop by 3.0 while excluding transportation, we anticipate a modest 0.1% increase.
Personal spending and retail sales have remained resilient, but recent months have shown signs of cooling, which aligns with weaker consumer confidence numbers. While July’s CB Consumer Confidence increased to 103.3, up from 101.9 in June, it’s still not an impressive figure. For August, we expect confidence to fall back to 102.9.
Despite all the mentioned data, including Thursday’s GDP numbers, which are expected to show better growth compared to initial second-quarter estimates, investors will be focusing on Friday’s Fed-preferred inflation data.
One of the key surprises in the U.S. economy has been consumer spending, which continues to rise despite fears and a less optimistic outlook. Personal spending increased by 0.5% in July on a nominal basis, and even after adjusting for inflation with a 0.4% increase, spending remained robust. However, when we look at the data over the past six months, we see slight gains in real disposable personal income, while spending continued to grow. This suggests that something may be amiss. Notably, the personal saving rate dropped to 2.9%, marking only the second time it has fallen below 3.0% since 2008. For August, we expect personal spending to rise by 0.3% and personal income by 0.4%.
On the inflation front, the recent pickup in U.S. CPI and inflation in most developed economies will likely push the core PCE deflator higher in August. We expect the core PCE deflator to increase by 0.2% month-over-month, repeating the July figure. On a year-over-year basis, core CPI is projected to rise slightly to 2.7% in August, up from 2.6% in July. Despite some monthly volatility, core price pressures remain on a downward trend.
Our final assessment of this data is mixed and not particularly optimistic. Overall, the weaker-than-expected numbers suggest that fears of at least a soft landing are becoming more realistic, especially given the uncertainty the Fed has caused. In terms of stock markets, we remain cautious. While fundamentals are not overly positive, technical indicators are still signaling a cautiously bullish outlook. The S&P 500 remains bullish above its key pivot at 5,500, and bulls will stay in play as long as the index trades above this level.
As for the U.S. dollar, the outlook is not promising, either technically or fundamentally. Weaker economic growth prospects and softer data could reduce demand for the USD, while lower bond yields may further dampen demand for U.S. bonds and the dollar. Technically, the DXY (U.S. Dollar Index) remains bearish, though there is short-term reversal potential as indicators suggest oversold conditions.
Aussie and RBA’s Interest Rate Decision
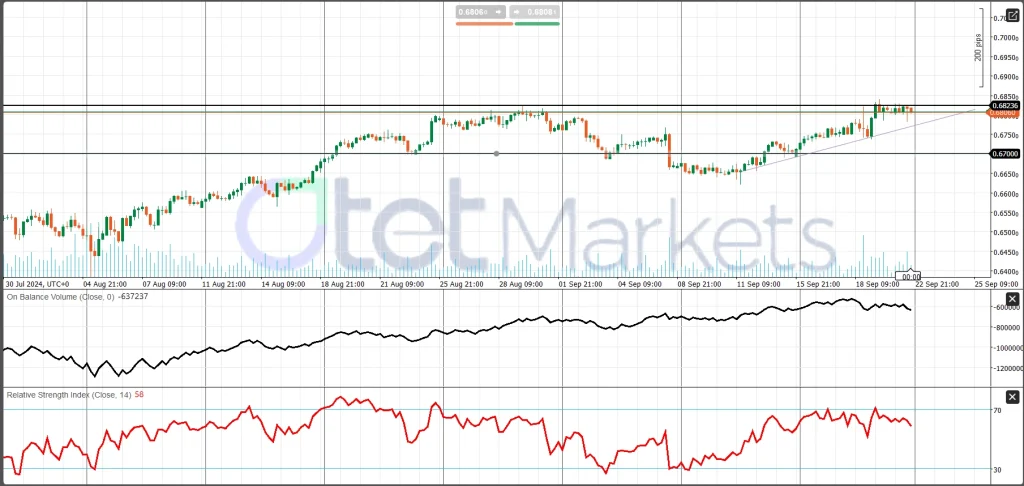
With a weaker USD and a slightly improved labor market, the AUD ended the week with a 1.4% gain against the U.S. dollar. Recently published data indicates that Australia’s economic condition is stable. On the inflation front, while price pressures have eased modestly in recent months, inflation remains the RBA’s primary concern. As a result, we expect the RBA to maintain its current policy, keeping the cash rate at 4.35%, following a slightly hawkish stance earlier this year. The AUD OIS also suggests a 94% probability of this scenario playing out. With the Reserve Bank of Australia holding its position and positive PMI numbers, the Aussie is expected to receive support against its rivals.
From a technical standpoint, AUD/USD remains bullish, with initial resistance at 0.6823 and a key pivot at 0.6700.
Gold
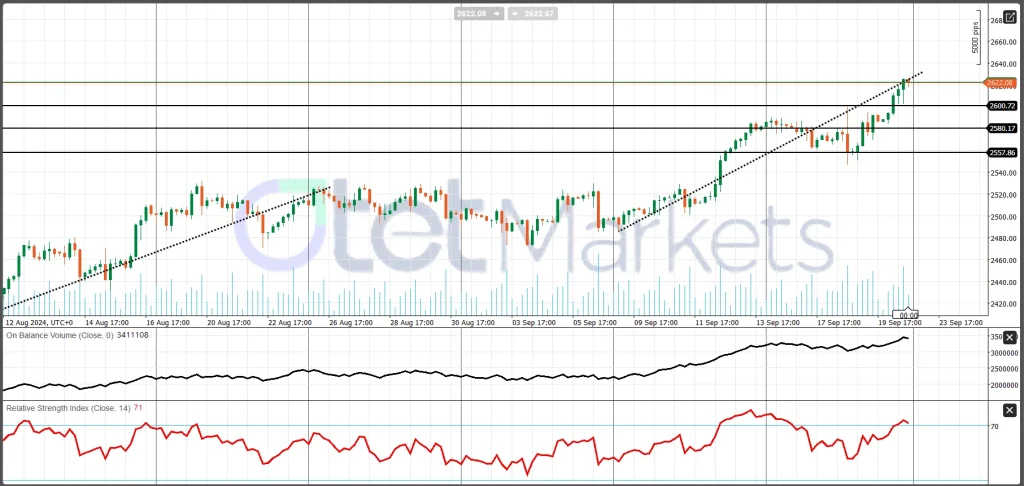
Gold hit new record highs as the Fed cut rates by 50 bps and signaled more cuts in upcoming meetings. A weaker USD and lower yields have driven up demand for gold. Additionally, escalating tensions in the Middle East have heightened market risks and increased the demand for safe-haven assets. This week, Israel attacked Lebanon multiple times, and with a weaker USD, these new geopolitical tensions could further support gold prices. However, current price levels appear quite high, suggesting the market may need an adjustment, which could signal a period of price stabilization.
Gold began the week with new highs and closed with a 1.3% gain. From a technical perspective, the first support is at $2,600, followed by $2,580, with $2,570 as the key pivot. As long as corrections stay above the pivot point, bulls are likely to dominate the market, but a break below this level could bring the bears into play.
Oil
Several factors supported oil prices last week, including escalating tensions in the Middle East and U.S. output concerns following Hurricane Francine. However, fears of weakening demand in China and the potential for a global market surplus next year limited gains, even though the Fed’s rate cut brought some optimism to the markets.
If, as expected, the Chinese government and the People’s Bank of China introduce a new round of stimulus or cut interest rates in line with the Fed’s actions, a softer monetary policy outlook could boost future demand and support a bullish outlook for crude prices.
On the geopolitical front, an Iran-backed group has vowed to retaliate against Israel after accusing it of orchestrating deadly explosions in Lebanon. Combined with the ongoing Russia-Ukraine conflict, these geopolitical tensions are likely to remain elevated, which could prevent oil prices from falling further than they did in early September.
According to the latest EIA report, U.S. crude oil inventories fell last week due to lower production and imports, while gasoline and distillate fuel stocks edged higher. Crude stocks decreased by 1.6 million barrels to 417.5 million barrels for the week ending Sept. 13, compared to expectations of a 1 million barrel drop. Gasoline and distillate stocks rose by 69,000 barrels to 221.6 million barrels and by 125,000 barrels to 125.1 million barrels, respectively.
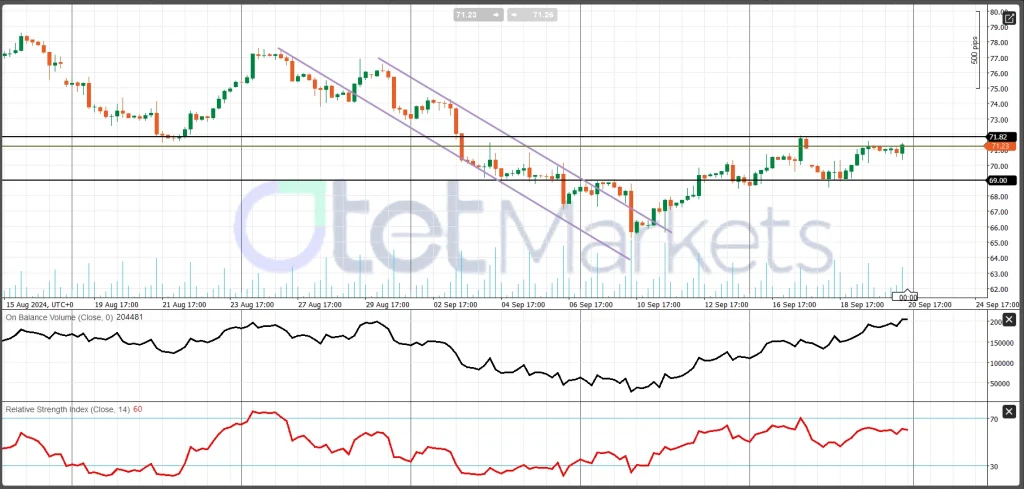
Overall, fundamental data and news do not point to a clear price direction in the short term. From a technical perspective, a sideways movement between $69 and $72 is the most likely scenario.
BTC
Bitcoin (BTC) rose above $63,000 following the Federal Reserve’s dovish interest rate decision. After the Fed’s 50 bps rate cut on Wednesday, the U.S. Dollar Index (DXY) remained near a 14-month low, hovering around 100.00, which boosted Bitcoin’s price against the U.S. dollar. Bitcoin was up around 6% this week, heading for its second consecutive positive week.
On Friday, hundreds of bitcoins mined during Bitcoin’s early days were moved, marking one of the rare instances of activity from the so-called “Satoshi era.” Blockchain data reveals that these bitcoins were initially received as a block reward in 2009, just months after the network’s launch, and had remained inactive until the recent transactions. This period refers to the time when Bitcoin’s creator, Satoshi Nakamoto, was still active in online forums, roughly between late 2009 and 2011.
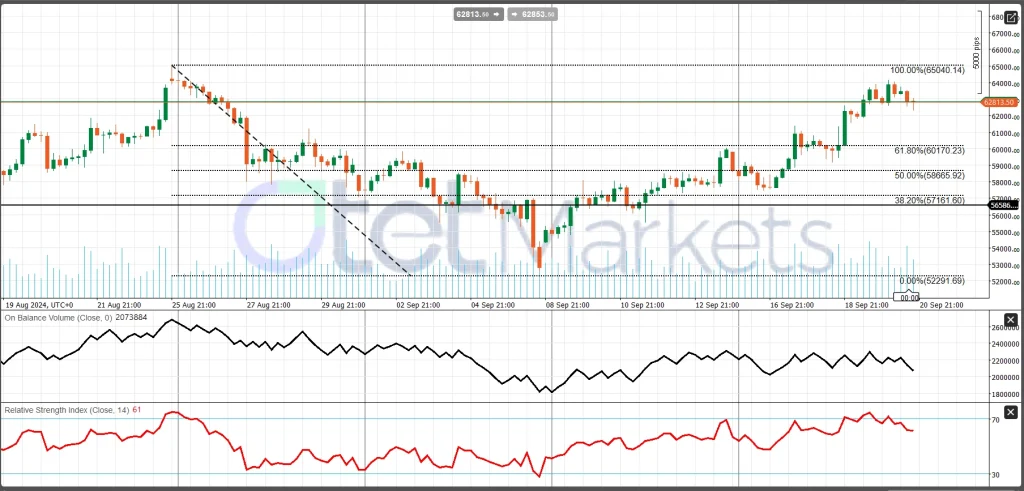
From a technical perspective, BTC has strongly recovered above its 50% Fibonacci level from the last drop, confirming the start of a new bullish trend. However, this rally appears weak, with falling OBV and RSI indicators. For now, $60K is the key pivot level, and holding above it could put new highs on the radar. A drop below this level, however, could change the outlook.
Share
Hot topics
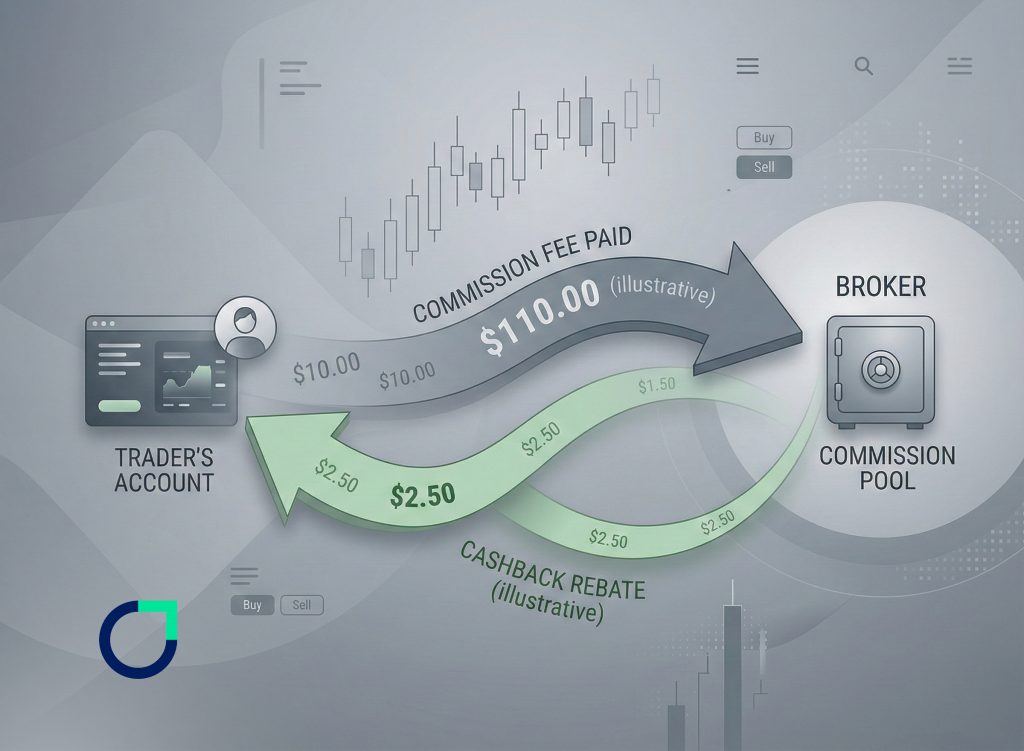
What is Forex Rebate
Introduction If you have been trading Forex for a while, you have probably noticed that every trade comes with a cost. Whether it is spread, commission, or both, trading is...
Read more


Submit comment
Your email address will not be published. Required fields are marked *