
A Light Week Ahead with U.S. Inflation in Focus
- Key Economic Events of the Week
- U.S. Economic Update: Trade Tensions, Labor Market Resilience, and Slowing Activity
- U.S. Economic Outlook
- USD and Wall Street Outlook
- NZD and RBNZ Interest Rate Decision Outlook
- Gold Fundamental and Technical Outlook
- Oil Market Outlook
- Bitcoin Price Movement Expectations
- Technical Outlook
Markets continue to respond to rising trade tensions, particularly around potential reciprocal tariffs between the U.S. and key trading partners. These tensions have heightened expectations for Federal Reserve rate cuts, leading to a decline in Treasury yields. Tariff concerns also contributed to a widening U.S. trade deficit in February, which reached $68.9 billion, and added to input cost pressures in both manufacturing and services sectors, according to recent PMI data.
Despite elevated uncertainty, the U.S. labor market remains resilient. March’s nonfarm payrolls showed a net gain of 228,000 jobs, while the unemployment rate held steady at 3.8%, reinforcing the view that the economy is still on solid ground.
Globally, monetary policy and sentiment signals were mixed but mostly steady:
- In China, the Caixin Services PMI remained in expansion at 52.7, signaling continued, albeit moderate, growth.
- Japan’s Tankan survey showed improving sentiment among large manufacturers, despite global headwinds.
- The Reserve Bank of Australia (RBA) kept rates unchanged at 4.35%, maintaining a cautious stance amid sticky inflation.
- Colombia’s central bank (BanRep) also held rates steady, focusing on inflation containment.
- In the Eurozone, March inflation cooled slightly, with headline CPI falling to 2.4% year-over-year, supporting expectations that the ECB may begin easing in the summer.
Key Economic Events of the Week
Monday, April 8
- 🇩🇪 Germany: Industrial Production (Feb)
- 🇬🇧 UK: Halifax House Price Index (Mar)
- 🇪🇺 Eurozone: Sentix Investor Confidence (Apr)
Tuesday, April 9
- 🇯🇵 Japan: Current Account Balance (Feb)
- 🇦🇺 Australia: NAB Business Confidence & Conditions (Mar)
Wednesday, April 10
- 🇳🇿 New Zealand: RBNZ Interest Rate Decision
- 🇯🇵 Japan: BoJ Governor Ueda Speech
- 🇺🇸 United States: FOMC Meeting Minutes (March)
Thursday, April 11
- 🇬🇧 UK: Rightmove House Price Index (Apr)
- 🇯🇵 Japan: Corporate Goods Price Index (Mar)
- 🇨🇳 China: CPI and PPI Inflation Data (Mar)
- 🇸🇪 Sweden: GDP (Feb)
- 🇳🇴 Norway: CPI (Mar)
- 🇨🇿 Czech Republic: Final CPI (Mar)
- 🇺🇸 United States:
- Consumer Price Index (Mar) – Key data for Fed policy
- Initial Jobless Claims (weekly)
- 🇨🇦 Canada: Building Permits (Feb)
Friday, April 12
- 🇬🇧 UK:
- GDP (Feb)
- Manufacturing Output (Feb)
- 🇸🇪 Sweden: CPI (Mar)
- 🇺🇸 United States:
- Producer Price Index – PPI (Mar)
- University of Michigan Consumer Sentiment (Prelim, Apr)
U.S. Economic Update: Trade Tensions, Labor Market Resilience, and Slowing Activity
The U.S. has introduced sweeping new tariffs, significantly escalated trade tensions and adding uncertainty to the economic outlook. Starting on April 5, a minimum 10% tariff will apply to imports from all countries, with higher rates for nations that maintain large trade surpluses with the U.S. Notably, the European Union will face a 20% tariff, while China, South Korea, Taiwan, and Vietnam will experience duties ranging from 25% to 45%. Canada and Mexico will face a 25% tariff, though goods covered under the USMCA will be exempt. Additional exclusions apply to select goods, such as steel, aluminum, and semiconductors, although many of these items are already subject to other tariffs or are under investigation.
Should these tariffs be fully enforced, the effective U.S. tariff rate could rise from under 3% to approximately 23%, posing significant downside risks to economic growth. In response to these developments, markets quickly reacted, with the 10-year Treasury yield dropping below 4% and rate cut expectations for 2025 rising to even 100 basis points, reflecting growing concerns that the Federal Reserve may be forced to cut rates in response to economic deterioration.
Despite the escalating trade tensions, the U.S. trade deficit remained elevated at $122.7 billion in February, largely driven by stockpiling ahead of the tariff imposition. The surge in imports, particularly in industrial supplies, is expected to distort Q1 GDP, front-loading economic activity but putting downward pressure on subsequent quarters. A revised economic outlook will be issued next week, reflecting these rapid developments.
While the risks to the economic outlook are rising, the U.S. labor market remains relatively resilient for now. In March, non-farm payrolls increased by 228,000, exceeding expectations, and household employment grew by 201,000 jobs, with the unemployment rate holding steady at 4.2%. However, the job gains were concentrated in specific sectors, with healthcare and social assistance accounting for about one-third of the total increase. Alongside leisure and hospitality, these two sectors together contributed more than 50% of the total job growth. On the downside, employment declined in sectors like temporary help, information, and wholesale trade. Wage growth showed some signs of moderation, with average hourly wages rising by 0.3% month-over-month, but the year-over-year growth slowed to 3.8%, the lowest rate since July.
In terms of business activity, recent ISM surveys painted a more cautious picture. The ISM Manufacturing Index fell back into contraction at 49.0, while the ISM Services Index barely registered expansion at 50.8. Key components like new orders and employment showed signs of weakening, with concerns over tariffs and rising cost pressures intensifying, especially in the manufacturing sector. The prices paid index in manufacturing surged to its highest level since June 2022, signaling ongoing inflationary pressures.
Lastly, the JOLTS job opening report for February showed a decline to 7.57 million, continuing the trend of stagnation in job openings and hires observed over the past six months. While there were slight increases in job openings in transportation, warehousing, and manufacturing sectors, likely driven by stockpiling—broader indicators suggest a slowdown in labor demand. Indeed, job postings, small business hiring plans, and consumer sentiment all point to a slower pace of job growth ahead, further reinforcing the view of a cooling labor market as we move through 2025.
U.S. Economic Outlook
The U.S. economy faces significant challenges this week, with rising trade uncertainty, inflation, and labor market concerns. Key data releases will provide insight into these ongoing issues. This week, data will highlight the U.S. economy’s challenges, including trade uncertainty and inflation concerns. Small business optimism remains low, and inflation expectations persist. The FOMC minutes and CPI report will offer crucial insights into the Fed’s response to these economic pressures.
The NFIB small business optimism will be published on Tuesday. February saw small business optimism fall to 100.7, driven by trade policy uncertainty and rising costs. 32% of firms raised prices, and labor quality became a bigger concern than inflation. Wage growth remained flat.
On Wednesday, we will have the FOMC Meeting Minutes. The release of the minutes from the latest Federal Open Market Committee (FOMC) meeting will provide critical insight into the central bank’s policy stance and economic outlook. With the recent shift in U.S. trade policy and rising inflation expectations, markets will be keen to understand the Fed’s assessment of the economic risks and potential policy adjustments. Any indication of future rate cuts or changes to the monetary policy strategy will be closely scrutinized. Market participants are still looking to see the Fed’s expected rate cut for 2025.
March’s US CPI is expected to be published on Thursday and show flat month-over-month growth, with the annual rate falling to 2.5%. Core CPI is projected to rise 0.3%, with energy price declines providing some relief, though food prices and tariffs could push inflation upward. A day after these data, we will have the US producer price index as well, the data which is expected to show producers’ inflation rising by 0.1%, after flat data in February, indicating the market reaction to new tariffs.
And finally, on Friday we must watch the Consumer Sentiment more closely. The consumer sentiment index dropped to 57.0 in March, the lowest since 2022, driven by rising inflation expectations. Short-term inflation expectations rose to 5.0%, and consumer outlook on finances worsened. We expect the trend to continue in March reports as well.
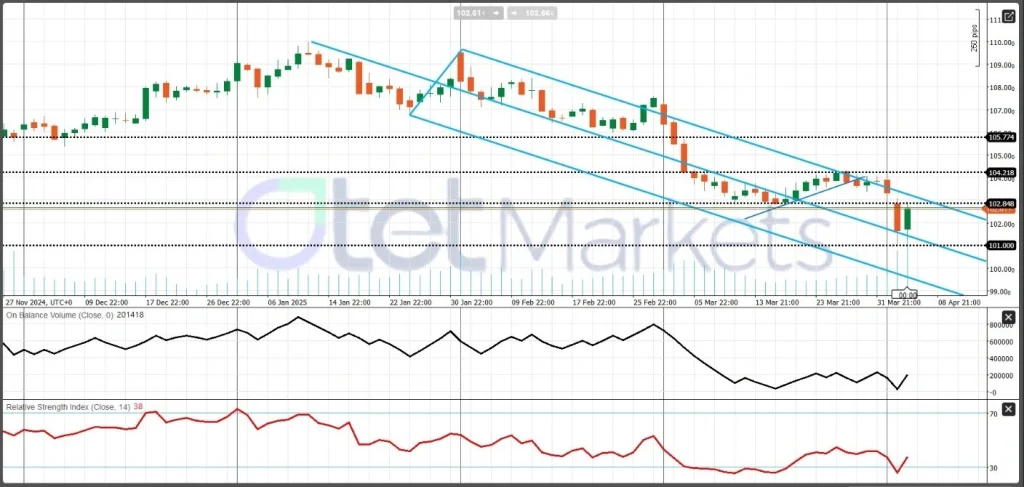
USD and Wall Street Outlook
Overall, we maintain the view that the bearish trend for the USD will persist, despite a short recovery following the sharp decline in previous days. Technically, there is strong resistance at 104.20, and if the index manages to move above this level, it could test 105.70. However, if the bearish trend continues and the index remains below 102.80, the next target for the USD Index could be 101.00.
As for the stock market, concerns over a potential slowdown or even contraction of the U.S. economy could push stock prices lower. At the same time, any doubts about the Fed cutting rates could limit recoveries and accelerate the downward momentum.
Wall Street plunged Friday as China retaliated against U.S. tariffs with sweeping new levies, sending the Nasdaq into a bear market and the S&P 500/Dow down over 5%. Fed Chair Powell warned the tariffs could spur inflation and slower growth, sparking a flight to Treasuries. While a strong jobs report tempered bond gains, recession fears dragged oil and gold lower, highlighting growing global economic risks.
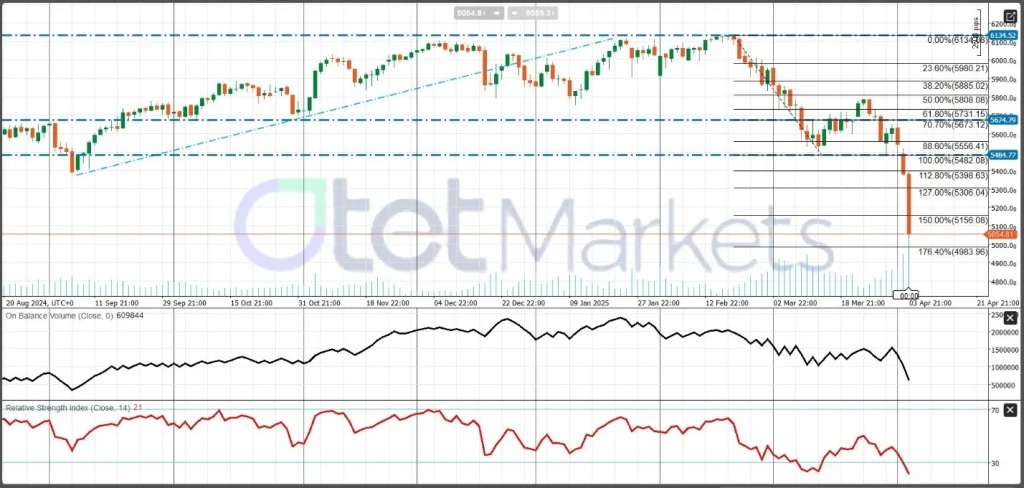
Technically, bears are still controlling the market. Initial resistance is around 5,160, and a recovery attempt could push the index to around 5,300. However, the overall downtrend remains intact, with the 5,000 psychological level in focus. A break below 5,000 would open the door to further declines.
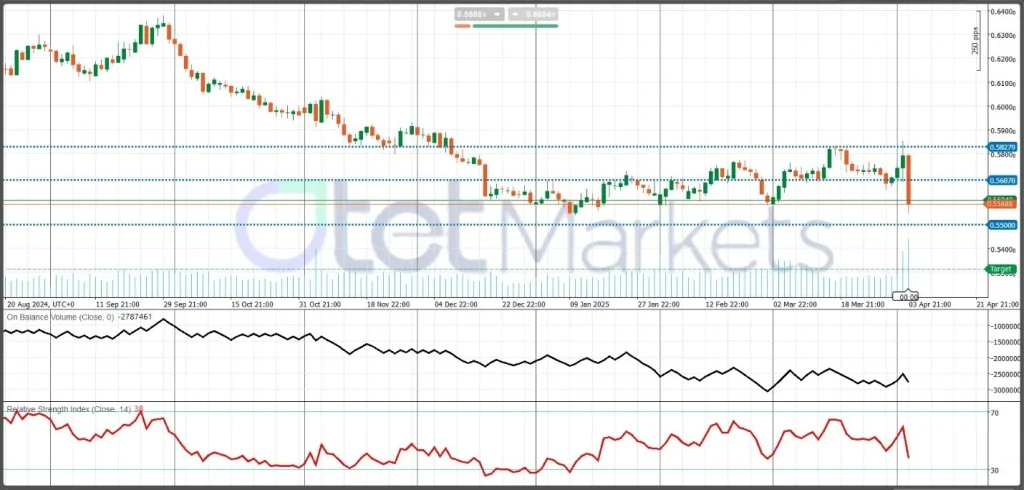
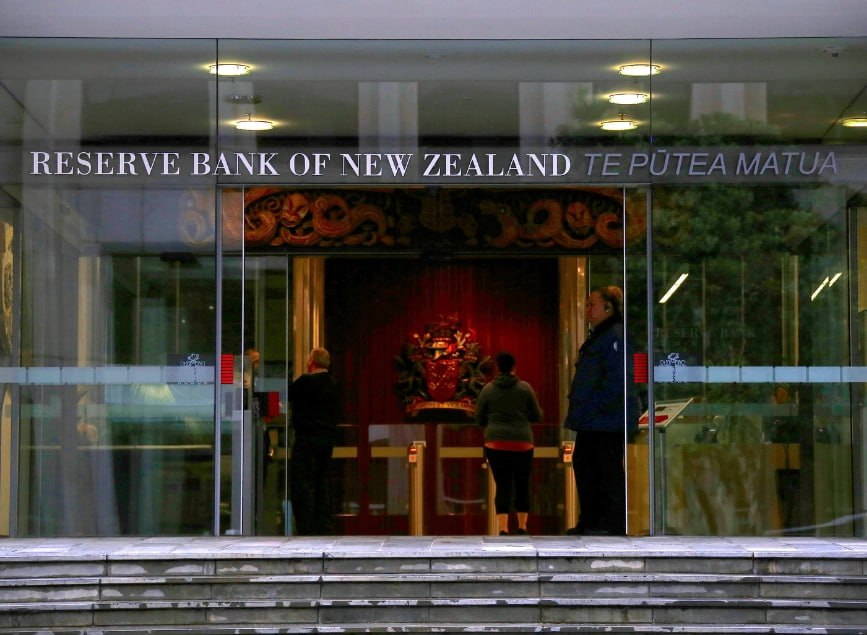
NZD and RBNZ Interest Rate Decision Outlook
The Reserve Bank of New Zealand (RBNZ) is set to announce its interest rate decision on April 9, 2025, amid ongoing discussions about the country’s economic recovery and inflation dynamics.
In February 2025, the RBNZ reduced its official cash rate (OCR) by 50 basis points to 3.75%, marking the second consecutive rate cut. This move, in line with market expectations, brought borrowing costs to their lowest level since late 2022. The central bank’s decision was influenced by subdued employment conditions, slowing economic growth, and easing inflation pressures. New Zealand’s annual inflation rate stood at 2.2% for the December 2024 quarter, within the RBNZ’s target range of 1%-3% and its lowest level since March 2021. At the same time, New Zealand’s economy contracted year-over-year for five consecutive quarters through September 2024, with wage growth also showing signs of deceleration.
Looking ahead, economists anticipate a further 25 basis point reduction in the OCR, bringing it to 3.50%. This expected cut aligns with the RBNZ’s ongoing efforts to stimulate economic activity following the country’s emergence from recession, with 0.7% growth recorded in Q4 2024.
However, some experts remain cautious about the need for further rate cuts, questioning whether the current economic data justifies additional easing. Westpac’s chief economist, Kelly Eckhold, has expressed concerns that further OCR cuts at this point may be premature, advocating for a more data-driven approach before making additional reductions.
While a 25-basis point cut is widely anticipated, the timing and necessity of further monetary easing remain subjects of debate. The RBNZ’s upcoming decision will hinge on its assessment of broader economic conditions and inflationary trends.
With expected dovish policies, the Kiwi may continue losing momentum, with the next target around 0.55 acting as a key pivot. On the other hand, a weaker outlook for the U.S. economy could raise doubts about the NZD falling further below this level.
Gold Fundamental and Technical Outlook
Gold prices have experienced an impressive surge, reaching unprecedented levels above $3,100 per ounce. This remarkable rally has been largely driven by a combination of geopolitical tensions, global trade uncertainties, and robust demand from both investors and central banks.
Ongoing conflicts and escalating trade disputes have significantly contributed to gold’s appeal as a safe-haven asset. Additionally, central banks worldwide have been actively increasing their gold reserves, which has bolstered the price of precious metal. This trend has supported gold’s upward momentum as central banks seek to diversify their holdings and hedge against economic uncertainties.
Furthermore, recent tariff announcements, particularly from the Trump administration, have heightened inflation fears, driving further demand for gold. As concerns about rising prices mount, gold is often seen as a hedge against inflation, reinforcing its attractiveness among investors.
US President Donald Trump’s trade tariffs sparked concerns about global economic slowdowns, which in turn can increase demand for gold as a safe haven.
Despite a short-term pullback, the long-term bullish trend for gold remains intact. The ongoing structural demand for safe-haven assets like gold continue to support its price. Additionally, concerns over a potential slowdown in the US economy, highlighted by weaker-than-expected economic data such as the ISM Services PMI, have fueled expectations that the Federal Reserve may implement at least two to three rate-cuts by the year’s end. This dovish outlook on US monetary policy adds upward pressure on gold prices, reinforcing its safe-haven appeal.
Furthermore, central banks are expected to continue their gold-buying spree, seeking to diversify away from US dollar holdings amid political and policy risks tied to the current US administration. This long-term support from central banks further strengthens the bullish outlook for gold.
Gold’s price trajectory is underpinned by a combination of strong demand driven by geopolitical risks, central bank purchases, and concerns over inflation. Despite short-term fluctuations, the long-term outlook for gold remains positive, with prices expected to continue their upward momentum in the medium term. As investors navigate potential volatility, gold will likely remain a favored asset, providing a hedge against global uncertainties.
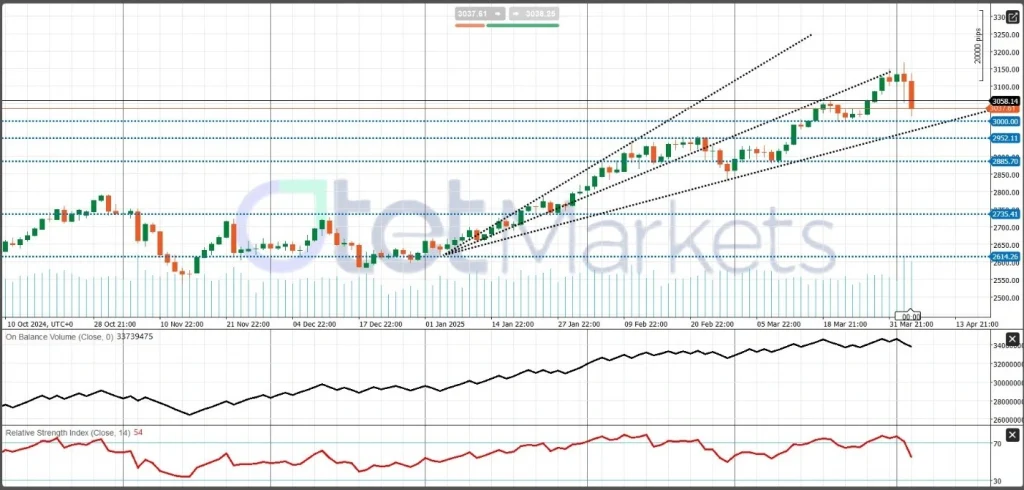
Technical Analysis:
In the short term, technical indicators show a bearish trend, with moving averages signaling sell positions. However, the overall global trend appears to be losing momentum, indicating the potential for price stabilization in the coming days. Given the prevailing geopolitical risks and sustained demand for gold, the medium-term outlook remains positive. $3,000 is the key pivot, with the next target at $2,950 if it breaches this key pivot. Generally, gold still offers a buying opportunity as long as it trades above $2,885 USD.
Oil Market Outlook
The oil market is expected to experience heightened volatility in the upcoming week, driven by recent geopolitical developments and strategic decisions by key oil-producing nations.
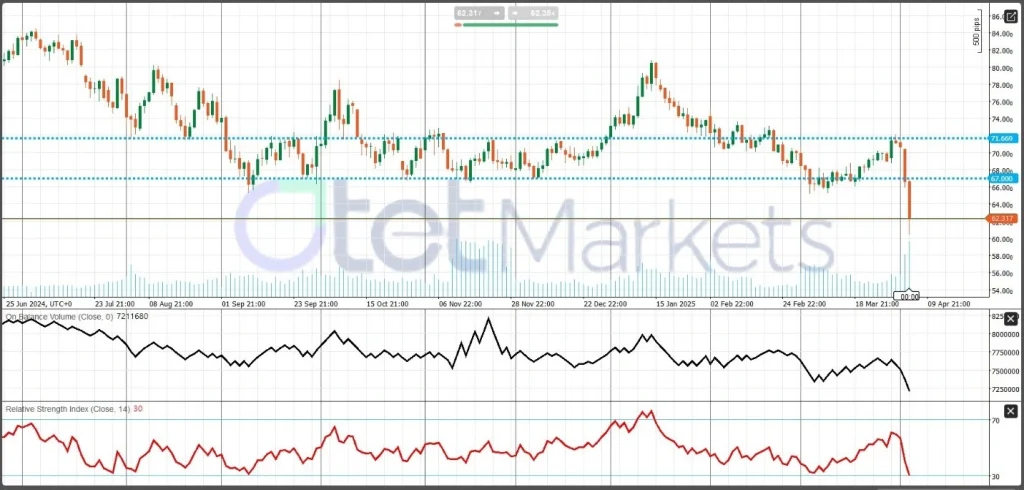
Oil prices have come under significant pressure, with Brent crude experiencing its largest sell-off since August 2022, trading below $70 per barrel. This decline is largely due to concerns about weakened demand following U.S. tariffs, compounded by an unexpected increase in oil supply from OPEC+. Consequently, oil price forecasts for the remainder of the year have been revised lower, with further downside risks anticipated. Geopolitical tensions and supply adjustments are expected to continue influencing price movements in the short term.
OPEC+ had initially planned to gradually increase supply by 2.2 million barrels per day (b/d) from April 2025 to September 2026. However, the group surprised the market by announcing a 411,000 b/d increase for May, citing healthy market fundamentals and a positive outlook. This decision has raised concerns, particularly considering the demand uncertainty caused by the U.S. tariffs. OPEC+ will reconvene on May 5 to assess June production levels.
The decision to increase supply may also be linked to U.S. President Trump’s tougher stance on Iran and Venezuela, with stricter sanctions potentially prompting OPEC+ to adjust its production strategy. Additionally, Trump’s pressure on Saudi Arabia to lower oil prices may have influenced the decision. Some analysts also suggest that the move could be aimed at addressing members such as Iraq and Kazakhstan, who have been producing above their targets.
In light of the combination of increased supply from OPEC+, potential demand disruptions due to trade tensions, and ongoing geopolitical uncertainties, oil prices are expected to remain volatile. Market participants should remain vigilant, monitoring these developments and their potential impact on supply and demand fundamentals.
From a technical perspective, WTI crude is currently oversold below $67, maintaining a downward trend. However, technical indicators suggest a possible correction in the oversold zone. $67 remains a critical pivot point, and sustained trading below this level could exert further downward pressure on prices.
Bitcoin Price Movement Expectations
Recent U.S. trade tariffs have triggered increased market volatility, affecting both traditional and cryptocurrency markets. President Trump’s announcement of substantial tariffs prompted retaliatory measures from China, escalating economic uncertainty. This evolving macro environment has directly influenced Bitcoin’s price behavior, causing notable fluctuations in recent sessions.
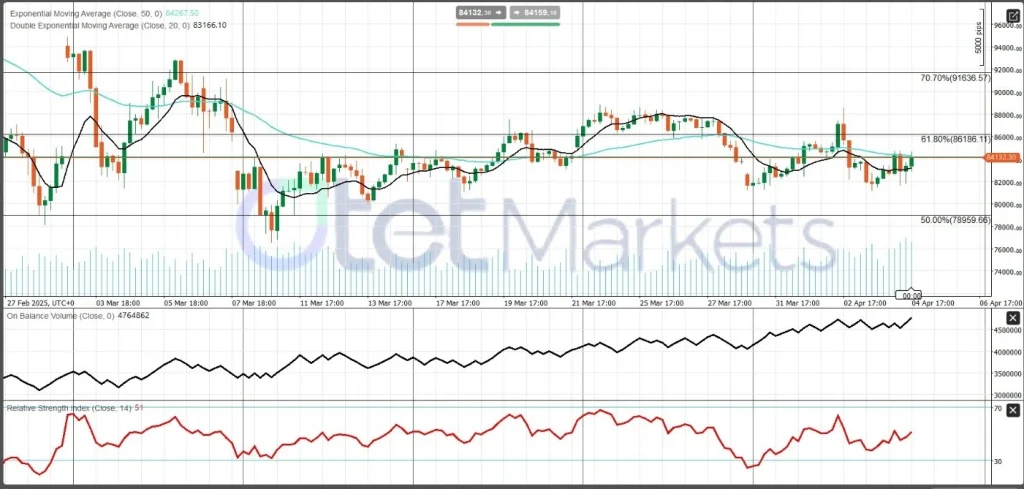
Despite broader market sell-offs, the cryptocurrency market has demonstrated relative resilience. Following significant declines in major stock indices, Bitcoin rose by 0.9%, reaching approximately $83,961. This performance divergence has reignited discussions around Bitcoin’s potential role as a safe-haven asset in times of economic turbulence.
On Wednesday, Bitcoin saw heightened volatility in response to Trump’s tariff announcement, which stoked recession fears. BTC briefly surged to $88,500 before pulling back sharply to $81,200—the result of the most aggressive trade tariffs imposed on U.S. imports in a century.
However, Bitcoin stabilized on Thursday and continued to drift modestly higher on Friday, positioning it for weekly gains exceeding 1.3%. This contrasts starkly with traditional markets: the Nasdaq 100 plummeted by 5.4% on Friday in its steepest one-day selloff since 2022.
Several macro factors appear to be working in Bitcoin’s favor:
- Weaker U.S. Dollar: The dollar has fallen significantly, down 1.77% just four days into April after a 3.1% decline in March. It now trades at a five-month low against major peers, as concerns over a U.S. recession drive investor flow toward the euro and traditional safe-haven currencies such as the Japanese yen and Swiss franc.
- Falling Treasury Yields: U.S. Treasury yields dropped sharply following the tariff announcement. The 2-year yield declined notably, while the 10-year yield fell to its lowest level since October 2024. These moves suggest markets are pricing in potential rate cuts by the Federal Reserve to cushion the economy from tariff-related shocks—potentially improving liquidity conditions that could benefit cryptocurrencies.
While a sustained rally in Bitcoin is not yet evident, any signal of a dovish shift from the Fed could provide the catalyst for a higher move.
Technical Outlook
Key technical levels play a critical role in guiding market expectations. A decisive break below support at $82,000 could open the door to further downside toward the $76,000–$78,000 range by the end of the month. Conversely, if Bitcoin sustains trading above $86,000, it could indicate bullish momentum, with the next upside target set around $95,000.
Share
Hot topics

Gold symbol in forex
Introduction If you have ever opened a trading platform and searched for gold, you probably noticed a specific code instead of the word “gold.” In the forex world, assets are...
Read more

Submit comment
Your email address will not be published. Required fields are marked *