Mastering Support and Resistance: The Foundation of Technical Trading
Estimated reading time: 3 minutes
Table of contents
Have you ever noticed prices bounce off certain levels again and again?
That’s support and resistance at work, two of the most important tools in technical analysis.
Understanding support and resistance in trading helps you predict price movements, spot entry/exit points, and build a solid strategy. Whether you’re trading Forex, crypto, or stocks, these zones can guide you through the market’s ups and downs.
Let’s break it all down in a simple, visual, and practical way.
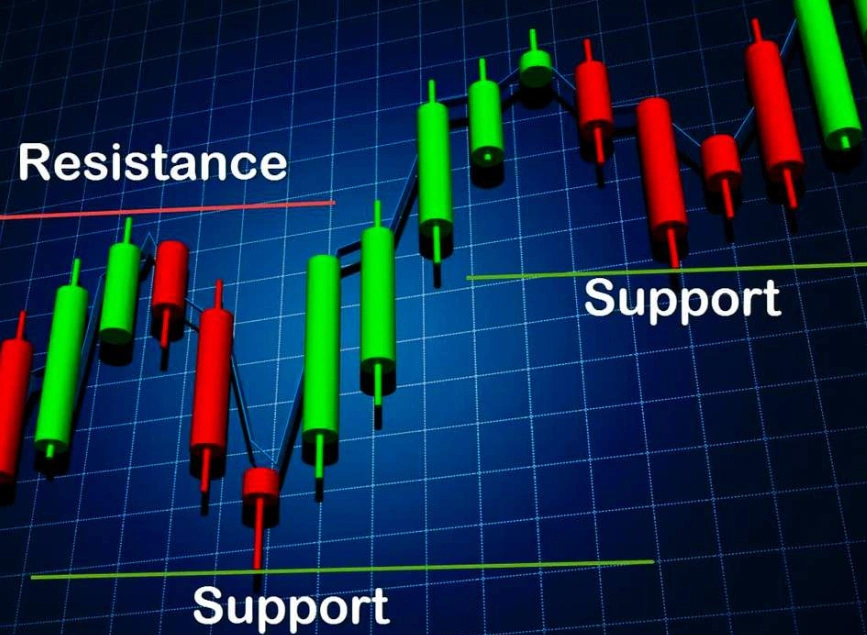
What is Support?
Support is a price level where a falling market tends to stop and bounce back up.
💡 Why?
Because at this level, demand becomes stronger than supply—traders see the price as a bargain and start buying.
📌 Example:
If EUR/USD keeps bouncing around 1.0500, that level acts as a support zone.
What is Resistance?
Resistance is the opposite. It’s a level where a rising market slows down and reverses because sellers overpower buyers.
📌 Example:
If Bitcoin struggles to break above $70,000, that becomes a resistance level.
Visual Summary
| Term | Price Behavior | Market Psychology |
|---|---|---|
| Support | Price bounces upward | Buyers enter the market |
| Resistance | Price reverses downward | Sellers take over |
How to Identify Support and Resistance
You can spot support and resistance by:
- 🔁 Previous highs and lows
- 📉 Trendlines drawn under/over the price
- 🧲 Moving averages (e.g. 50 or 200 EMA)
- 📊 Volume spikes at key levels
- ⛓️ Round numbers (like 1.0000, 100.00)
- 🔧 Fibonacci retracement zones (e.g. 61.8%, 38.2%)
Why Support and Resistance Matter in Trading
- ✅ Entry/exit points: You can plan your trades with better timing
- ✅ Risk management: Set stop-loss just below support or above resistance
- ✅ Trend confirmation: Levels help define whether the trend is continuing or reversing
- ✅ Psychological zones: These levels reflect trader behavior and market memory
Smart Trading Strategies Using Support and Resistance
1. Range Trading
- Buy at support
- Sell at resistance
- Works best in sideways markets
2. Breakout Trading
- Price breaks through resistance → enter a long position
- Price breaks below support → enter a short position
- Confirm breakout with volume or candle close above/below level
3. Pullback Entries
- Wait for a breakout
- Then enter on the retest of the broken support/resistance (now acting as the opposite)
Example Chart Zones
| Situation | Action |
|---|---|
| Price bounces 3 times off 1.1000 | Consider it a strong support |
| Price breaks above resistance | Possible trend continuation |
| Price returns to support after breakout | Entry point for long trades |
✅ Summary
Support and resistance are essential tools for any trader. They help you:
- Understand price behavior
- Time your entries and exits
- Avoid emotional trading mistakes
👉 Now that you know how to spot and use these levels, try marking them on your chart and observe how price reacts. Practice builds confidence.
❓ FAQ
What happens when support breaks?
If support breaks with strong volume, price may fall further—what was support becomes new resistance.
How reliable are support and resistance levels?
The more times a level is tested without breaking, the stronger it becomes—but no level is perfect.
Are these levels the same in Forex and stocks?
Yes! The concept works across all markets, Forex, crypto, stocks, commodities, etc.
Can indicators help with support/resistance?
Yes. Use tools like pivot points, Fibonacci levels, moving averages, or custom zones for added confirmation.
Share
Hot topics

What is News Trading in Forex? A Complete Guide to Event-Driven Strategy
Introduction If you have ever watched the forex market during a major economic announcement, you know how dramatic it can be. Prices jump within seconds. Spreads widen. Volatility explodes. For...
Read more


Submit comment
Your email address will not be published. Required fields are marked *