
What Is Fibonacci in Forex Trading?
If you’ve spent any time researching charts or trading tactics, you’ve most likely come across the term Fibonacci. At first glance, it may appear mysterious or frighteningly mathematical. But once you comprehend the concept, you’ll see it’s both practical and surprisingly straightforward.
In this article, we’ll explain what Fibonacci means in forex trading, why traders use it, and how you may incorporate it into your daily trading decisions. There is no tricky mathematics or heavy theory—only a clear explanation with accessible examples and simple directions.
Why Fibonacci Occurs in Trading at All
Let’s begin with the important question: why would your candlestick chart display a mathematical sequence from the thirteenth century Human behaviour holds the key. People’s feelings, responses, routines, and expectations drive markets, and recurring patterns—especially fear and greed—often shape market movements.
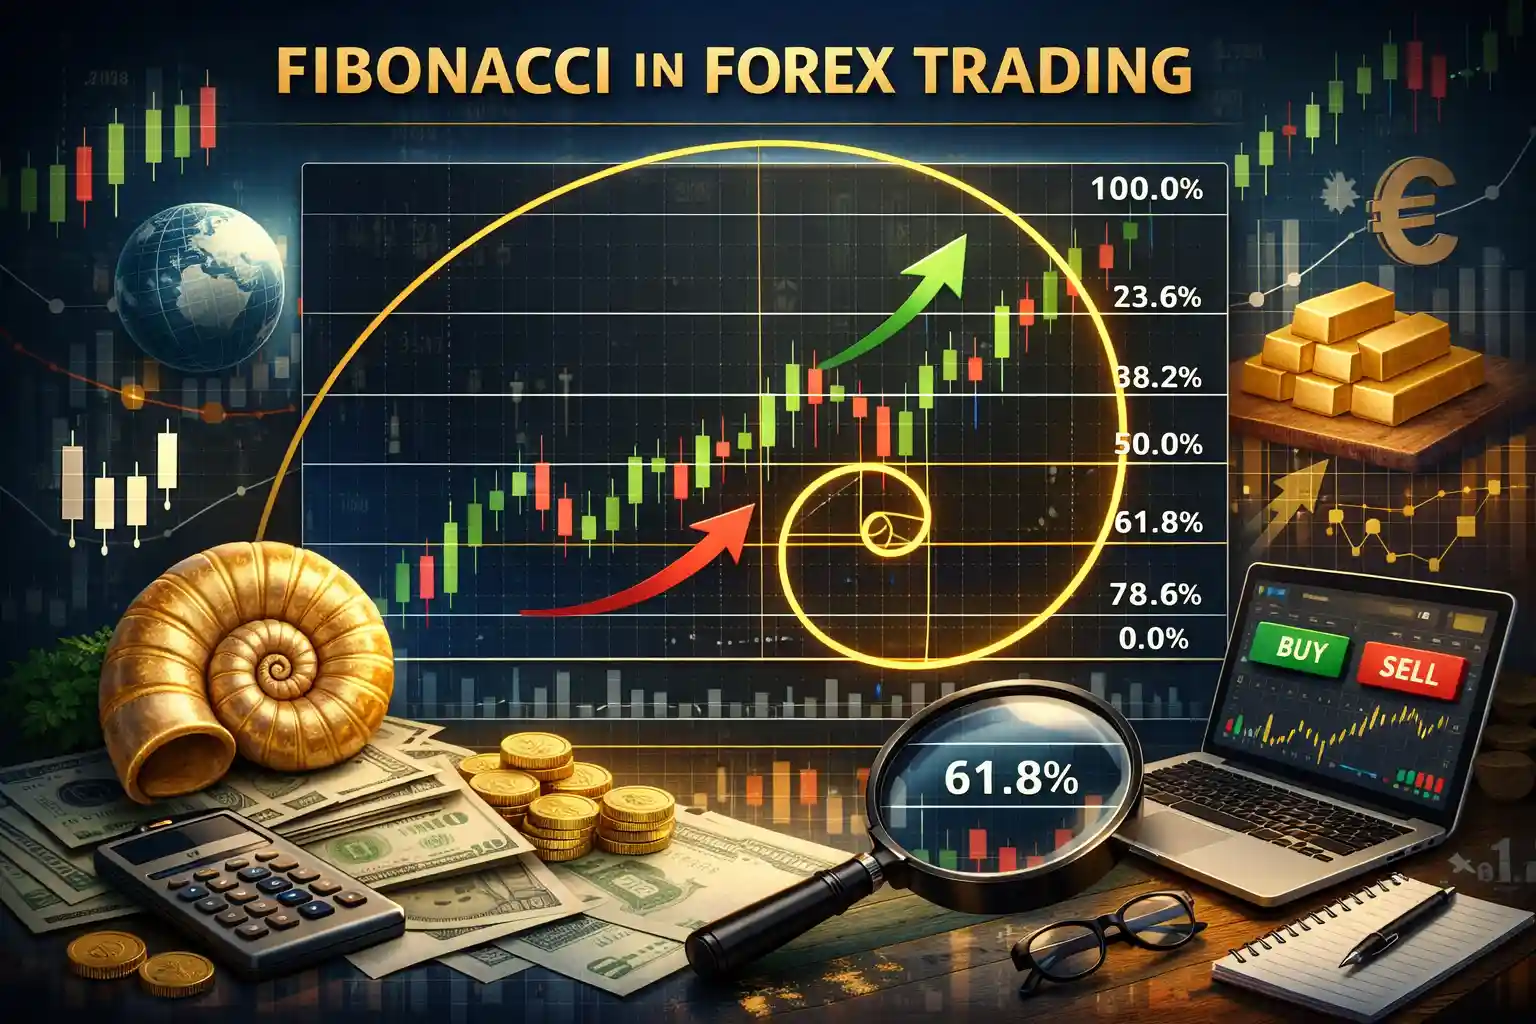
Leonardo Fibonacci discovered a sequence of numbers in which each number was equal to the sum of the two numbers before it. The ratio emerged from this sequence, which surprisingly appears in nature, architecture, art, and even financial markets. We use these ratios as trading references: 23.6%, 38.2%, 50%, 61.8%, and 78.6%.
You don’t need to memorise the sequence or perform any calculations yourself. Modern charting platforms do the heavy lifting. All you have to do is figure out what you’re looking at and know how to use it.
For traders who want a clearer and more practical understanding of these concepts, platforms like otetmarkets help bridge the gap between raw chart data and real-world decision-making by turning Fibonacci levels into actionable insights rather than abstract numbers.
A Quick, Simple Definition
Here’s the easiest way to think of Fibonacci in forex:
Fibonacci is a tool that helps traders predict potential turning points or price reversal levels in the market.
A trader might think, “When will the price make a correction?” if the price has been going up for several hours, or at what point will the price be supported?” if the price has been falling all week.
Fibonacci tools do not provide precise points for where to enter the market, but they indicate commonly accepted price levels that traders pay close attention to. The popularity of Fibonacci makes these areas likely candidates for future price movement. Imagine EUR/USD has been rising all morning. You want to know where it might pull back before continuing upward. That’s exactly where Fibonacci helps — it highlights the zones traders expect the price to pause or reverse.
Understanding the Building Blocks
Before utilising Fibonacci tools, you have to understand two basic ideas:
-
High swing
A swing high is a peak, where the price rises, stops, and then drops.
-
Low swing
In contrast, a swing low is a valley where the price drops, stalls, and then rises. By connecting swing highs and swing lows (or vice versa), the Fibonacci tool automatically generates retracement zones that help traders identify potential reaction areas.
What Is a Fibonacci Retracement? (In Simple Words)
Fibonacci retracement is the most commonly used trading tool. Consider it as a tool to determine how far a price might pull back before continuing in its original direction. Imagine that the price is rising. It rarely climbs in a straight line. It rises, pulls back, then rises again. Fibonacci allows you to estimate how deep that pullback might be.
For example:
The price rises by 100 pips. It retraced 38 pips. That’s close to 38.2%, a popular Fibonacci ratio.
This does not mean that the price will always stop there, but it does provide a disciplined approach to judge the pullback rather than guessing.
The Key Fibonacci Levels You’ll See on Charts
Most platforms automatically calculate the popular percentages between your defined high and low. These are known as Fibonacci levels, and each has a particular psychological function.
Here’s what most traders expect:
23.6%: Shallow retracement.
This suggests high momentum. When prices barely pull back, it usually indicates that buyers or sellers remain quite confident.
38.2% – Healthy normal pullback
This is one of the most frequently watched levels. It shows that the trend is still strong but is taking a break.
50% – Midpoint
This level is not technically part of the Fibonacci sequence, but it is commonly used by traders since markets frequently correct halfway before moving forward.
61.8% – The “Golden Ratio”
This is the most popular level. Many traders consider it a powerful reversal zone.
78.6% – Deep retracement
This level indicates that the trend might continue, but the correction is deep. It is regarded as the last potential bounce area. You do not have to memorise all of these right away. Over time, as you see them appear in real charts, they’ll start to make sense.
Why Traders Trust Fibonacci Tools
There are three basic reasons:
-
It organises your charts.
Instead of staring at endless candlesticks, Fibonacci organises the confusion. It operates as a map for potential areas.
-
It reflects market psychology.
Because many institutional and expert traders employ Fibonacci, markets frequently react to it.
-
It works across timeframes.
Fibonacci behaves consistently on both 1-minute and weekly charts. This provides its versatility, which many tools lack.
Avoiding Common Mistakes With Fibonacci
When using Fibonacci tools, new traders sometimes make mistakes, which can lead to frustration or poor trade entries.
Let’s discuss the most common ones and how to avoid them.
Mistake 1: Drawing Fibonacci Backwards
Your retracement levels will appear inverted if you draw from high to low instead of low to high (or vice versa). Prior to drawing, always determine the trend’s direction.
Mistake 2: Using It Alone
You should never enter a trade based only on Fibonacci. For better confirmation, combine it with candlestick patterns, trendlines, support and resistance, or forex technical analysis.
Mistake 3: Forcing It on Every Chart
The market can occasionally be very erratic, with no clear high or low swing. In some situations, attempting to use Fibonacci can be more confusing than useful.
Read More: What Is Fibonacci in Technical Analysis?
How Fibonacci Fits Into Trading Strategies
Fibonacci is not a strategy by itself; it is a tool that enhances existing strategies. Here are some practical ways traders can use it:
-
Entry Points.
If the price retraces to a level and shows signals of a reversal, traders might consider entering in the direction of the trend.
-
Stop Loss Placement.
Many traders set stops slightly beyond the Fibonacci zone they used to enter.
-
Determine profit targets.
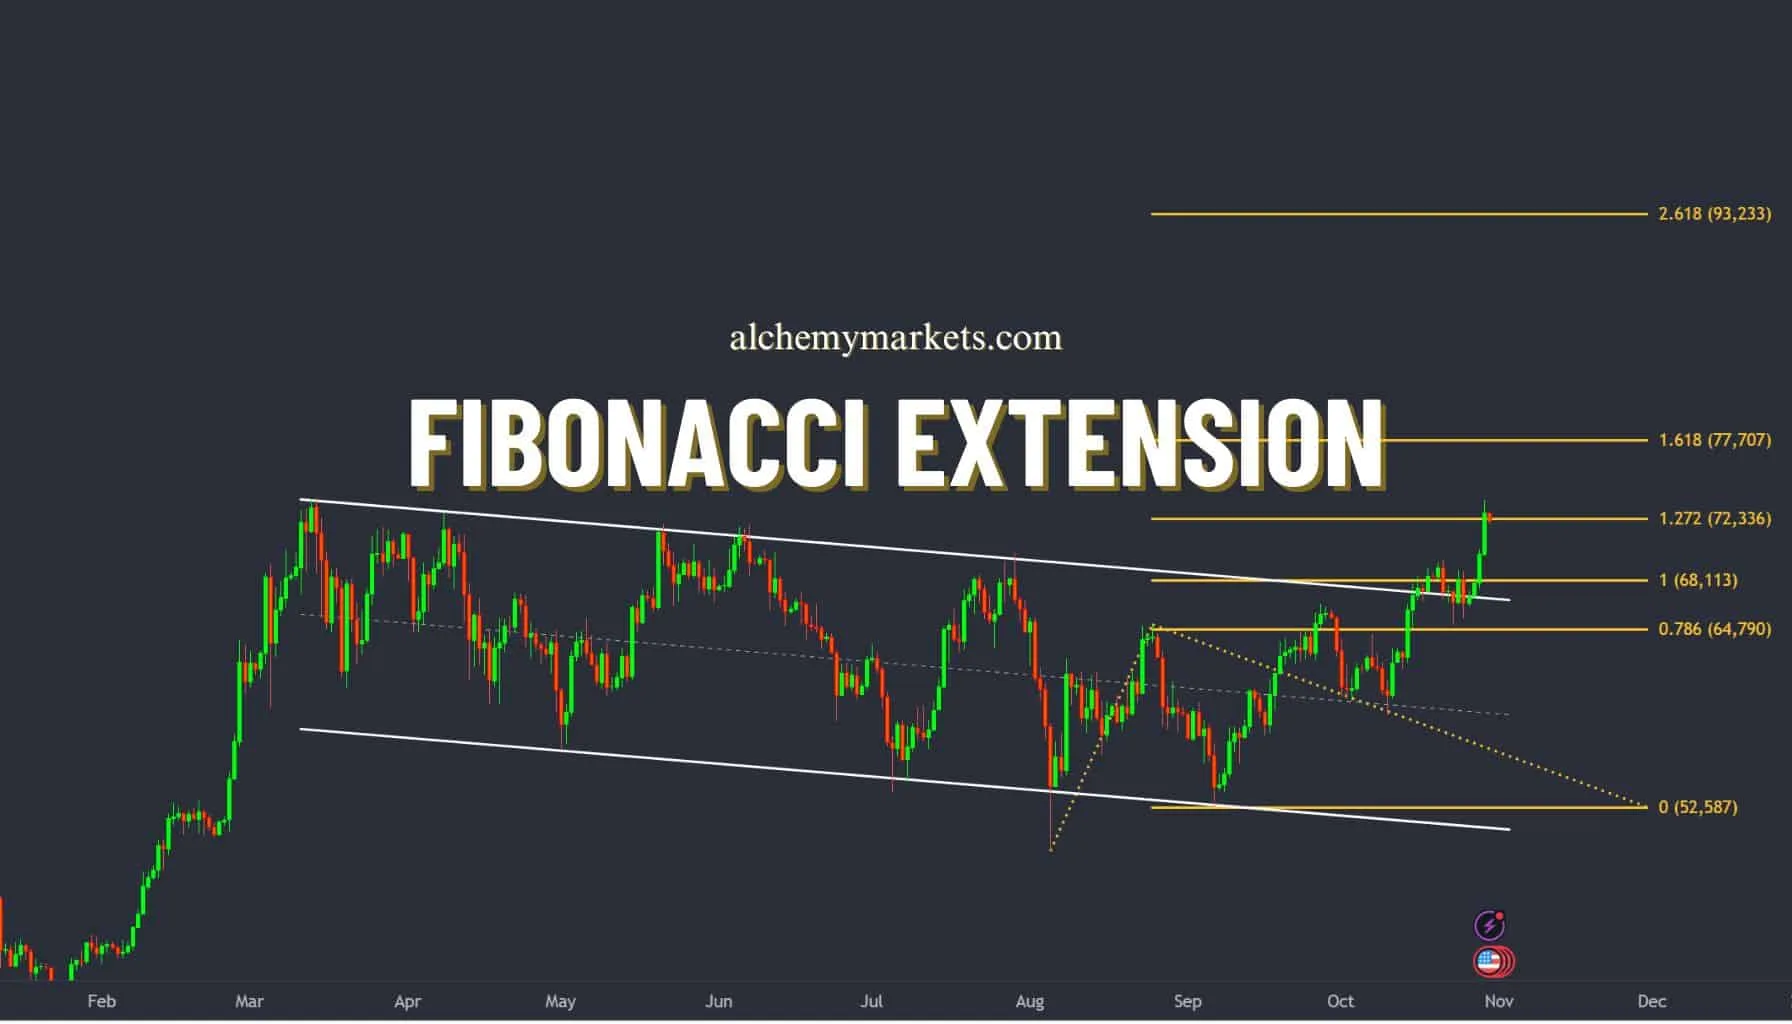
Fibonacci extensions (another tool) help traders predict how far the price will go if the trend continues.
-
Trend Confirmation.
If slight retracements keep happening, it supports the idea of a strong trend.
The Gentle Power of Confluence
While Fibonacci can be useful, it is significantly more powerful when combined with other methods of analysis. This term is known as confluence.
For example:
Fibonacci: 61.8% A rising trendline. A prior support zone. A bullish engulfing candle.
When they coincide, traders consider them as high-probability points. It is not guaranteed—nothing is—but the potential of a reaction increases.
Fibonacci in Trend Trading
Trend traders rely significantly on pullbacks. Entering a trade after the price has pulled back to a strong level can feel safer and more controlled than chasing a breakout. Fibonacci assists in identifying where those pullbacks will land. During a downturn, a trader may consider a short position if the price retraces to 50% and a bearish candle appears.
A trader in an uptrend may say, “If price dips to 38.2% and holds, I’ll look for a long opportunity.” There is no rush. Fibonacci encourages patience, which is one of the most essential trading skills.
Fibonacci for Reversal Setups
Fibonacci is typically employed for retracements, but it can also be used as a support tool to identify potential trend reversals.
For example:
If price approaches the 78.6% retracement on a major timeframe, some traders see it as a “last chance” area where buyers or sellers could return.
Combine that with:
A strong candlestick pattern, High trading volume, Major support or resistance. When combined, Fibonacci becomes an essential decision-making tool.
A Calm Mindset Makes Fibonacci More Reliable
Many traders use Fibonacci effectively while they are calm, but when emotions take over—fear of missing out, irritation, impatience—they begin to misuse it.
Here’s an effective habit:
Before using the Fibonacci tool, take a breath and consider whether the trend is clear.
Are the swings obvious? “Am I forcing this setup, or is it natural?”
If you answer honestly, you will avoid taking many unnecessary positions or points.
How Beginners Can Start Using Fibonacci Today
Using Fibonacci does not require advanced experience. Just follow these beginner-friendly steps:
-
Choose a Trending Market
Avoid choppy, sideways markets when learning.
-
Identify a Clear Swing High and Swing Low
Zoom out if necessary.
-
Draw the Fibonacci Tool
Your platform will automatically generate the percentage levels.
-
Wait for Price to Approach a Level
Patience is the secret ingredient here.
-
Look for Confirmation
Use candlestick patterns, trend direction, and support/resistance.
-
Test Your Approach
Try it on a demo account before using real money.
Why Fibonacci Feels Natural
When you first start using Fibonacci, it might seem like a technical tool. However, the more you use it, the more natural it seems.
What’s the reason? It mirrors the market’s rhythm.
Markets move in cycles, just like waves, heartbeats, and seasons. They advance, retreat, pause, and repeat. Fibonacci simply measures those cycles and makes them easier to understand.
Many traders define Fibonacci as a “gentle guide” rather than a strict rule. It’s flexible but still structured. It adapts to various trading methods and timeframes. And it doesn’t overwhelm you with signals or noise.
The Limitations You Should Know
No tool is perfect, including Fibonacci. Here are some key limitations:
- It does not predict the future.
- Levels can be subjective based on how you draw them.
- It works best in combination with other tools.
- Different traders may draw different swings on the same chart.
However, these limitations are not flaws; they are reminders to be careful, patient, and aware. Fibonacci can assist in your analysis, but it should not dominate it. By now, you should have a clear understanding of how Fibonacci works and why traders rely on it.
Final Thoughts: Why Fibonacci Matters in Forex Trading
Fibonacci is not a magical or difficult concept. Fibonacci is a simple tool to help predict where a price will stop, turn around, or continue moving. If you are new to trading or have years of experience, Fibonacci can assist you in developing your charts, planning your entries and exits, and increasing your patience and confidence in your analyses and subsequent trading decisions.
Most importantly, Fibonacci teaches you the natural rhythm of the market. All successful traders must learn how to recognize this rhythm. Use Fibonacci as a map—not a magic indicator—for your trading journey. Once you become more comfortable and proficient with Fibonacci, it will no longer be an independent tool, but rather a friend to help you on your trading journey. You should not rely on Fibonacci alone and begin to incorporate it into your overall trading plan. With time, experience, and determination, you too can see how many traders all over the world use Fibonacci on a daily basis.
Share
Hot topics
What Is Liquidity in Forex Strategy?
If you’ve ever placed an order and seen how quickly it filled up or how incredibly slow it moved you witnessed liquidity in action. While traders obsess over indicators, entries,...
Read more
Submit comment
Your email address will not be published. Required fields are marked *