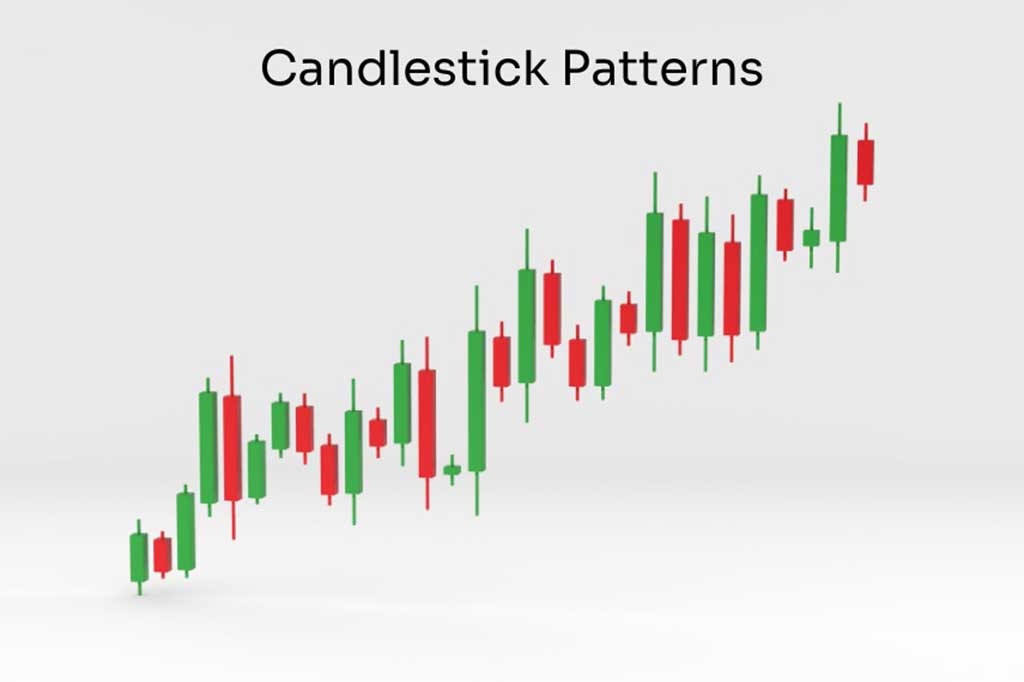
The best candles for trading strategy
Candlestick charts can be very helpful in assessing market trends both past and present. While these charts appear to be simple, they reflect what happened (momentum), how much was at stake (confidence/indecision), and the overall feeling of buyers and sellers (fear).
If you are watching the movement of prices (candlestick/price bars) and wonder why it changed at that point, The best candles for trading as explained by otet markets can provide insight into the reasons behind certain price reversals. There are no guarantees with candlestick patterns; however they are a good first start to visually show you how all the buyers and sellers are acting at that moment in time.
What Are Candlestick Patterns?
Each pattern consists of several candles that replicate identical patterns over and over, indicating potential future price movements as either extension, continuation, or reversal.
All candles are formed during specific lengths of time (i.e., 1 minute, 1 hour, or 24 hours) and provide the following four prices associated with each timeframe; open price, high price, low price, and close price.
When you combine candles, you start seeing “behavior.” Some patterns show strong rejection (price tried to go higher but got pushed down). Others show takeover (buyers or sellers suddenly in control). One important mindset: candlesticks don’t predict the future. They show pressure—and pressure often leads to movement.
How Candlestick Charts Work
A candlestick has two main parts: the body and the wicks (shadows).
The body shows the distance between open and close. A bigger body usually means stronger conviction during that time period. The wicks show the extremes—how far price moved before snapping back. Long wicks often signal rejection, like price tested a level and got slapped away. Timeframe matters more than most beginners think. A pattern on a 5-minute chart can be noise, while the same pattern on a daily chart can be a serious signal.
Also, context matters. A “nice-looking” candle in the middle of nowhere is usually weaker than a candle forming at a key support or resistance level.
Read More: Candlestick Charts
Key Benefits of Using Candlestick Patterns
Candlesticks are popular because they’re fast to read, even when markets get messy.
They help you time entries and exits. Instead of guessing, you can wait for confirmation—like rejection at resistance or a clear reversal signal near support.
They also help you manage risk. When a candle shows rejection, it gives you a logical place for a stop loss (for example, above a wick or beyond a recent swing).
Another benefit is flexibility. You can use candlestick patterns in forex, stocks, and crypto, and you can combine them with indicators without conflict.
And yes—many traders still swear by this core idea: The best candles for trading are the ones that form at meaningful levels, not the ones that look pretty in random areas.
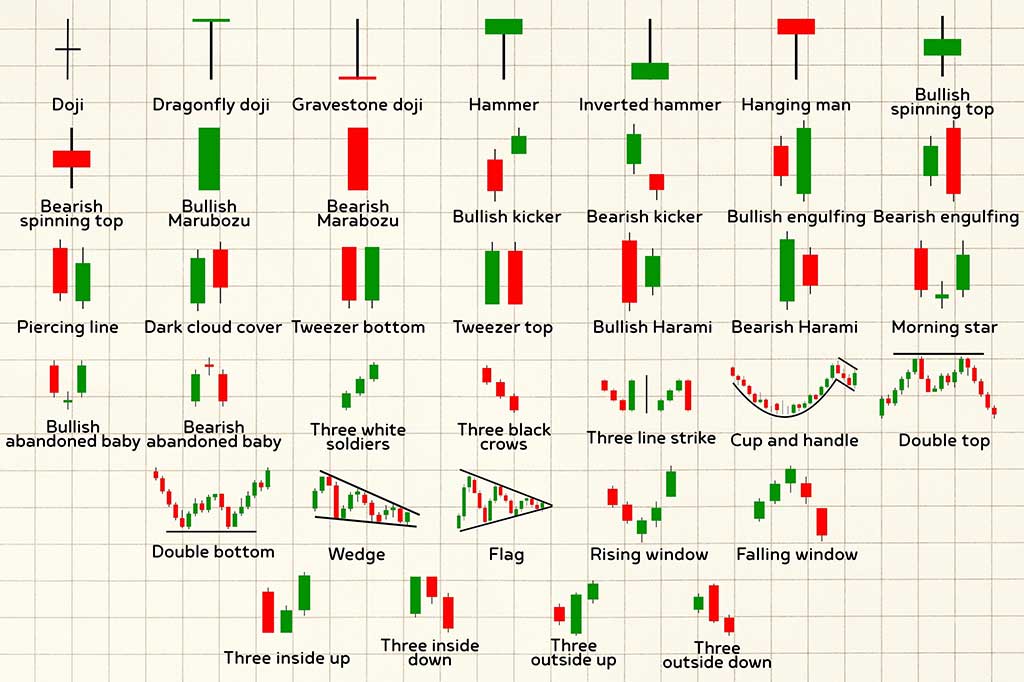
Top Candlestick Patterns Every Trader Should Know
You don’t have to study 50 different images of a pattern; just learn the fundamentals of a few patterns that you will use properly.
Following is a breakdown of the major types of patterns that a large majority of traders start using.
-
Single‑Candle Patterns
1) Doji: A doji candle typically reflects no advancement or direction from either the Buyer or Seller, and generally indicates uncertainty.
The doji candle will have a real body that is either very small or a thin line, and will represent both the Opening and Closing ranges are equal. The doji candle can take on the characteristics of an indecisive candle, which can be confirmed at key Support and Resistance Point through the use of price action analysis, and at key price levels through the use of Technical Analysis, and through the use of Candlestick Patterns.
2). Hammer or Hanging Man: Hammer or Hanging Man exhibits rejection as well as possible exhaustion of either Buying or Selling pressure, and provides an expectation of price reversal. When the Hammer Candle is presented to the Trader after a Trend Down, then the significant long lower wick indicates that there was a price decrease, and due to Buying interest, the price will return to close at or near the opening price. As with all Candlestick Patterns, there must be confirmation of the Hammer Candle through another leading bearish or bullish candle before a successful trade occurs with the Hammer Candle.
trade the hammer alone. Wait for the next candle to support the idea.
-
Double-Candle Patterns
1) Bullish / Bearish Engulfing (takeover)
When the body of the second candle completely wraps the body of the first candle, it is referred to as an engulfing pattern.
When a bullish engulfing occurs in proximity to support, it generally indicates strong buying pressure. In contrast, when a bearish engulfing occurs in proximity to resistance, it usually indicates strong selling pressure.
The engulfing pattern is a very popular pattern because one party has completely overpowered the other party.
2) Tweezer Top / Tweezer Bottom (double rejection)
These form when two candles test a similar high (top) or similar low (bottom), and price rejects that area twice.
They can be powerful around obvious levels, especially if the second candle shows stronger rejection.
-
Multi-Candle Patterns
1) Morning Star / Evening Star (trend shift)
These patterns often show a transition: strong move, hesitation, then reversal.
A morning star appears after a downtrend and suggests buyers are regaining strength. An evening star appears after an uptrend and can signal weakness.
Because they use three candles, they’re slower—but often more reliable than single-candle signals.
2) Three Soldiers / Three Crows (strong continuation or reversal)
Three white soldiers are three consecutive strong bullish candles. Three black crows are the bearish version.
They can show a powerful shift in sentiment, but be careful: if they appear after an extended move, they can also signal late entry risk.
Candlestick Patterns for Different Markets(Forex-Stocks-Crypto)
Candlesticks work in all major markets, but the “personality” of each market changes how patterns behave.
Forex often respects technical levels because of liquidity and repeated sessions (London, New York, Asia). Stocks can react sharply to news, earnings, and market open/close dynamics. Crypto trades 24/7 and can spike aggressively, which creates more fakeouts if you don’t use confirmation.
Here’s a simple comparison you can keep in mind:
| Market | Typical volatility | What helps patterns work better | Patterns often seen as useful | Extra note |
| Forex | Medium | Session highs/lows, clean support/resistance | Engulfing, pin bars (hammer-style), morning/evening stars | Watch major news releases—candles can “lie” during spikes |
| Stocks | Medium to high (around events) | Daily/weekly levels, volume confirmation | Engulfing, doji at key levels, tweezers | Earnings and gaps can break patterns quickly |
| Crypto | High | Higher timeframe signals, strong risk control | Long-wick rejection candles, engulfing with confirmation | 24/7 trading means patterns can form anytime—avoid overtrading |
If you’re trading in high volatility markets (primarily crypto), my suggestion would be to use longer-term charts and have more confirmation of your trade set-ups by waiting for the next candle.
This is also the point where Candlestick trading is more about rationally managing your probabilities through discipline rather than finding & predicting the candlestick patterns.
How to Use Candlestick Patterns in a Trading Strategy
A usable strategy needs three things: context, trigger, and risk management.
1) Start with context (where are we?)
Ask: is price at support, resistance, trendline, or a range boundary? Patterns matter most at decision points.
2) Wait for a trigger (what confirms it?)
A common trigger is the close of the candle that confirms the pattern. For example, after a hammer at support, you might wait for the next candle to close bullish.
3) Define your risk (where is the trade wrong?)
Stops often go beyond the wick or beyond the level you’re trading from. If price breaks that area, your idea is likely invalid.
A simple example (easy to visualize):
Price drops into a support zone you’ve marked. A hammer forms (long lower wick), showing rejection. The next candle closes above the hammer’s high. You enter with a stop below the hammer’s low. Your target could be the next resistance area.
That’s a full “story”: level → signal → confirmation → logical stop → planned target.
If you’re using a platform like cTrader, you can make this process smoother by marking levels, placing quick orders, and adjusting risk precisely. On some broker setups (like the Otet trading platforms), you may see account details such as a $25 minimum deposit, floating/min spreads, and a stop-out level.Those details matter because they affect how much room you can realistically give your trade.
Combining Candles with Indicators
Candlestick patterns get stronger when they align with other tools—without turning your chart into a mess.
Here are clean combinations that many traders use:
1) Candles + Moving Averages (trend filter)
Use a moving average to define trend direction. Then focus on bullish patterns in an uptrend and bearish patterns in a downtrend. This alone can filter out a lot of low-quality signals.
2) Candles + RSI (momentum + exhaustion)
If RSI is oversold and you see a bullish engulfing at support, that’s a stronger “buyers are stepping in” story. If RSI is overbought and you see a bearish engulfing at resistance, it’s the opposite.
3) Candles + Volume (especially for stocks)
A bullish engulfing with higher-than-normal volume often matters more than the same pattern with weak volume.
4) Candles + Support/Resistance (the foundation)
If you only combine candlesticks with one thing, make it levels. Levels give the pattern meaning.
On execution-focused setups—especially on cTrader platforms—many traders keep it simple: levels + a trend filter + candlestick confirmation.
Common Mistakes When Trading Candlestick Patterns
-
Trading patterns in the middle of nowhere
A perfect-looking engulfing candle is weaker if it forms away from important levels.
-
Ignoring confirmation
Many patterns need a follow-up candle to confirm. Jumping in early is one of the fastest ways to collect small losses.
-
Overusing Patterns
If all your signals look like they’re giving you a buy signal, you may take too many trades and end up being broke. Therefore, it’s better to select a few patterns and become proficient with them.
-
Trend Ignorance
While counter-trend patterns can work, they require additional confirmation to validate and more restrictive risk management to protect you from losing money quickly.
-
Bad Stop-Loss Placement
If your stop is so tight it sits inside normal candle noise, you’ll get stopped out even when your idea is right.
-
Treating candlesticks as “certainty”
Patterns are probability tools, not promises. The goal is stacking edges, not being right every time.
Conclusion
Candlestick charts have become extremely popular as a means of quickly visualizing price movements and demonstrating the case of price development in a timely and effective manner. The true value of candlestick charts is determined by the way that traders use them to recognize the market moves which they identify.
The most important thing to remember is this: Candlestick patterns are only meaningful when they occur at an appropriate location, with confirmation, and when there is risk management in place. Begin with a few good candlestick patterns that you can learn and practice identifying at top quality levels. Then maintain a consistent approach. Eventually, you will no longer see random candles on the chart but rather see price movement in the market.
FAQ
Patterns are the repeating shapes of candles that represent the buying/selling pressure, and therefore the continuation, reversal, and indecision of price movements.
Candlestick patterns that are typically easiest for traders to learn and employ are engulfing patterns, doji pattern , and hammer styled rejection candles / patterns.
One candle is typically used to form a single candle pattern while two are normally used in a double candle pattern. In contrast,multi candles will usually consist of 3 or more, and represent speed of trading vs. confirmation of trading.
Candle patterns can be effective in volatile markets; but they generally require higher timeframes, stronger confirmation and tighter risk controls (especially in cryptocurrencies).
They permit you not to have to guess the timing of your trade but rather will allow you to accurately enter your trades after an appropriate area of price "rejection" and/or confirmation (therefore providing cleaner entries with more logical stop loss placements).
Share
Hot topics
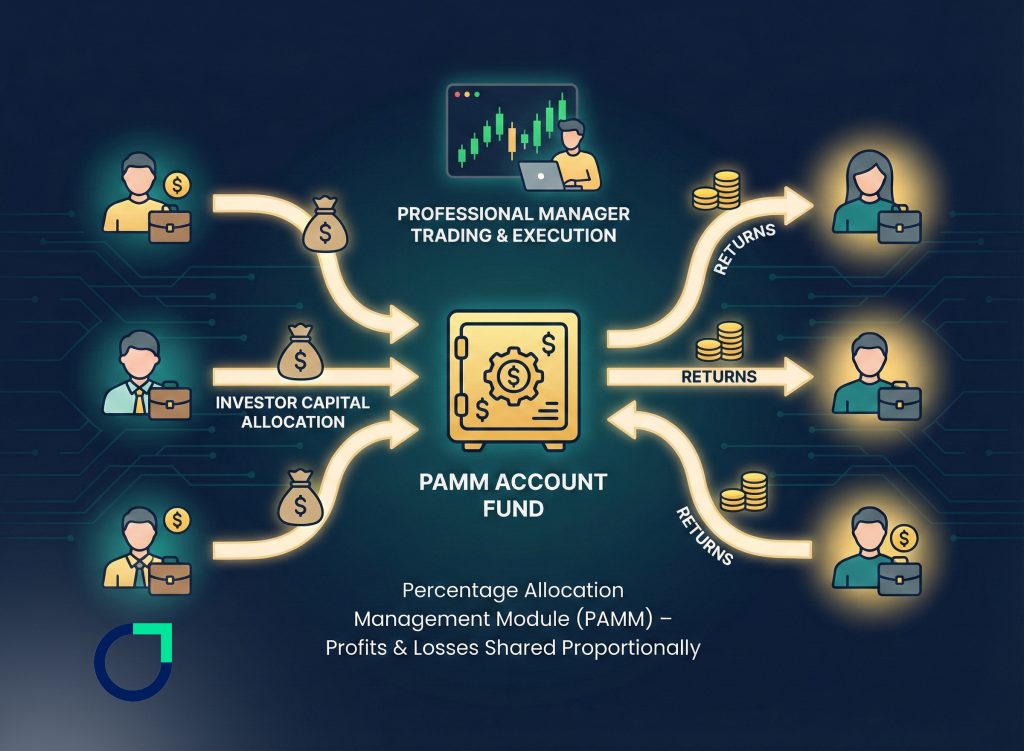
What Is a Forex PAMM Account? Complete Guide
Introduction If you’ve ever wanted to invest in Forex but had reservations about doing it alone, you’re not by yourself! Many people are interested in investing in the Forex market...
Read more


Submit comment
Your email address will not be published. Required fields are marked *