What Is Ichimoku? A Complete Guide to One of the Most Powerful Technical Indicators
Estimated reading time: 5 minutes
Table of contents
The Ichimoku Kinko Hyo indicator, commonly known as Ichimoku, is one of the most versatile and insightful tools in technical analysis. With a single glance, traders can assess the overall market trend, identify potential entry and exit points, measure trend strength, and detect dynamic support and resistance zones. Developed by Japanese journalist Goichi Hosoda, Ichimoku has grown into one of the most widely used indicators across Forex, stock, and cryptocurrency markets.
The Meaning Behind Ichimoku Kinko Hyo
In Japanese, “Ichimoku Kinko Hyo” translates to “one glance equilibrium chart.” Unlike many indicators that display only one or two lines, Ichimoku provides five interconnected components that form a shaded area known as the cloud or “Kumo.” This comprehensive design offers a complete picture of market conditions in real-time, helping traders make informed decisions quickly and confidently.
Breaking Down the Components of Ichimoku
The first component is the Tenkan-sen or conversion line, calculated as the average of the highest high and lowest low over the past nine periods. It reflects short-term price movement and momentum. Next is the Kijun-sen or base line, derived from the average of the highest high and lowest low over the past 26 periods. It acts as a directional guide and dynamic support or resistance level.
Senkou Span A, the first boundary of the cloud, is the average of the Tenkan-sen and Kijun-sen, projected 26 periods into the future. It outlines one side of the cloud and signals the potential future direction of the market. Senkou Span B, the second boundary, is calculated using the average of the highest high and lowest low over the past 52 periods and is also projected 26 periods ahead. It complements Span A in forming the cloud and indicates trend strength and potential reversal zones.
Finally, the Chikou Span, or lagging line, plots the current closing price 26 periods behind. This helps confirm the trend by comparing the present price to historical levels and offering a visual snapshot of whether current momentum aligns with previous price action.
Read More: What Is Trading and Who Is a Trader?
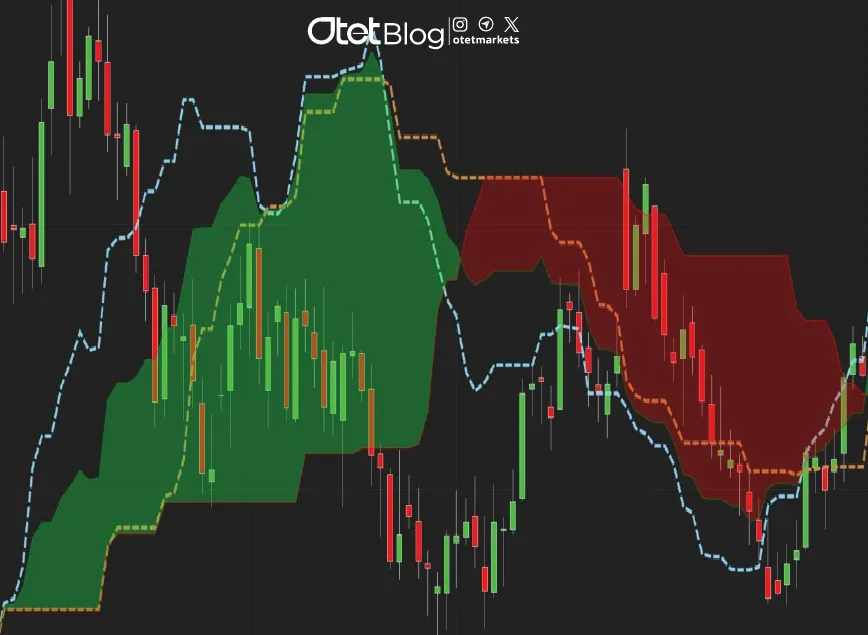
The Power of the Ichimoku Cloud
The space between Senkou Span A and B creates the Ichimoku Cloud, a shaded area that represents dynamic support and resistance. When price is above the cloud, the market is generally in a bullish trend. When it’s below, the trend is bearish. If price moves within the cloud, the market is likely in consolidation or a range-bound phase. The thickness of the cloud plays an important role too—thicker clouds indicate stronger support or resistance, making it more difficult for price to break through.
How to Use Ichimoku for Market Analysis
Ichimoku is a powerful tool for identifying market direction, spotting entry and exit signals, and confirming trends. When price is clearly above or below the cloud and the Tenkan-sen and Kijun-sen lines are aligned in the direction of the trend, traders can confirm the overall market sentiment. A bullish entry signal typically occurs when the Tenkan-sen crosses above the Kijun-sen while price remains above the cloud. A bearish signal, on the other hand, is generated when the Tenkan-sen crosses below the Kijun-sen while price is trading below the cloud. The edges of the cloud and the Kijun-sen line also serve as reliable support and resistance levels that adapt with market conditions. To further validate signals, traders look at the Chikou Span—if it’s positioned above the price, it supports a bullish trend; if below, it supports a bearish trend.
Practical Ichimoku Strategy for Any Market
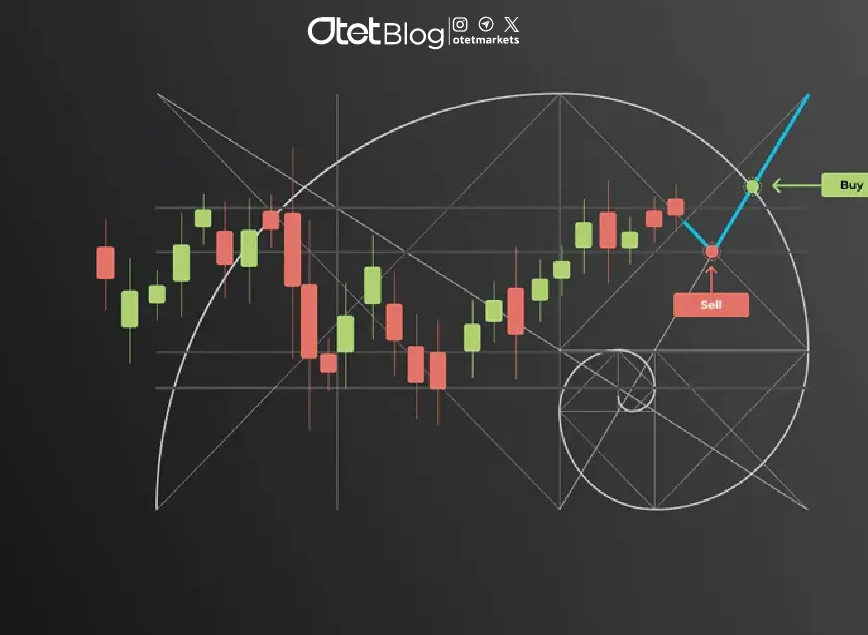
Traders can use Ichimoku in any market, including forex, stocks, and crypto. For a buy setup, all conditions should align: price above the cloud, Tenkan-sen crossing above Kijun-sen, Chikou Span above the current price, and the future cloud showing bullish momentum with Senkou Span A above Senkou Span B. Stop-losses are often placed below the cloud or Kijun-sen, and profits are taken at the next resistance or when a reversal signal appears.
For a sell setup, price should be below the cloud, Tenkan-sen should cross below Kijun-sen, Chikou Span should be below the current price, and the future cloud should show bearish sentiment with Span A below Span B. Stop-losses can be set above the cloud or Kijun-sen, while take-profits are typically based on the next support level or a change in trend.
Read More: The MACD Indicator: A Key Tool for Technical Analysis
Advantages and Limitations of Ichimoku
Ichimoku offers several strengths—it provides a comprehensive view of the market at a glance, offers reliable signals for trend-followers, and adapts to changing market conditions through dynamic support and resistance. It’s also highly versatile, suitable for use in nearly all financial markets. However, it does have limitations. In sideways or highly volatile markets, Ichimoku may generate false signals. Also, its multi-line structure might appear complex to beginner traders, making it essential to use it in combination with other tools like RSI or volume indicators for confirmation.
Final Thoughts
Ichimoku is more than just an indicator—it’s a powerful framework for understanding market dynamics. With its ability to provide both trend direction and potential reversal zones, it’s a valuable tool for traders seeking clarity and precision in their analysis. If you’re new to Ichimoku, consider testing it on a demo account first. Get familiar with how the components interact and how the signals play out in real-time. Once you become comfortable using it, Ichimoku can become one of the most reliable tools in your trading strategy.
Share
Hot topics

Federal Reserve’s Challenges to Trump’s New Policies
As the Federal Reserve Open Market Committee (FOMC) prepares for its upcoming meeting, all eyes are on how the Fed will respond to Donald Trump’s latest economic policies. With the...
Read more


Submit comment
Your email address will not be published. Required fields are marked *