What Is Fibonacci in Technical Analysis?
Estimated reading time: 3 minutes
Table of contents
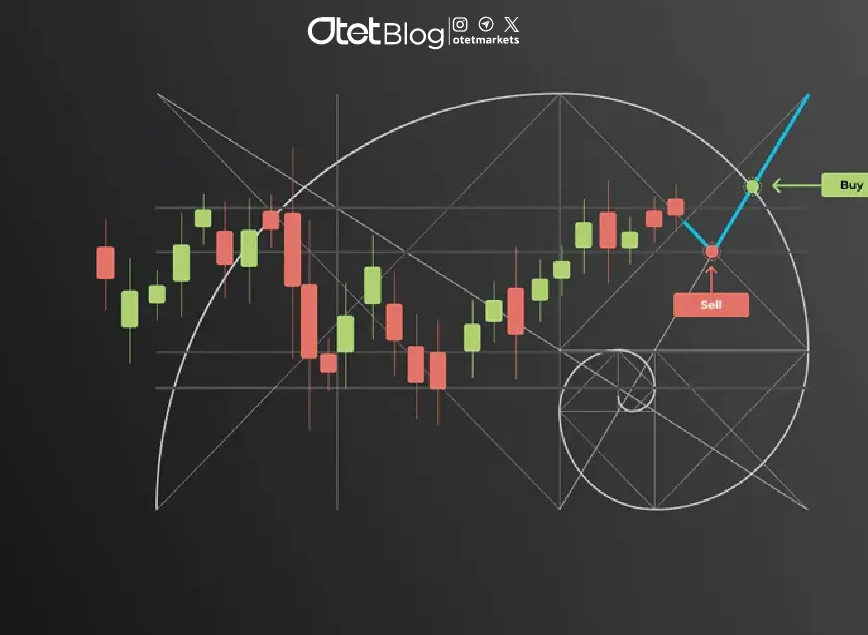
In the world of technical analysis, many tools help traders identify entry and exit points, as well as key support and resistance levels. Among the most powerful and widely used tools is the Fibonacci tool.
Fibonacci is not just mathematically fascinating — it surprisingly mirrors patterns found in financial markets. In this guide, we’ll explore the core logic, different Fibonacci tools, and smart trading strategies using them.
The Logic Behind Fibonacci in Markets
The Fibonacci sequence is a series of numbers where each is the sum of the two preceding ones: 1, 1, 2, 3, 5, 8, 13, 21, 34, ...
From this sequence, we derive ratios used in market analysis:
| Fibonacci Ratio | Common Use |
|---|---|
| 23.6% | Minor pullback levels |
| 38.2% | Shallow retracements |
| 50% | Psychological level (not a true Fibonacci ratio) |
| 61.8% | Golden Ratio – major reversal level |
| 78.6% | Deep corrections |
These ratios are used in tools such as Retracement, Extension, and Projection.
Types of Fibonacci Tools
1️⃣ Fibonacci Retracement – Catch the Pullback
Helps identify temporary reversals during trends.
🔍 Key Uses:
- Re-entry after a pullback (e.g., 38.2%, 50%, 61.8%)
- Placing smart stop-losses just beyond the next level
- Boosting confidence when combined with:
- 📉 Candlestick patterns (Pin Bar, Engulfing)
- 📏 Price structure (support/resistance)
- 📈 Indicators (like Moving Averages)
💡 Pro Tip: If a retracement level aligns with a static support or a moving average, it becomes a stronger potential reversal zone.
Read More: Understanding Technical Analysis
2️⃣ Fibonacci Extension – Map Future Price Targets
Used to forecast potential take-profit levels after a trend resumes.
🔍 Key Uses:
- Target setting using levels like 100%, 161.8%, 261.8%, and 423.6%
- Gradual profit-taking zones or trailing stops
- Stronger signals when levels align with:
- 📊 Historical highs/lows
- 🧠 Psychological levels
- 🔍 Technical resistance areas
💡 Important: Draw from three points – trend start, trend end, and retracement end – for accurate projections.
3️⃣ Fibonacci Projection – Predict Future Wave Moves
Advanced tool used by wave analysts (like Elliott Wave followers).
🔁 Setup:
- Start of Wave 1
- End of Wave 1
- End of Wave 2
🎯 Targets include:
- 100%
- 127.2%
- 161.8%
- Sometimes 261.8%
📌 Often used to forecast where Wave 3 or 5 might terminate.
💡 Advanced Tip: Works best when wave structure is clean and corrections are traceable (zigzag, flat, etc.).
Read More: Mastering Multi-Timeframe Analysis for Smarter Trading Decisions
How to Use Fibonacci Retracement Step-by-Step
1️⃣ Identify Market Trend: Uptrend or downtrend
2️⃣ Activate the Fibonacci Tool: On platforms like MetaTrader or TradingView
3️⃣ Draw the Tool:
- In an uptrend: from Low to High
- In a downtrend: from High to Low
4️⃣ Observe Key Levels: 38.2%, 50%, 61.8% are vital
5️⃣ Wait for Confirmation: Use with:
- Candlestick signals (e.g., Hammer, Engulfing)
- Indicators (RSI, MACD)
- Support/Resistance zones
💡 Pro Tip: Higher timeframes give more reliable retracement levels.
Trading Strategies Using Fibonacci
✔️ Combine with Indicators
| Tool | Signal Strength Example |
|---|---|
| RSI | RSI below 30 at 61.8% = strong buy potential |
| MACD | Crossover at a Fibonacci level = momentum confirmation |
✔️ Combine with Price Action
Look for:
- Engulfing candles at levels
- Structure-based confluence (e.g., trendline + 50%)
- Multiple price reactions confirming the level
✔️ Combine with Chart Patterns
| Pattern Type | Fibonacci Use |
|---|---|
| Inverse Head & Shoulders | Neckline aligns with 61.8% = breakout strength |
| Flag / Triangle | Correction ends at 50% = trend continuation |
💡 Many harmonic patterns also rely on Fibonacci levels as Potential Reversal Zones (PRZ).
Pros & Cons of Fibonacci Tools
| ✅ Pros | ⚠️ Cons |
|---|---|
| Simple, intuitive, and widely used | Can generate too many levels (overload) |
| Combines well with other strategies | Not 100% reliable on its own |
| Works on any time frame | Needs accurate points for meaningful results |
Final Thoughts
The Fibonacci tool is more than just math — it’s a trader’s guide to understanding price behavior. While no tool is perfect, Fibonacci becomes extremely powerful when combined with:
- 🔎 Indicators like RSI, MACD
- 🕯️ Candlestick patterns
- 🔁 Market structure & classic patterns
Whether you’re a short-term trader or position holder, Fibonacci can help you identify key reversal zones, continuation points, and strategic exits. But like any tool, it requires:
✔️ Practice
✔️ Market awareness
✔️ Smart risk management
🧭 Mastering Fibonacci is not about prediction — it’s about preparation.
Share
Hot topics

What is News Trading in Forex? A Complete Guide to Event-Driven Strategy
Introduction If you have ever watched the forex market during a major economic announcement, you know how dramatic it can be. Prices jump within seconds. Spreads widen. Volatility explodes. For...
Read more

Submit comment
Your email address will not be published. Required fields are marked *