
A Huge Week Ahead with ECB in Focus!
Following a mixed NFP report, this week will bring crucial economic data, including the US CPI report, which could influence the Fed’s upcoming decision. The spotlight will also be on the ECB’s interest rate decision, along with key data from around the globe:
- Monday: Japan’s current account and Q2 GDP, China’s inflation, and Eurozone’s Sentix index.
- Tuesday: Australia’s consumer sentiment, China’s trade data, UK employment figures, and CPI data from Sweden and Norway.
- Wednesday: UK GDP and manufacturing output, Russia CPI, and US CPI.
- Thursday: New Zealand’s retail sales, Japan’s corporate goods prices, Sweden’s CPI, ECB rate decision, US jobless claims, PPI, and Canada’s building permits.
- Friday: Japan’s industrial production, French CPI, Eurozone industrial production, CBR rate decision, and US Michigan surveys.
USA: USD and Wall Street!
The long-awaited August payroll report had very different reactions in the first hours. The US economy added 142,000 jobs in August, below the expected 164,000, with July figures revised sharply down to 89,000. The unemployment rate fell to 4.2% from 4.3% in July, in line with estimates. Average hourly earnings rose 0.4% month on month and 3.8% year on year, exceeding expectations.
Overall, the data suggests that the US labor market is cooling, though not as badly as feared. Still, the market reaction changed quickly. Right after the release, CME Group’s Fed Watch tool showed about a 49% chance of a 50 basis point rate cut. One hour later, it increased to about a 60% chance, but by the end of the week, it had dropped to only a 30% chance—even less than at the time of the data release! This shows how quickly market participants can change their expectations with any new signal.
In short, the Non-Farm Payroll (NFP) data shows that the labor market has normalized and is no longer exerting upward inflation pressure. Now, the Consumer Price Index (CPI) and Producer Price Index (PPI) numbers will determine whether the Fed will need to maintain its restrictive policy stance.
We also should not forget about US-China trade tensions! The negotiations between the US and China are still ongoing, with no clear resolution in sight. This uncertainty could weigh on the USD, as it might create safe-haven outflows towards the greenback.
In the coming week, we will have the very important US CPI rates for August. Should the rates accelerate or even show resilience in inflationary pressures in the US economy, it could contradict the market’s dovish expectations, forcing the market to reposition itself and thus provide support for the USD, and vice versa.
The Fed’s focus has turned to the labor market, but the 2% inflation target remains crucial for policymakers. We expect both the CPI and Core CPI to increase at the same pace in August as they did in July. With a 0.2% monthly rise, we estimate the year-on-year CPI to fall to 2.6% (a level not seen since March 2021), while the Core CPI is expected to remain unchanged at 3.2%. Overall, August will provide clues on the extent to which goods prices could fall further and whether services, particularly shelter, can continue to drive disinflation.
As we are not expecting any surprises in the inflation numbers, it appears there is almost zero chance of a 50-basis-point rate cut, given the economic data and the current political situation in the country. With the November election approaching, policymakers are likely to be more cautious in their decisions, as they do not want to be accused of favoring or opposing any political party.
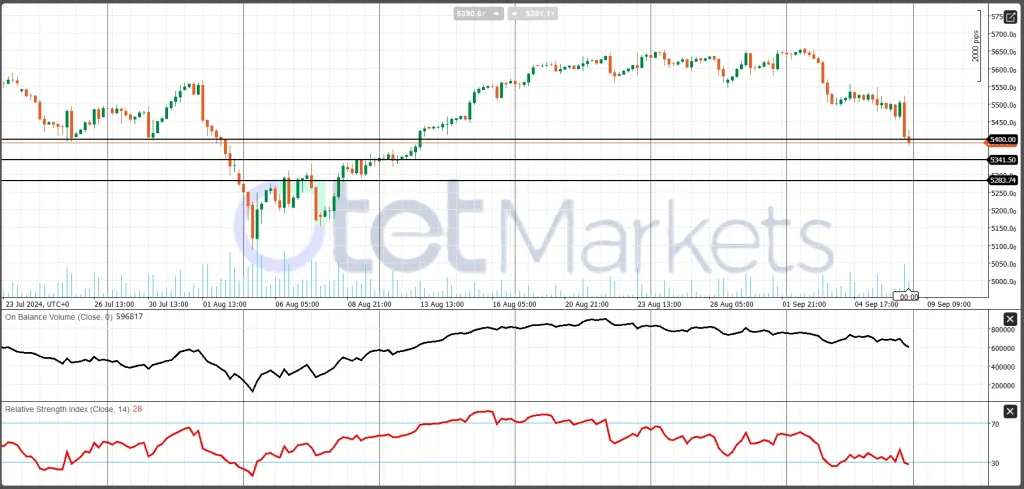
From a technical perspective, the S&P 500 is losing steam, particularly below 5,400. The overall trend remains bearish, with On-Balance-Volume (OBV) confirming cash withdrawal from the market. Staying below its pivot at 5,400 will put the first support (S1) at 5,340 on the radar, followed by the second support at 5,280. Conversely, a recovery above 5,400, which is currently its first resistance, could change market direction and sentiment.
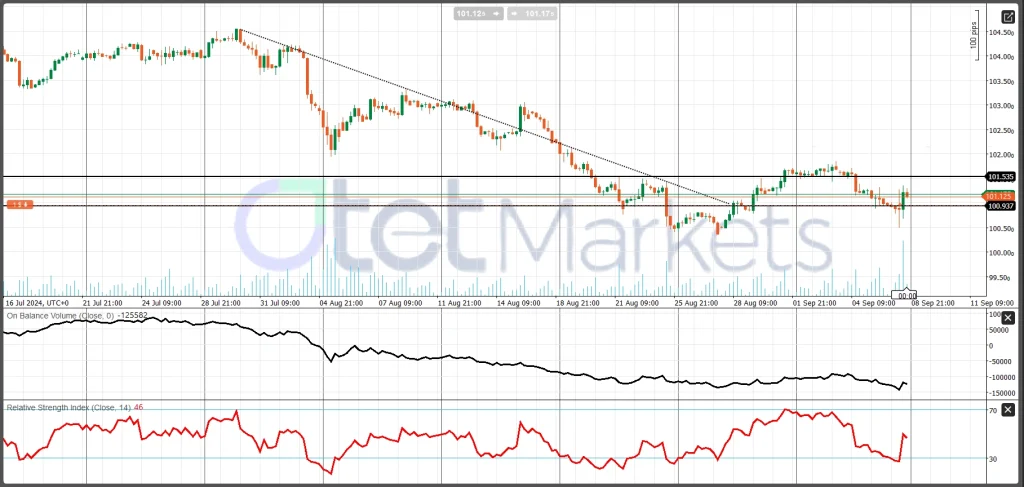
While stock markets are weighed down by a weaker economic outlook and slower growth, the DXY (U.S. Dollar Index) is also pressured by the expectation of more dovish policies. However, market uncertainty has increased cash demand, while geopolitical tensions have raised the USD’s safe-haven appeal. From a technical perspective, the DXY remains in an overall bearish trend, with 101 as the key pivot level. The 101.50 level serves as key resistance, and a recovery above that could keep buyers in the market.
EUR and ECB Decisions in Focus!
While economic data released so far from the Eurozone still indicates weakness in the region’s economic growth, and inflation is falling in line with the European Central Bank’s expectations, it is widely expected that the ECB will cut both the refinancing and deposit rates by 25 basis points.
Recent economic news, while mixed, has been generally subdued, supporting the case for ECB easing this month. Eurozone Q2 GDP grew by 0.2% quarter-on-quarter and 0.6% annually. On the PMI front, boosted by the Paris Olympic Games, the Eurozone HCOB Services PMI registered at 52.9 in August, up from 51.9 in July, and the composite PMI stood at 51.0 in August, rising from 50.2 in July.
On the inflation front, the Consumer Price Index (CPI) inflation year-on-year met the forecast of 2.8% in August, down from 2.9% in July. On a monthly scale, the Core CPI rose from -0.2% in the previous month to 0.3% in August. Additionally, the Eurozone unemployment rate in July was recorded at 6.4%, below the expected 6.5% and lower than the June figure.
Given the mentioned data, current market conditions, and clear expectations, the market’s attention is now focused on the ECB’s accompanying statement and, especially, ECB President Lagarde’s press conference shortly after the statement’s release. Market participants and investors are eager to see how many more rate cuts might be on the policymakers’ horizon. However, regarding the next steps, we expect the central bank to reiterate that it remains data-dependent and will take a meeting-by-meeting approach.
It is also very important to follow the ECB’s updated economic projections closely. In its June projections, the ECB forecasted Core CPI at 2.0% in 2026. We think that this forecast could remain unchanged or perhaps even be revised slightly higher in the September projections.
If the ECB’s guidance and projections unfold as we expect, we would view this as supportive of another pause in October before the next rate cut in December. However, if the ECB uses a more dovish tone in its statement, it could increase market expectations for more rate cuts, putting pressure on the Euro against its crosses.
On the geopolitical front, we observe growing disagreements between policymakers and voters, particularly on issues such as immigration and the Ukraine war. Taking the latest German election into account, this becomes clearer. In local elections in the former East German states, right-wing parties made decisive and impressive gains, far-left parties strengthened, and the ruling parties saw significant losses. This widening gap between parties tends to intensify uncertainty for the EU’s political outlook, which, in turn, could weaken the Euro in the longer term if they cannot find a resolution.
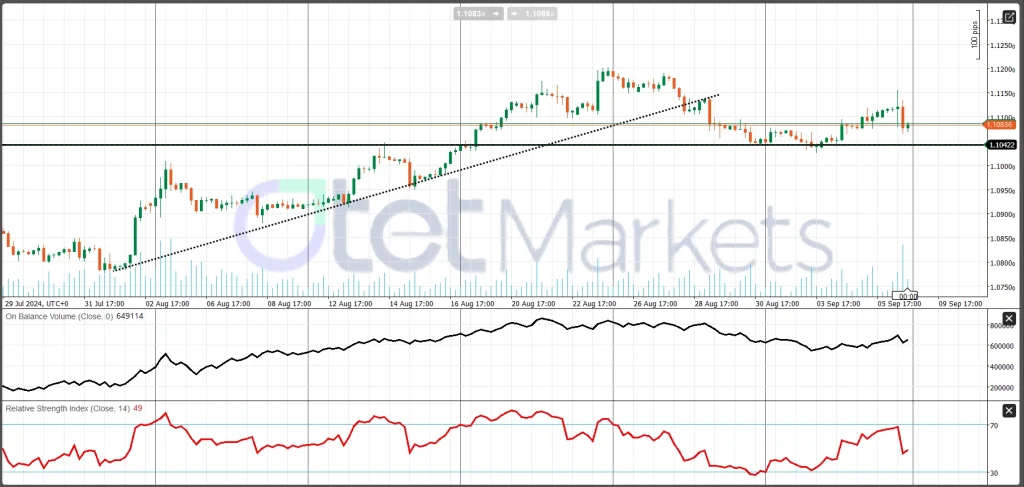
From a technical perspective, the Euro is starting to show a bearish trend against the Dollar, with strong support (S1) at 1.1040. A break below this level could open the door for the next support (S2) around 1.0950. Conversely, if the Euro holds above S1, it could shift its orientation toward the first resistance level at 1.12.
Gold
The latest data shows that the labor market is cooling, as expected, and the Fed’s focus has shifted more toward the job market compared to its previous inflation priority. The market is now pricing in more rate cuts, which has resulted in lower bond yields. Lower yields can reduce the opportunity cost of holding gold, a non-yielding asset.
A weaker labor market, coupled with a decline in manufacturing activities, appears to be a negative indicator of the state of the US economy and fuels expectations of a 50-basis point rate cut in September. Regardless of whether the rate cut in this meeting is 50 bps or 25 bps, the market is pricing in continued rate cuts in each of the remaining three meetings of the year. With a more dovish Fed, it is reasonable to assume that gold prices will continue to rise.
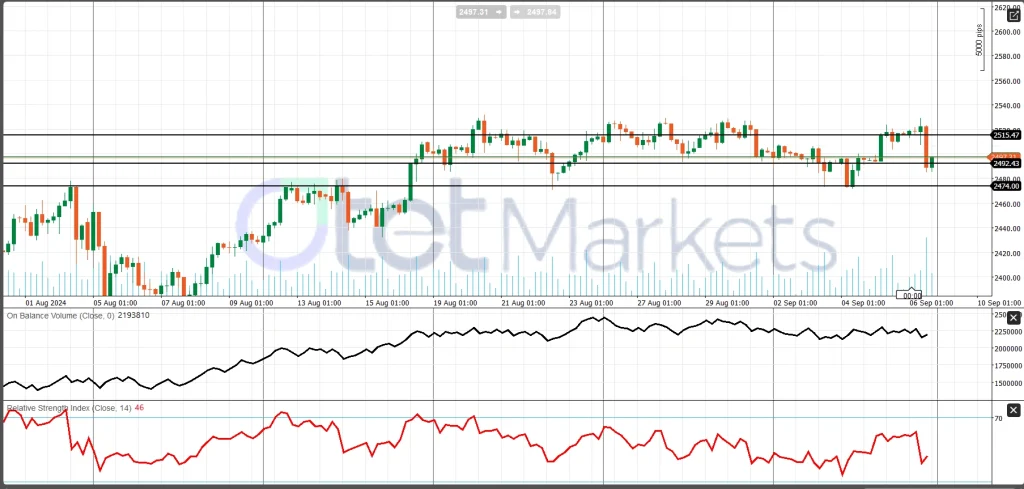
Additionally, ongoing geopolitical and political tensions and uncertainties make it more logical to keep gold in our portfolio. From a technical perspective, gold is moving in a consolidation trend, with strong support around 2,470, waiting for more reasons to move higher. However, breaching and holding below this strong support could change the scenario, at least in the short term.
Oil
The mixed stock market and uncertain demand outlook have led traders and investors to largely ignore inventory reports. According to the US Energy Information Administration, commercial crude oil inventories (excluding those in the Strategic Petroleum Reserve) fell by 6.9 million barrels from the previous week, bringing the US crude oil inventories to about 5% below the five-year average for this time of year.
In Libya, tensions over oil exports have finally eased, as both governments within the country have agreed on central bank management and an oil export system. It appears that OPEC+ members are considering continuing their production cut plan until the end of the year, which was originally planned to end at the close of the third quarter.
Morgan Stanley warns that OPEC+ members, particularly Russia, may be forced to delay their output increases indefinitely. Despite this, they still expect Brent crude prices to average $75 a barrel in 2025, even after dipping into the low $60s by year-end.
Reviewing various scenarios and analyses confirms that, for several reasons, analysts have lowered their price forecasts compared to a few weeks ago. However, falling much below $70 could be challenging under current market conditions, and if it does, such a price movement is likely to be short-lived.
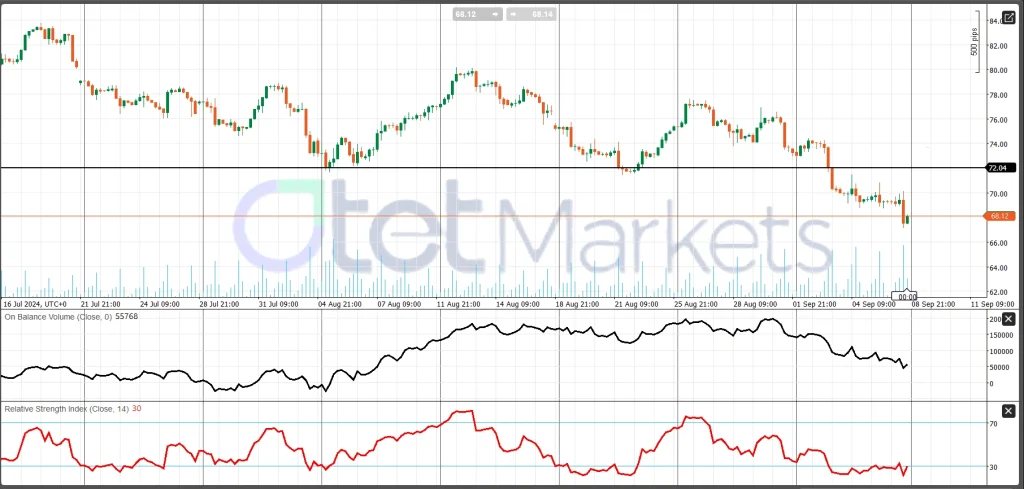
From a technical perspective, there is a very strong pivot at $72, and any bullish scenario would first require a move above that level. Analyzing the candlestick patterns reveals many small-bodied candles, indicating increased uncertainty and doubt among investors. This uncertainty may prevent more selling in the short term and could lead to a temporary price increase before any next upward or downward movements.
Bitcoin
Bitcoin prices have struggled to gain momentum as the Fear and Greed Index remains in the fear territory. Global market concerns about a potential recession are weighing on the crypto market as well. This fear, combined with an increasing demand for cash, has led to a rise in ETF outflows. Over the last seven days, Bitcoin ETFs have experienced six consecutive days of outflows.
Even Ethereum spot ETFs saw a total net outflow of $47.4 million. The Grayscale Ethereum Trust (ETH) (NYSE: ETHE) recorded a $52.3 million outflow, partly offset by a $4.9 million inflow into the Fidelity Ethereum Fund (NYSE: FETH). The overall value of Ethereum spot ETFs is now $6.758 billion, according to the latest data.
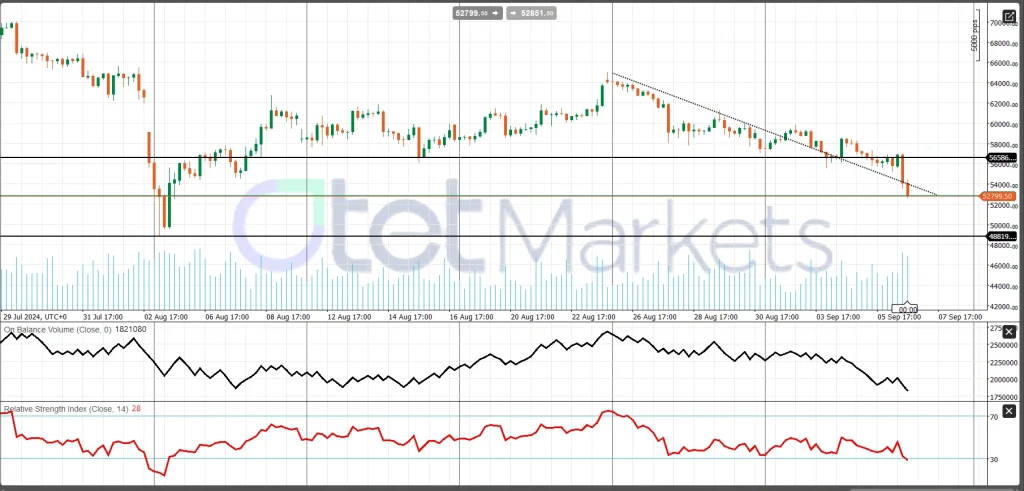
Technical Analysis: BTC/USD on the H4 Chart
BTC/USD has been in a downtrend, as indicated by the descending trend line connecting the highs from late August to early September. This trend line acts as a dynamic resistance level.
The price has recently broken below a significant horizontal support level of around 54,000, suggesting a continuation of the bearish momentum.
On Balance Volume (OBV) shows a slight increase in volume on down days (noted by the blue bars), which typically confirms the ongoing downtrend, as selling pressure is dominant.
The Relative Strength Index (RSI) is hovering around 28, which is below the typical oversold threshold of 30. This indicates that the asset might be oversold in the short term, suggesting a potential for a price rebound or stabilization, although this is not guaranteed.
The descending trend line, currently near 56,500, could act as the immediate resistance. The previous support level around 54,000 might now act as resistance after the price broke below it.
The next potential support level could be around 52,000, where the price showed some consolidation in the past before moving upward. If the price breaks below 52,000, further support might be found at lower historical levels (not visible on the current chart).
Overall, Bitcoin is currently in a bearish phase, confirmed by both the price action below the descending trend line and the bearish volume indication from the OBV. The RSI suggests the asset is potentially oversold, which might lead to a temporary pullback or merger. However, the overall momentum remains downward, so caution should be exercised. Watching for a potential retest of the broken support at 54,000 or any reversal patterns near the current levels could be crucial for short-term trading decisions.
Share
Hot topics

Best broker for gold trading
There’s always been a certain magic about gold. Before online charts and trading applications, people stored their wealth in coins and bars, trusting that gold would retain its value during...
Read more


Submit comment
Your email address will not be published. Required fields are marked *